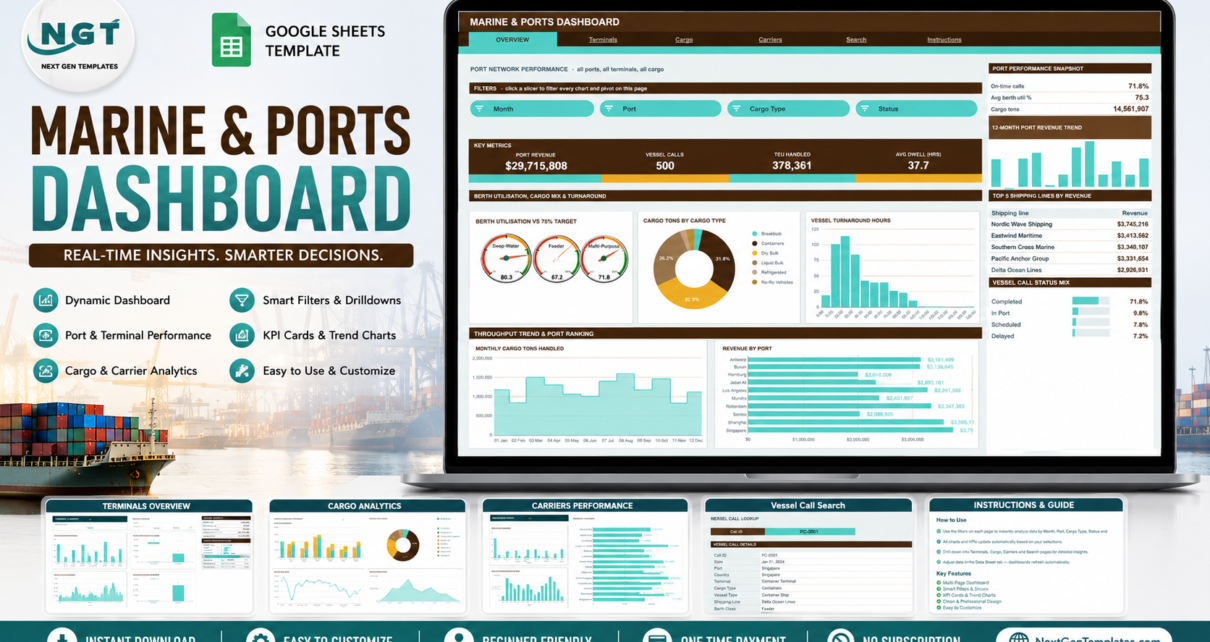
The Marine & Ports Dashboard in Google Sheets reports vessel calls, cargo tonnage, TEU, berth utilisation and shipping line revenue across 6 tabs, 16 KPI cards, 18 pivot-driven charts and 15 slicers – a one-time-purchase reporting layer over your own vessel call log.
Tag: cargo throughput tracker
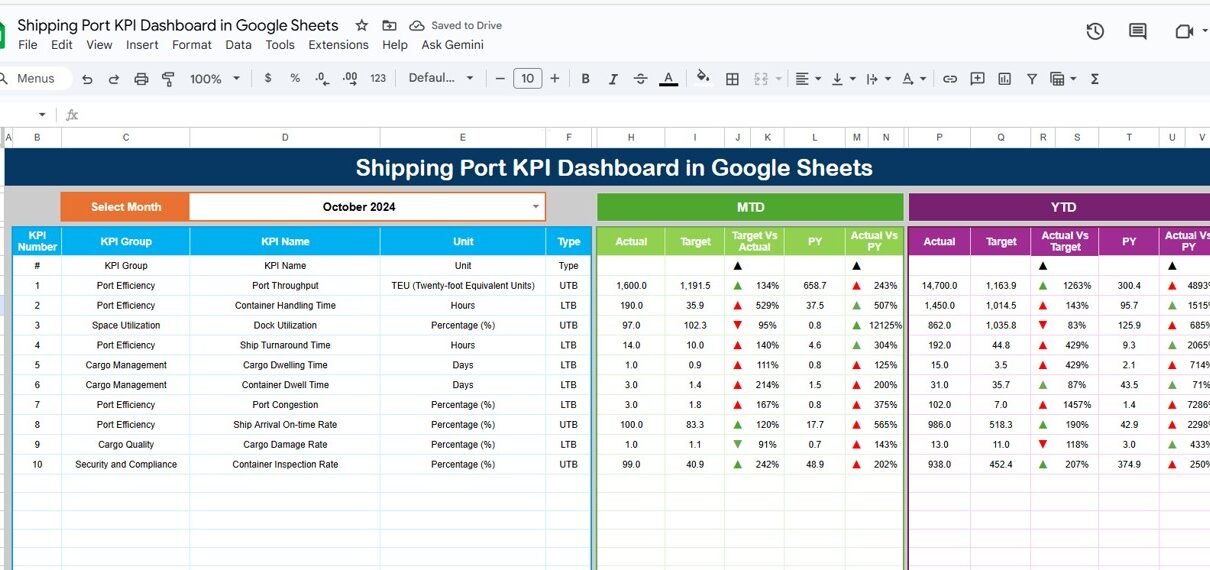
Shipping Port KPI Dashboard in Google Sheets
Managing port operations involves monitoring vessel movements, cargo throughput, and resource utilization to ensure smooth and efficient logistics. The Shipping Port KPI Dashboard in Google Sheets is a ready-to-use, data-driven solution that provides a complete overview of port performance — enabling port authorities, logistics managers, and terminal operators to make informed decisions. This article explains […]