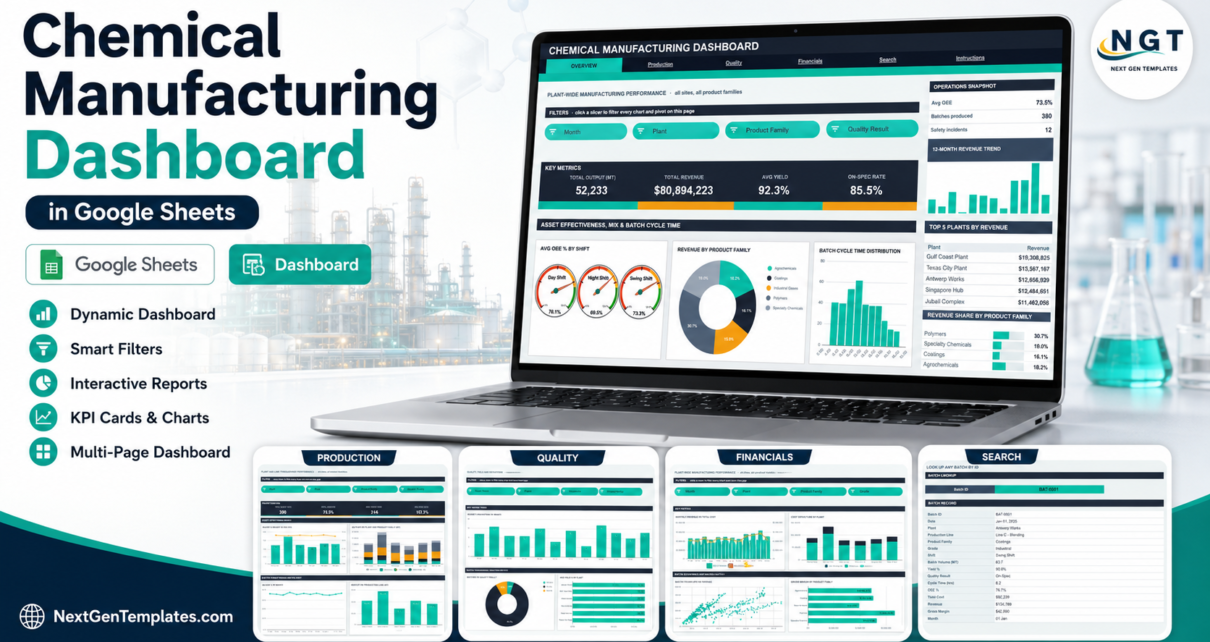
A production-reporting dashboard for chemical plants built entirely in Google Sheets: 6 tabs, 16 KPI cards, 18 native charts and 15 slicers over a 380-batch demo dataset covering output, yield, OEE, cost and margin.
Online Tutorial for Data Analysis and Automation
A production-reporting dashboard for chemical plants built entirely in Google Sheets: 6 tabs, 16 KPI cards, 18 native charts and 15 slicers over a 380-batch demo dataset covering output, yield, OEE, cost and margin.
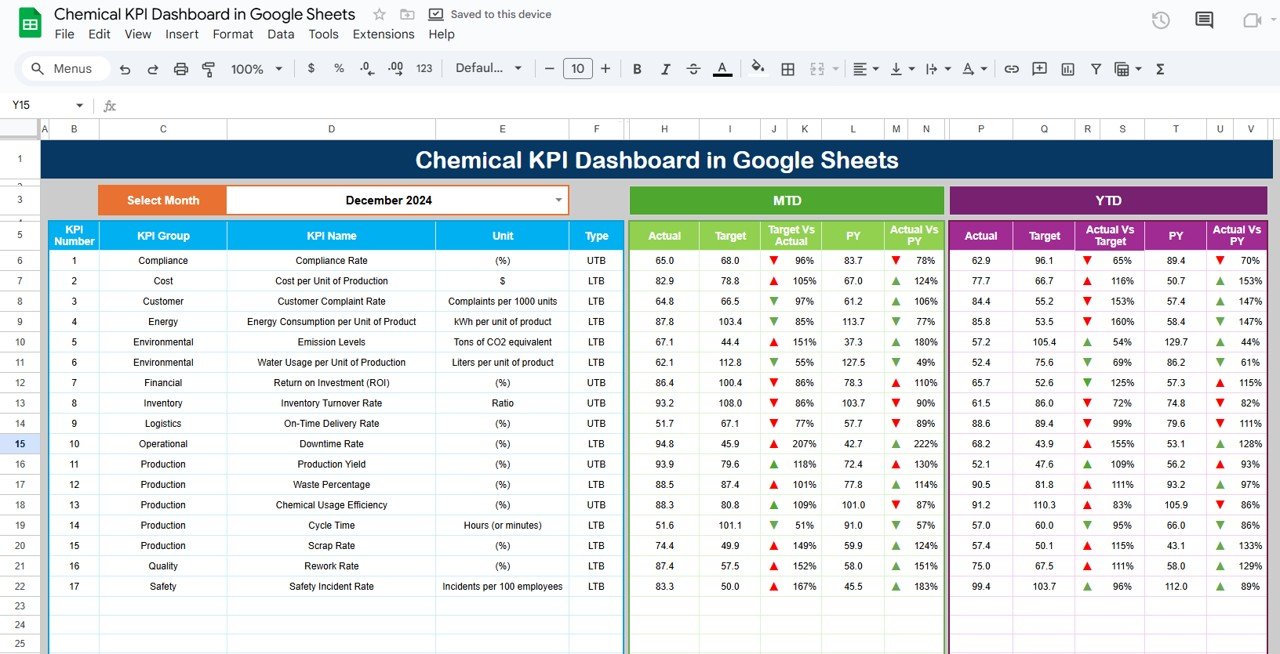
In this article, we will explore the Chemical KPI Dashboard in Google Sheets—a ready-to-use template designed to help chemical businesses track essential KPIs. This dashboard enables businesses to monitor performance in real-time, compare actual data with targets, and make data-driven decisions for process improvements. Key Features of the Chemical KPI Dashboard in Google Sheets Before […]