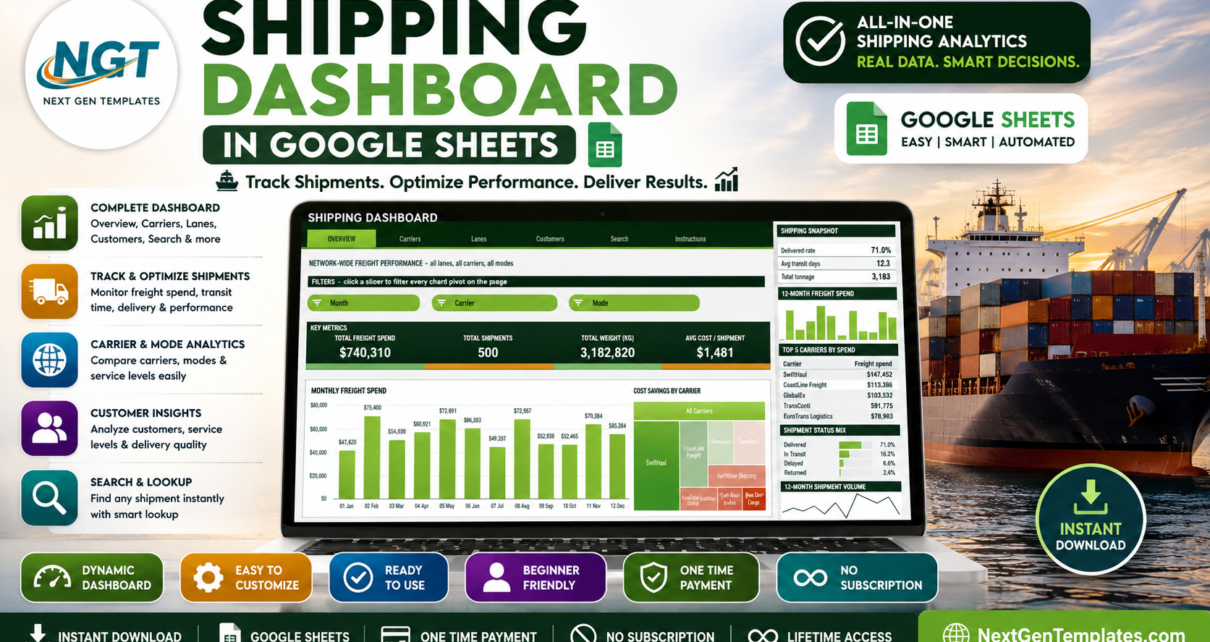
A five-page Shipping Dashboard in Google Sheets built on native pivot tables and slicers – freight spend, carrier mix, trade lanes, customer delivery quality and a shipment-ID lookup, with 500 sample shipments loaded and room for 1,000 rows.
Online Tutorial for Data Analysis and Automation
A five-page Shipping Dashboard in Google Sheets built on native pivot tables and slicers – freight spend, carrier mix, trade lanes, customer delivery quality and a shipment-ID lookup, with 500 sample shipments loaded and room for 1,000 rows.
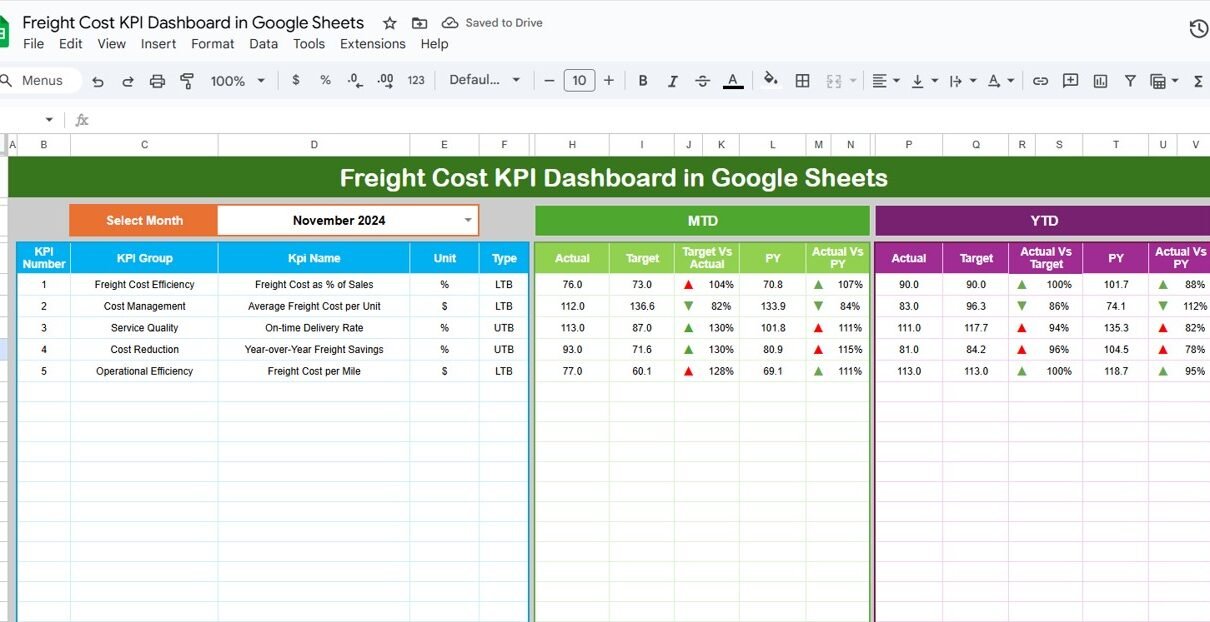
Managing freight costs remains one of the biggest challenges in logistics and supply chain operations. Transport rates change often, fuel prices rise without warning, and delays create additional expenses. When teams track this information manually, they struggle to identify trends, compare monthly performance, and take quick action. However, a Freight Cost KPI Dashboard in Google […]