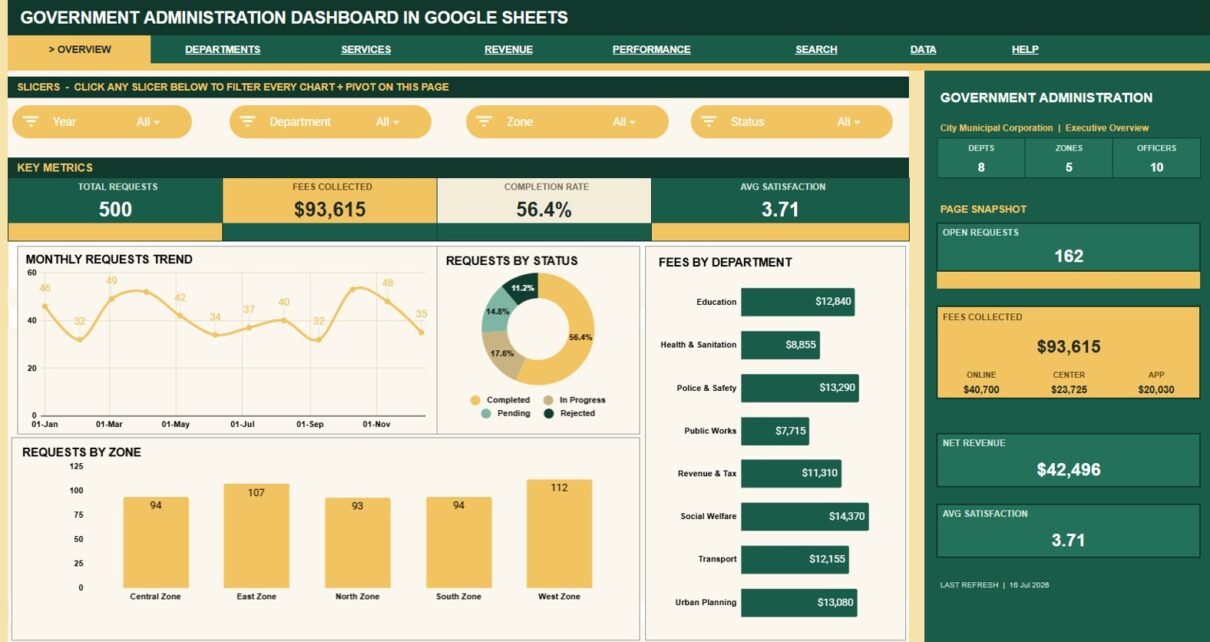
Review the Government Administration Dashboard in Google Sheets: seven reporting pages, nine KPI cards, 16 chart views, slicers, request lookup, and editable data tabs for public administration teams.
Online Tutorial for Data Analysis and Automation
Review the Government Administration Dashboard in Google Sheets: seven reporting pages, nine KPI cards, 16 chart views, slicers, request lookup, and editable data tabs for public administration teams.
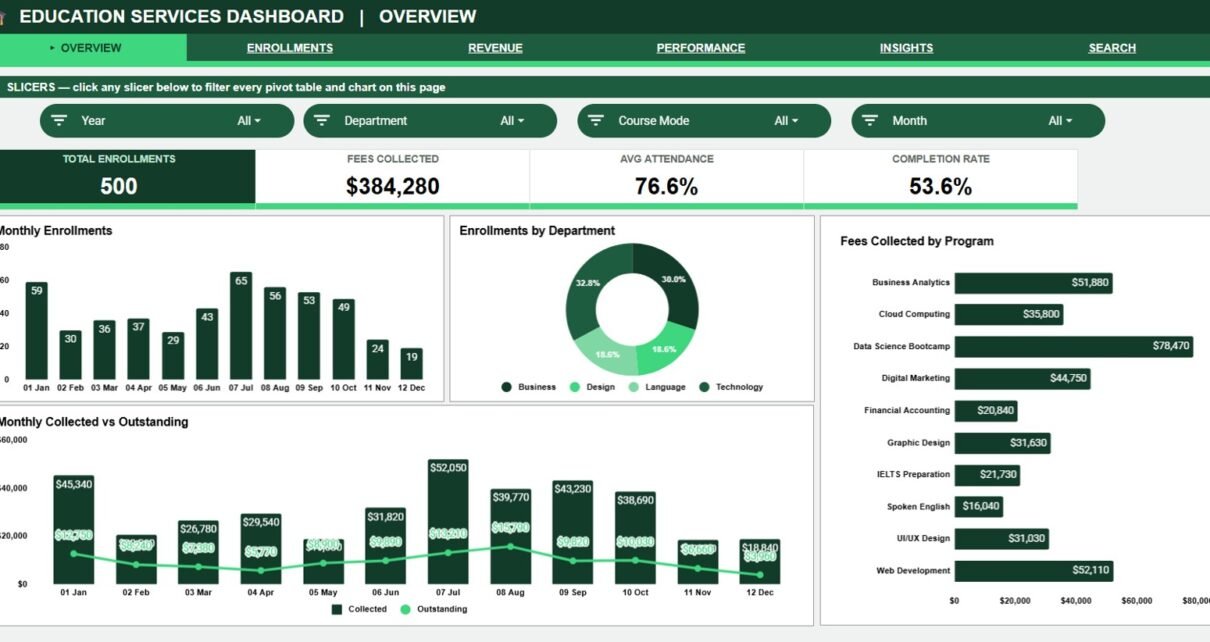
The Education Services Dashboard in Google Sheets tracks 4 KPIs and 20 charts across 5 analysis pages, plus a Search sheet that returns 17 fields for any student by Enrollment ID. Setup takes under 10 minutes.
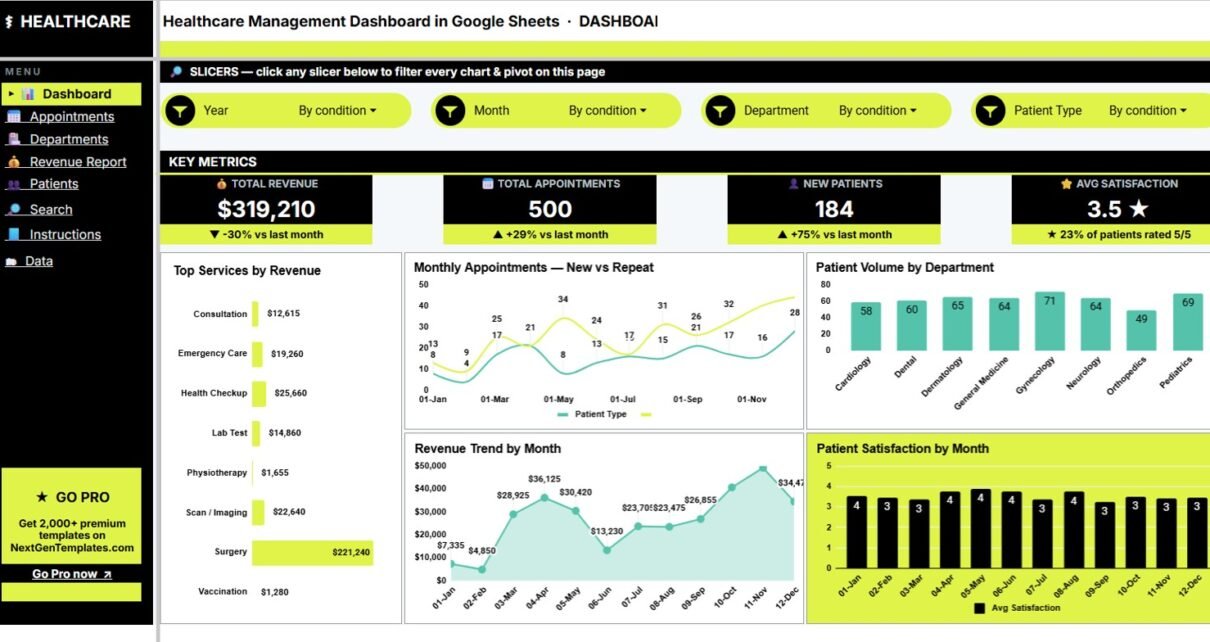
Healthcare Management Dashboard in Google Sheets with 7 tabs, 4 KPI cards, 21 chart views, slicers, Appointment ID lookup, and editable source data.
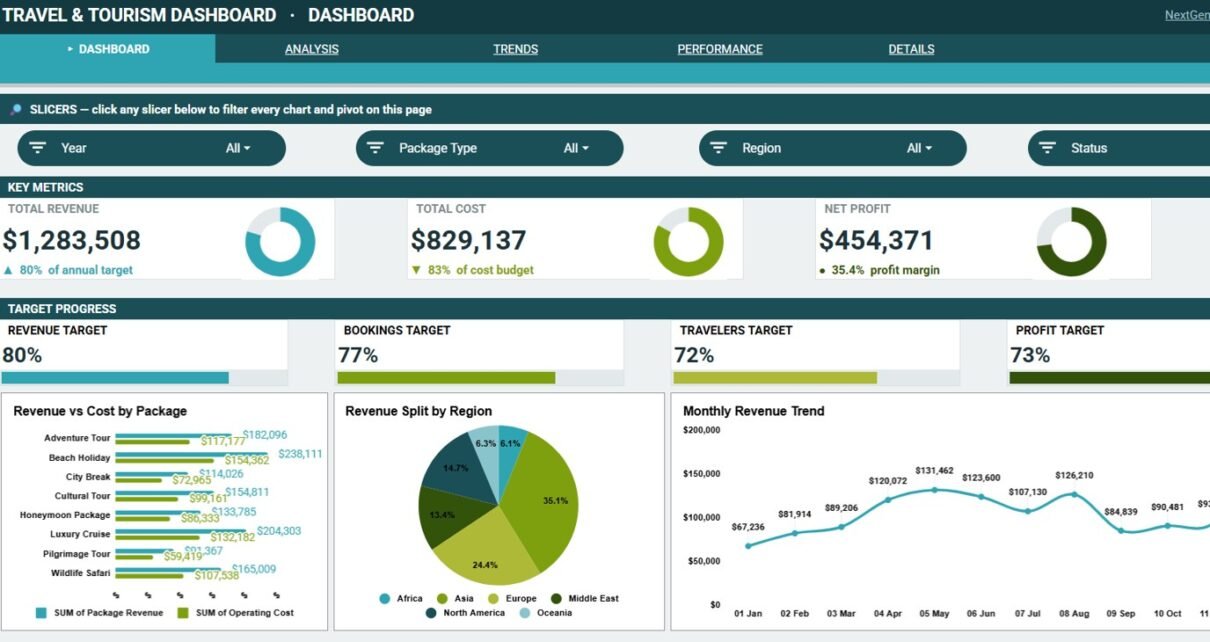
Review the Travel and Tourism Dashboard in Google Sheets with Overview, Analysis, Trends, Performance, Details, and Data Sheet tabs for revenue, bookings, travelers, cost, and profit reporting.
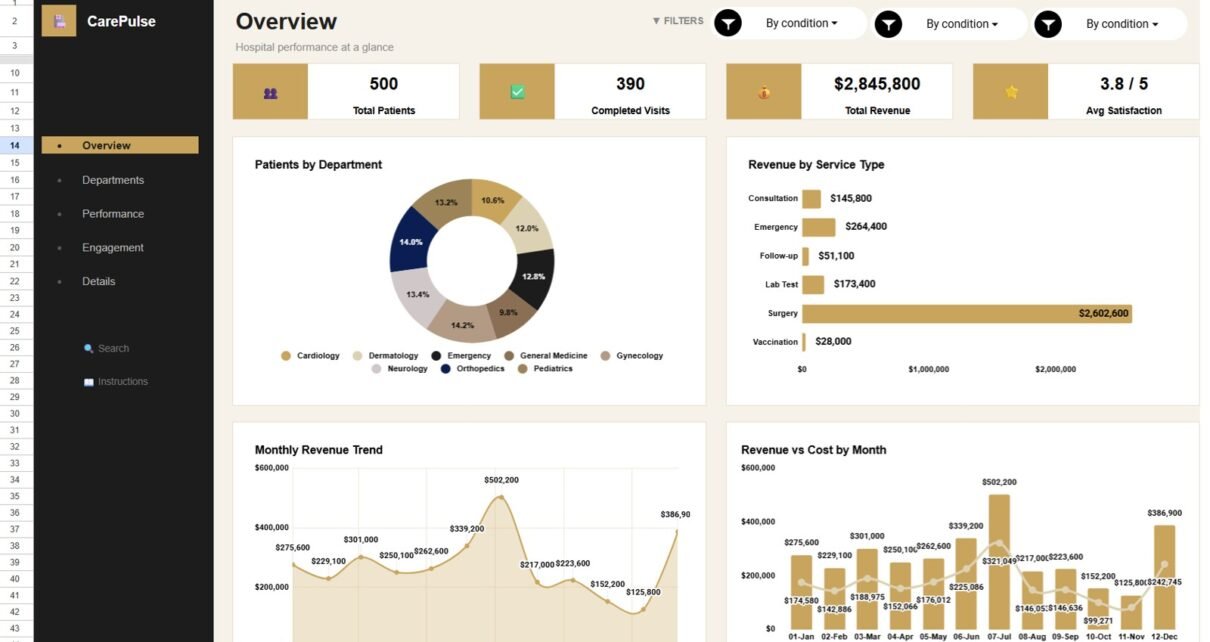
Track patients, completed visits, revenue, costs, satisfaction, departments, service types, doctor activity, Visit ID lookup, and raw healthcare services records in a Google Sheets dashboard.
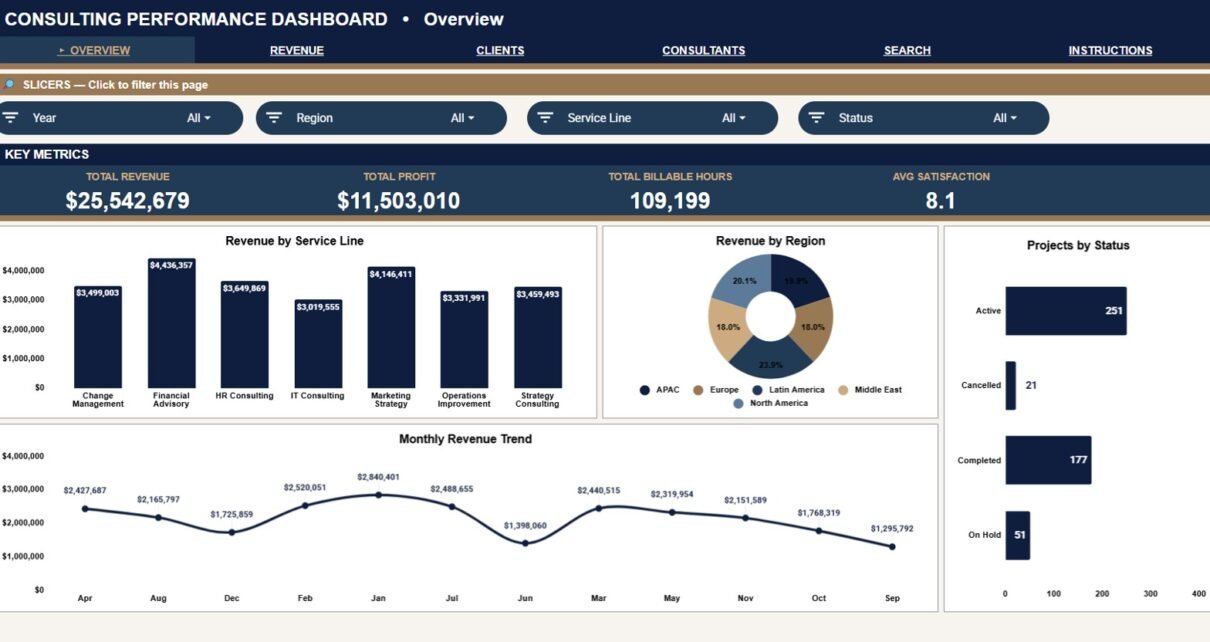
Review the Consulting Performance Dashboard in Google Sheets for revenue, profit, billable hours, client analysis, consultant performance, Project ID lookup, and data sheet reporting.
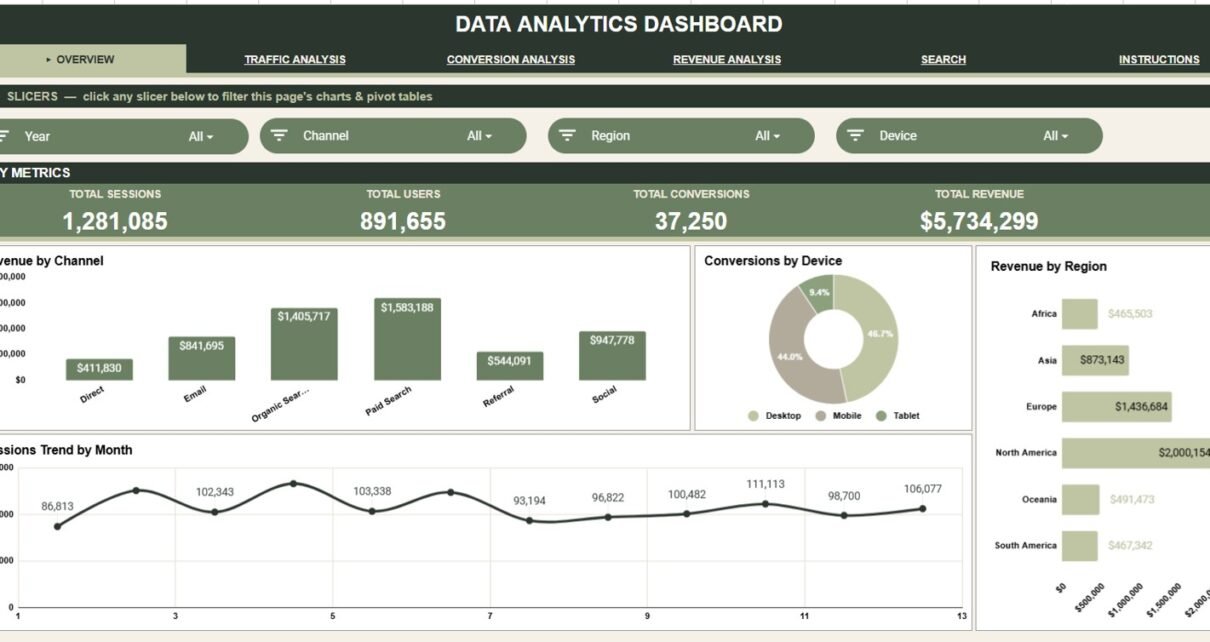
Track sessions, users, conversions, revenue, cost, channels, devices, campaigns, regions, and categories with this editable Data Analytics Dashboard in Google Sheets.
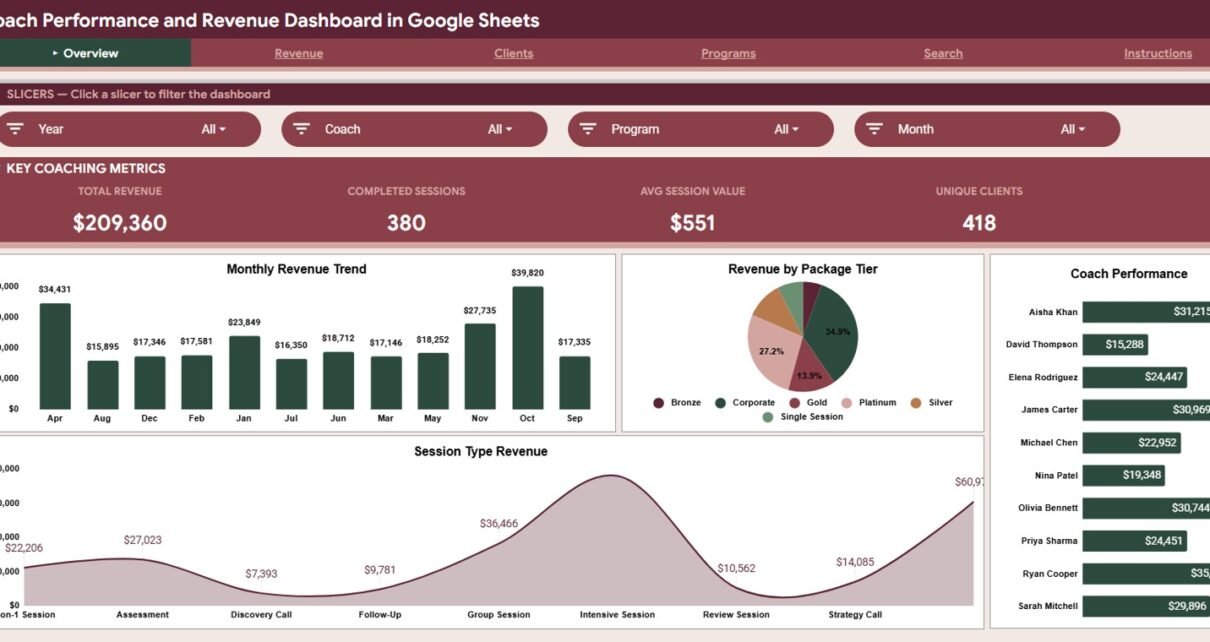
Coach Performance and Revenue Dashboard in Google Sheets tracks coaching revenue, sessions, clients, programs, package tiers, referral sources, and coach performance across 6 tabs with slicers and Session ID lookup.
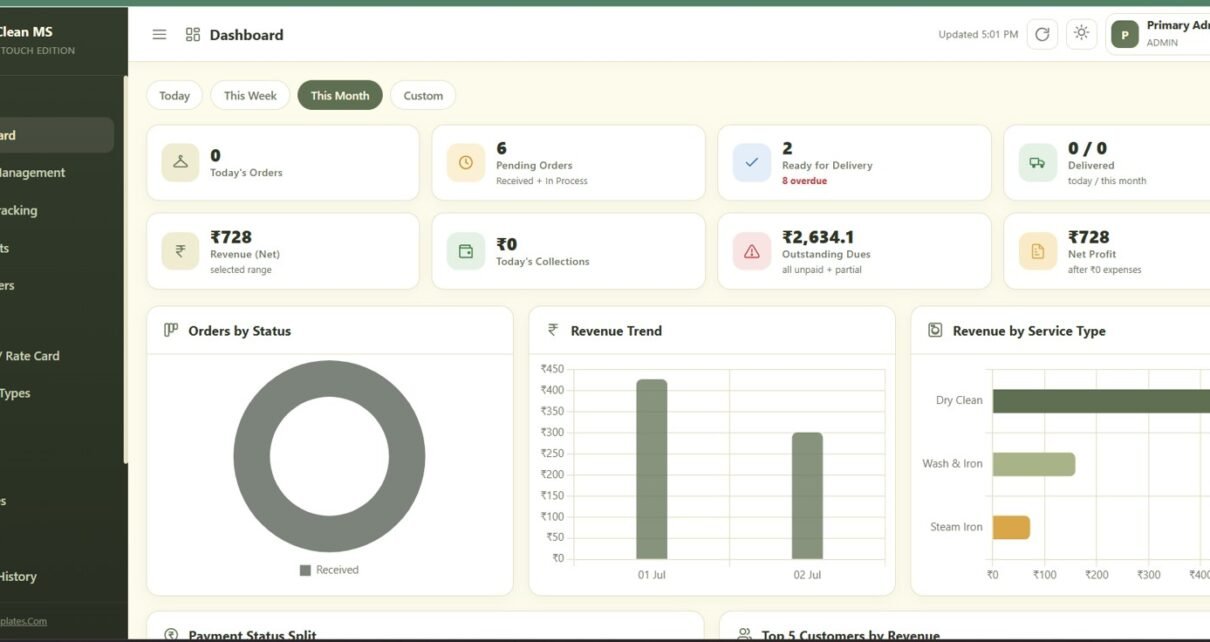
The Dry Clean Service Management System Web App runs 13 connected screens — from multi-garment order intake and Kanban-style status tracking to payments, staff, GST-ready invoicing and reports — inside one login-based browser tool. Its dashboard surfaces 8 KPI cards and 5 analytics widgets, and the whole system runs on Google Apps Script, so there […]
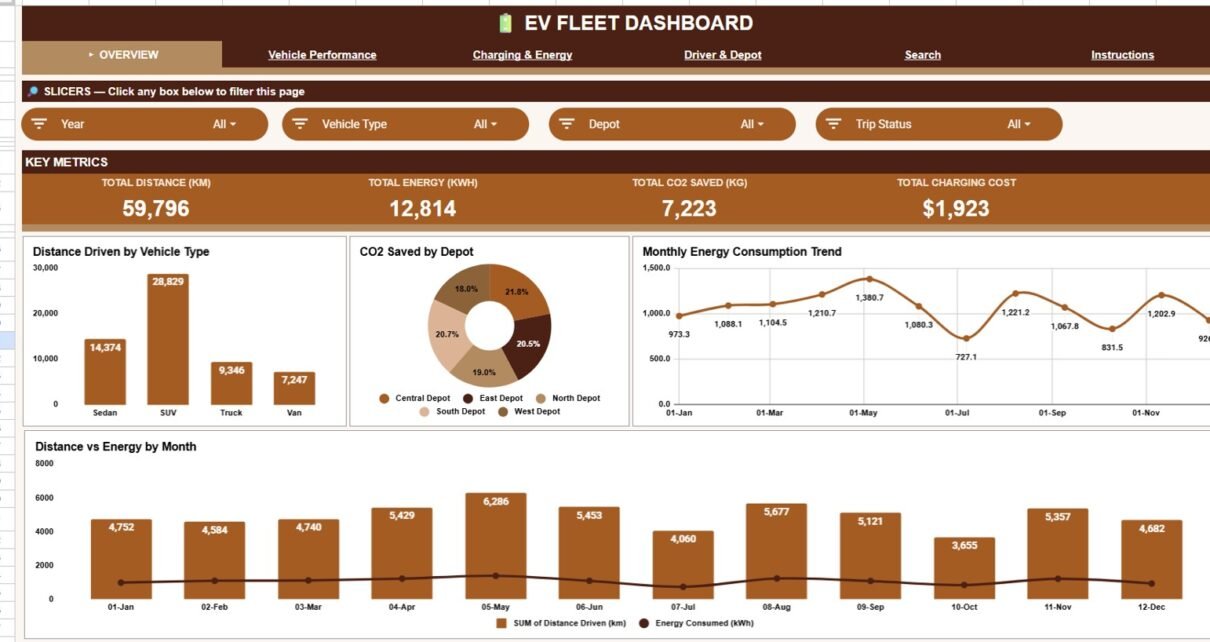
EV Fleet Dashboard in Google Sheets tracks distance, energy, CO2 saved, charging cost, vehicle performance, drivers, depots, and trip lookup across 6 tabs and 16 chart views.