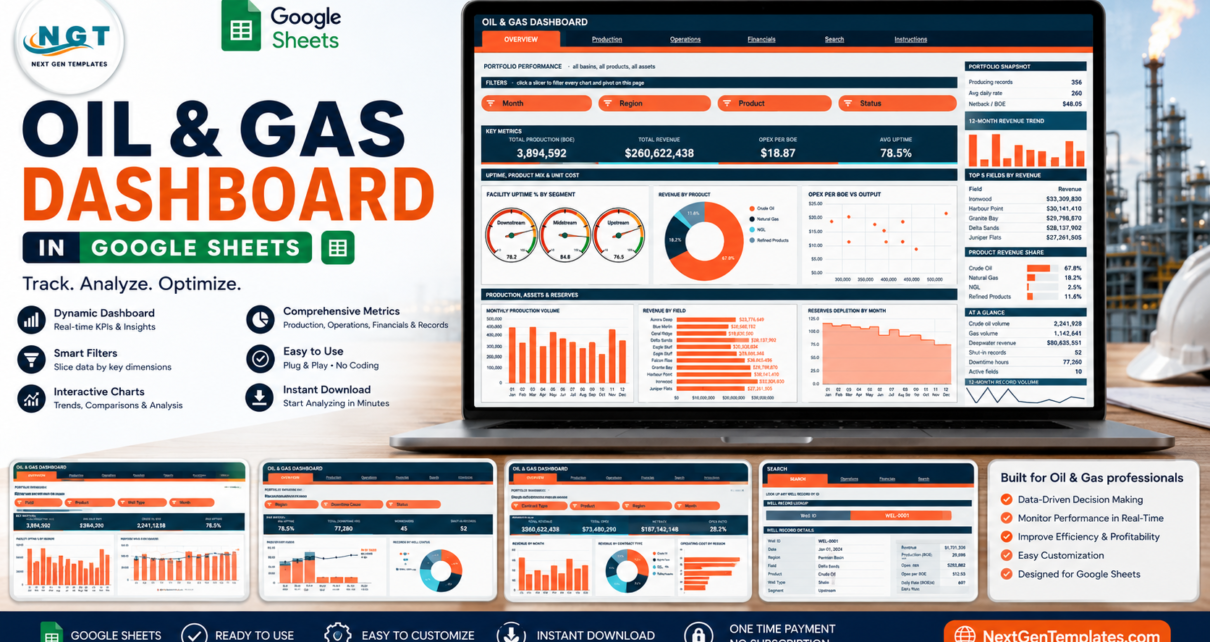
A walkthrough of the Oil & Gas Dashboard in Google Sheets – 6 tabs, 16 KPI cards, 18 pivot-driven charts and 15 native slicers for production, uptime, operating cost and netback reporting, with 500 rows of labelled demo data to start from.
Online Tutorial for Data Analysis and Automation
A walkthrough of the Oil & Gas Dashboard in Google Sheets – 6 tabs, 16 KPI cards, 18 pivot-driven charts and 15 native slicers for production, uptime, operating cost and netback reporting, with 500 rows of labelled demo data to start from.