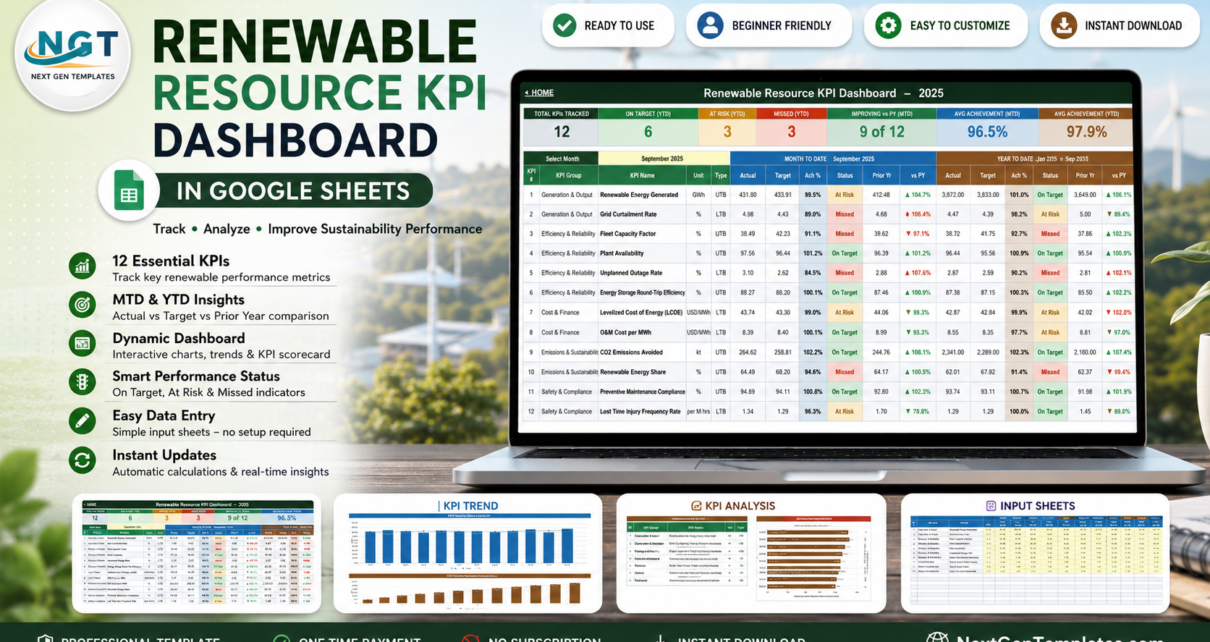
The Renewable Resource KPI Dashboard in Google Sheets tracks 12 KPIs across 5 groups on 6 linked sheets – MTD and YTD actual versus target versus prior year, traffic lights, a KPI trend page and a group roll-up, all driven by one month dropdown.
Online Tutorial for Data Analysis and Automation
The Renewable Resource KPI Dashboard in Google Sheets tracks 12 KPIs across 5 groups on 6 linked sheets – MTD and YTD actual versus target versus prior year, traffic lights, a KPI trend page and a group roll-up, all driven by one month dropdown.