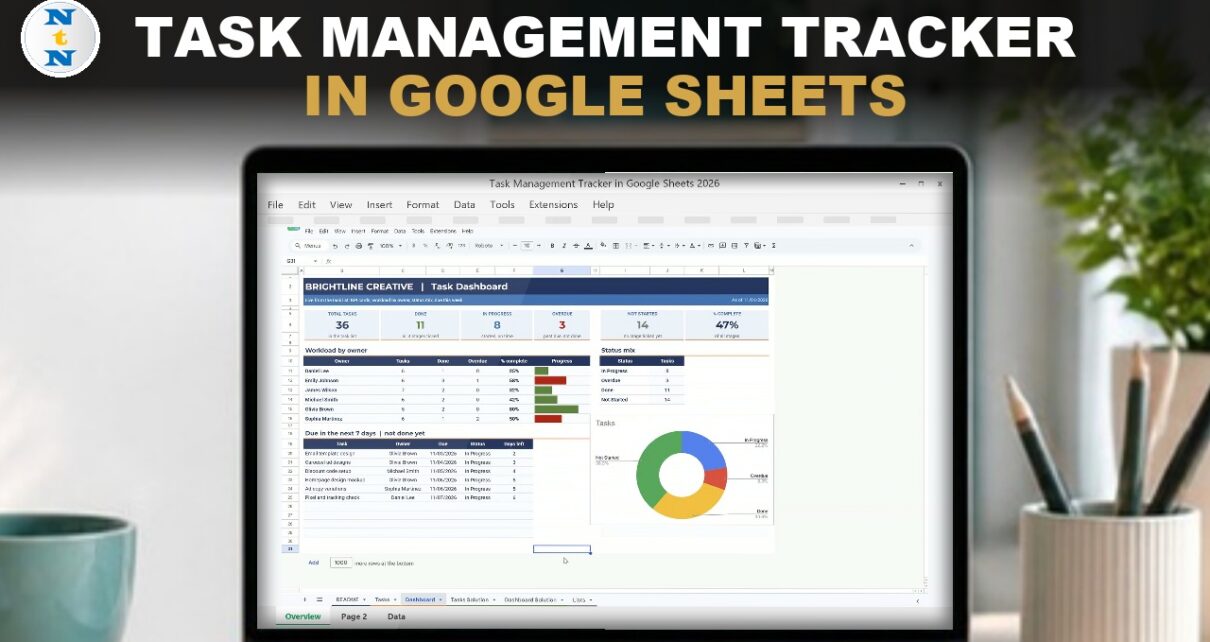
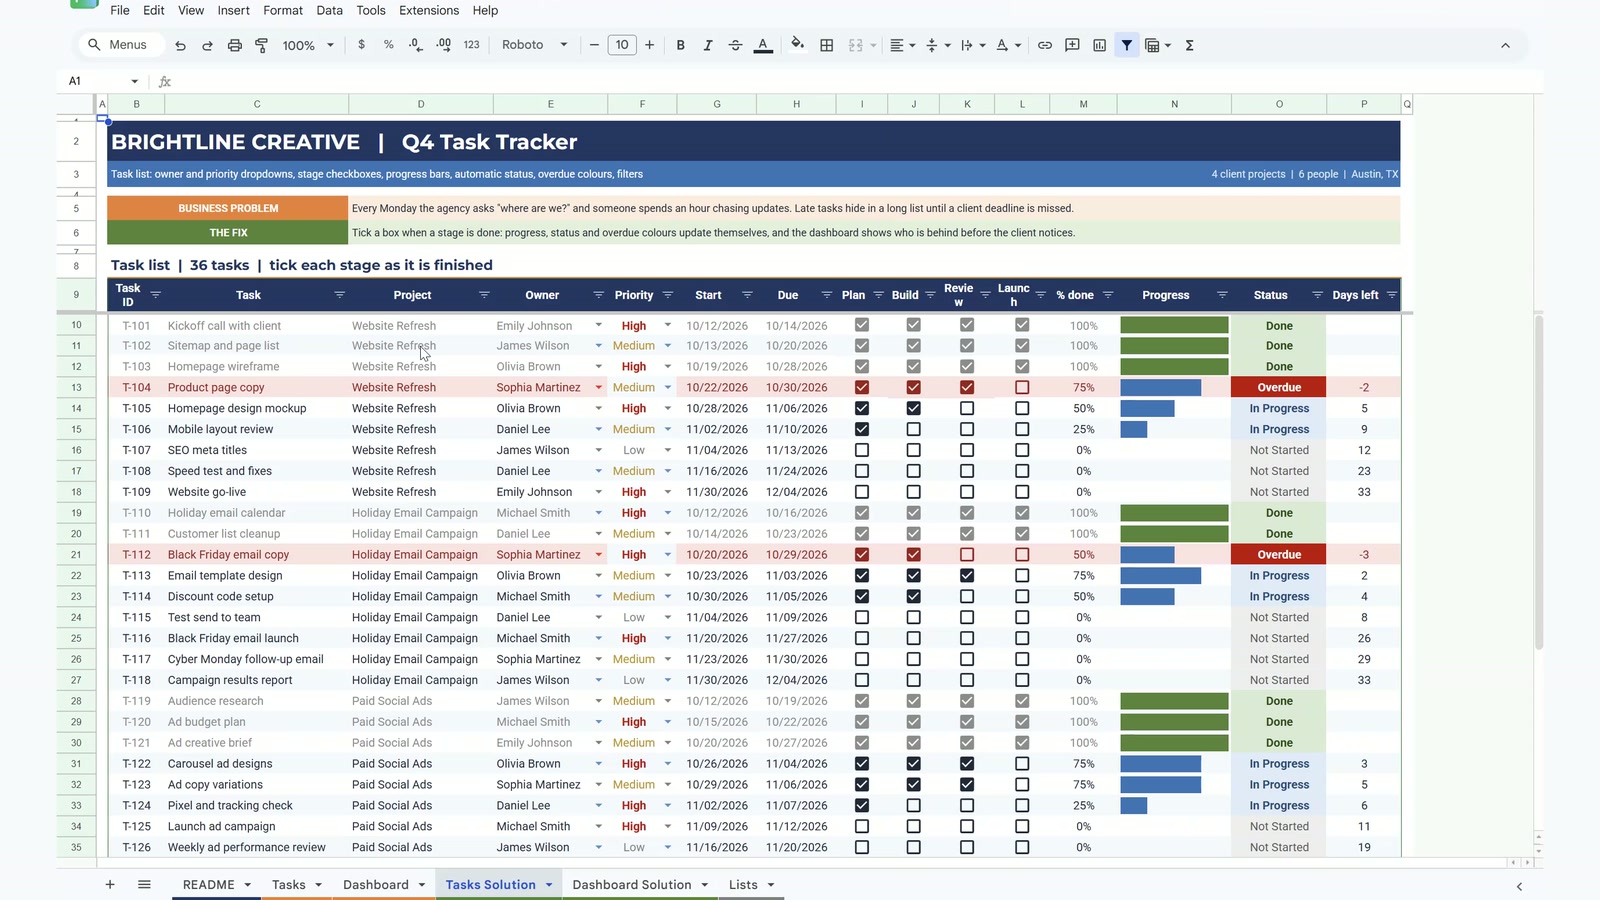
Every Monday the agency asks “where are we?” and someone spends an hour chasing updates. Late tasks hide in a long list until a client deadline is missed. This task management tracker in Google Sheets fixes that: tick a box when a stage is finished and the progress bar, the status, the red overdue rows and the dashboard update on their own. In the 16-minute video you build it from a blank task list for Brightline Creative, a made-up marketing agency in Austin with 4 client projects, 6 people and 36 tasks. Built-in features and formulas only, no add-ons.
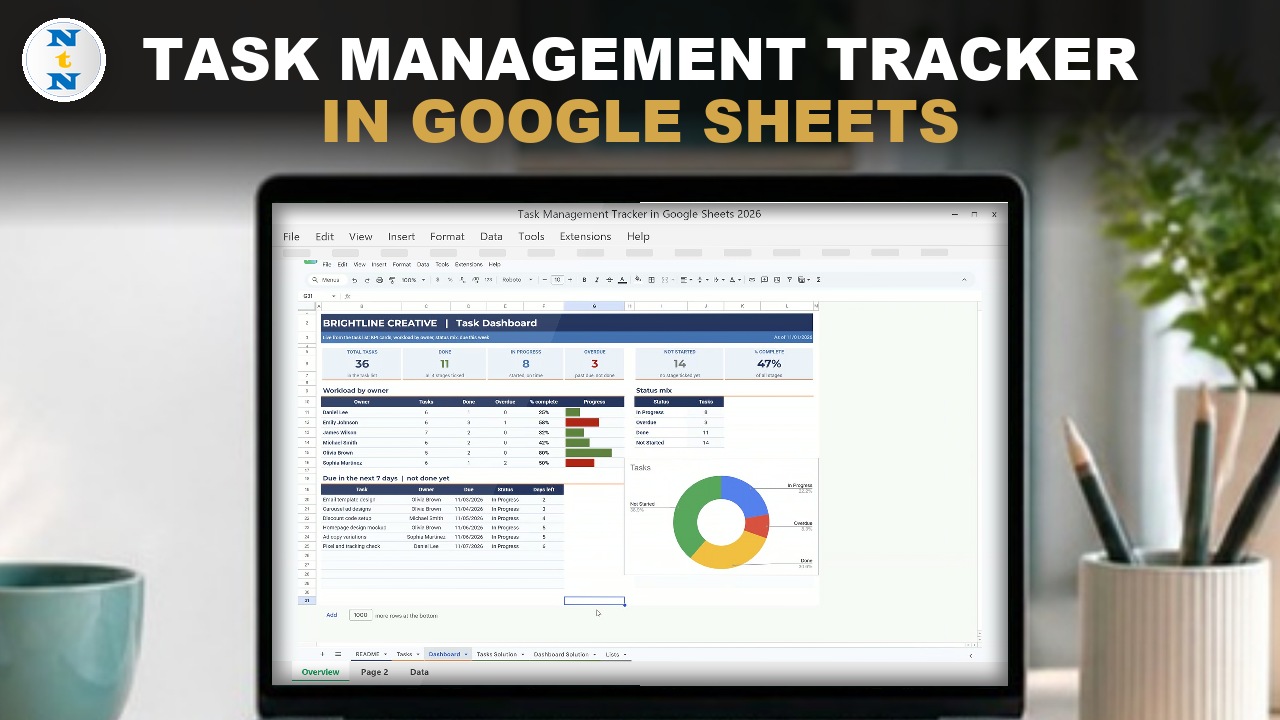
Watch the Video Tutorial
Video Overview
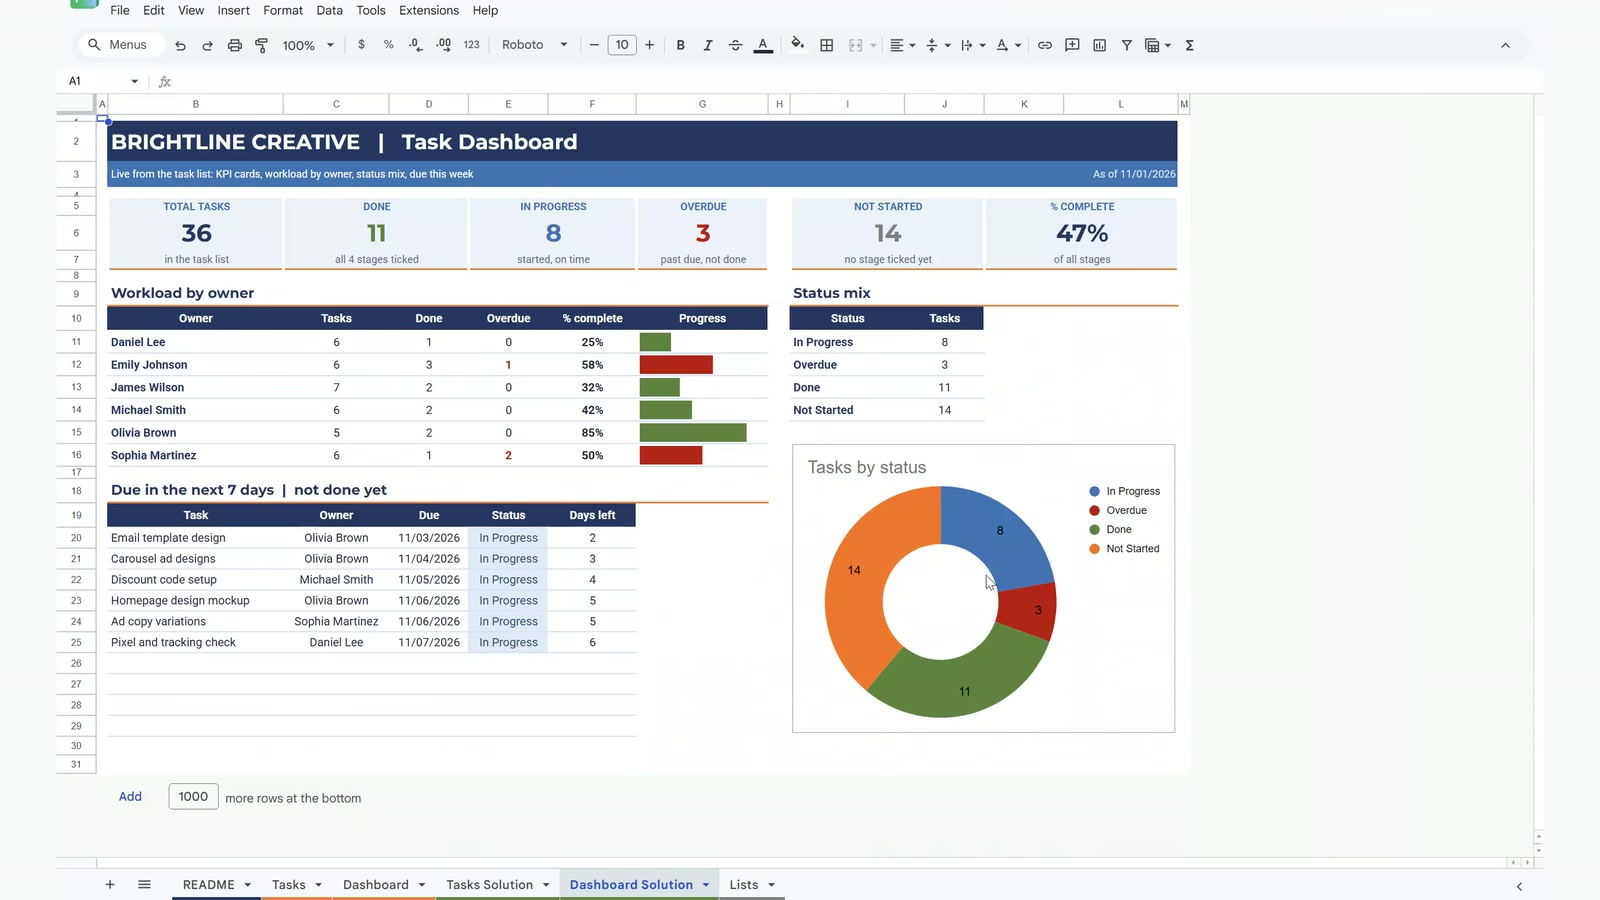
The video opens with a look at the finished tracker, then builds twelve steps: owner and priority dropdowns, stage tick boxes, % done with COUNTIF, SPARKLINE progress bars, an automatic status with IF and TODAY, days left, conditional formatting for overdue rows, a filter for the Monday meeting and a dashboard with KPI cards, workload by owner, a list of tasks due in the next 7 days and a status doughnut chart. This is the 2026 rebuild of the original task tracker video.
What You Will Build
- A task list with 36 tasks across 4 projects and 6 owners, each with four stage tick boxes.
- Automatic % done, status and days left, so nobody types a status by hand.
- Red overdue rows and a progress bar that grows with every tick.
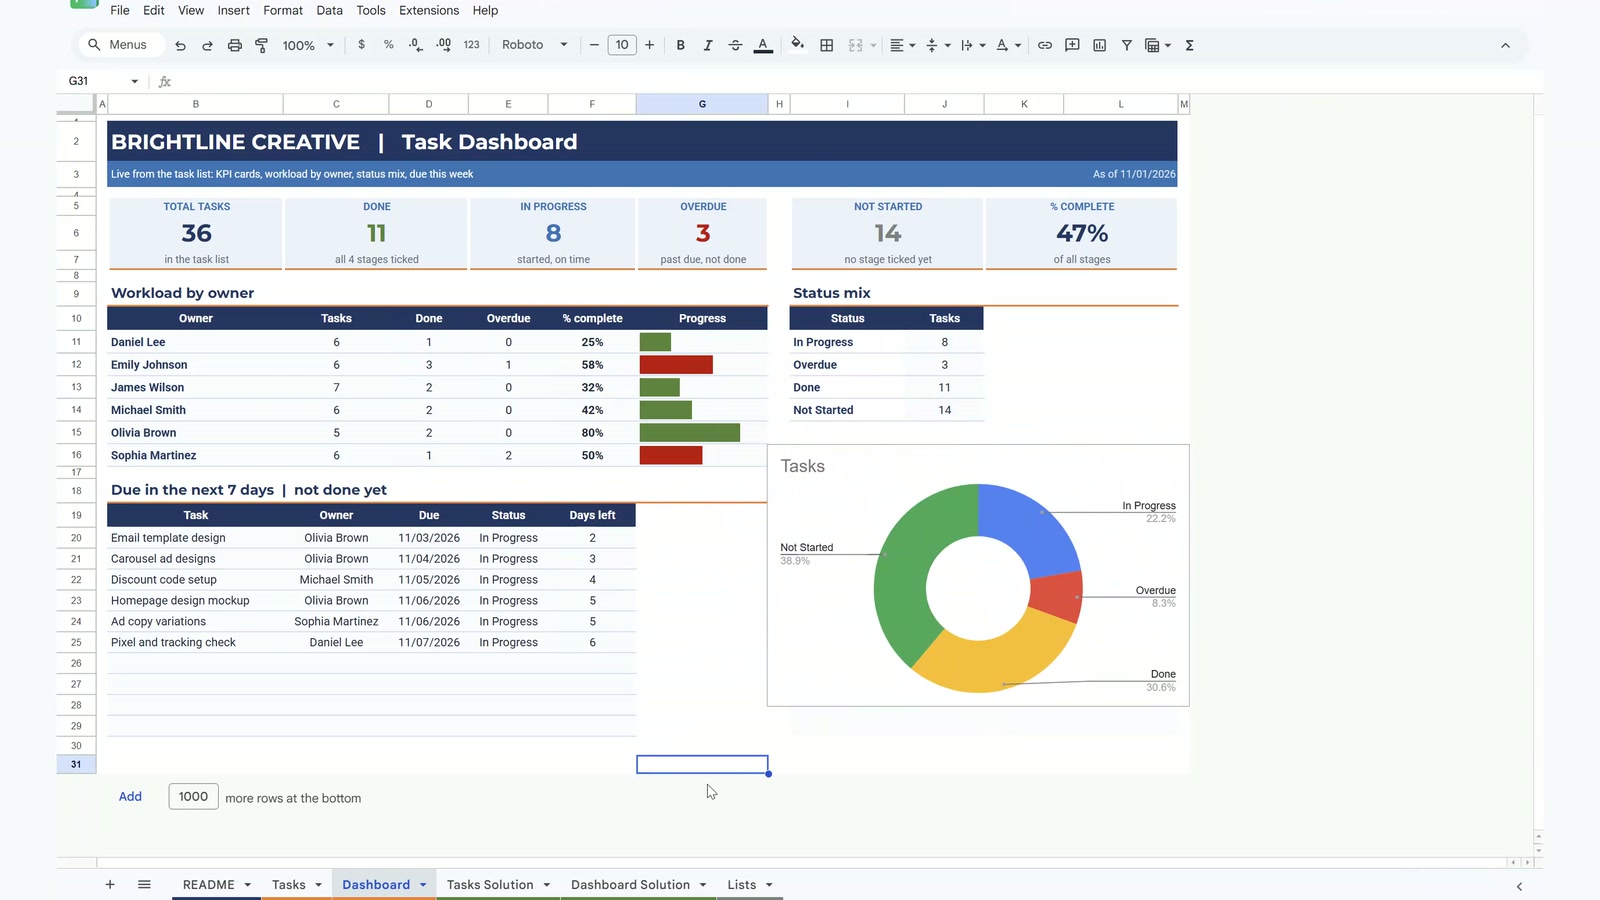
- A dashboard with six KPI cards, workload by owner, the tasks due in the next 7 days and a status doughnut chart.
Step 1: Owner and Priority Dropdowns
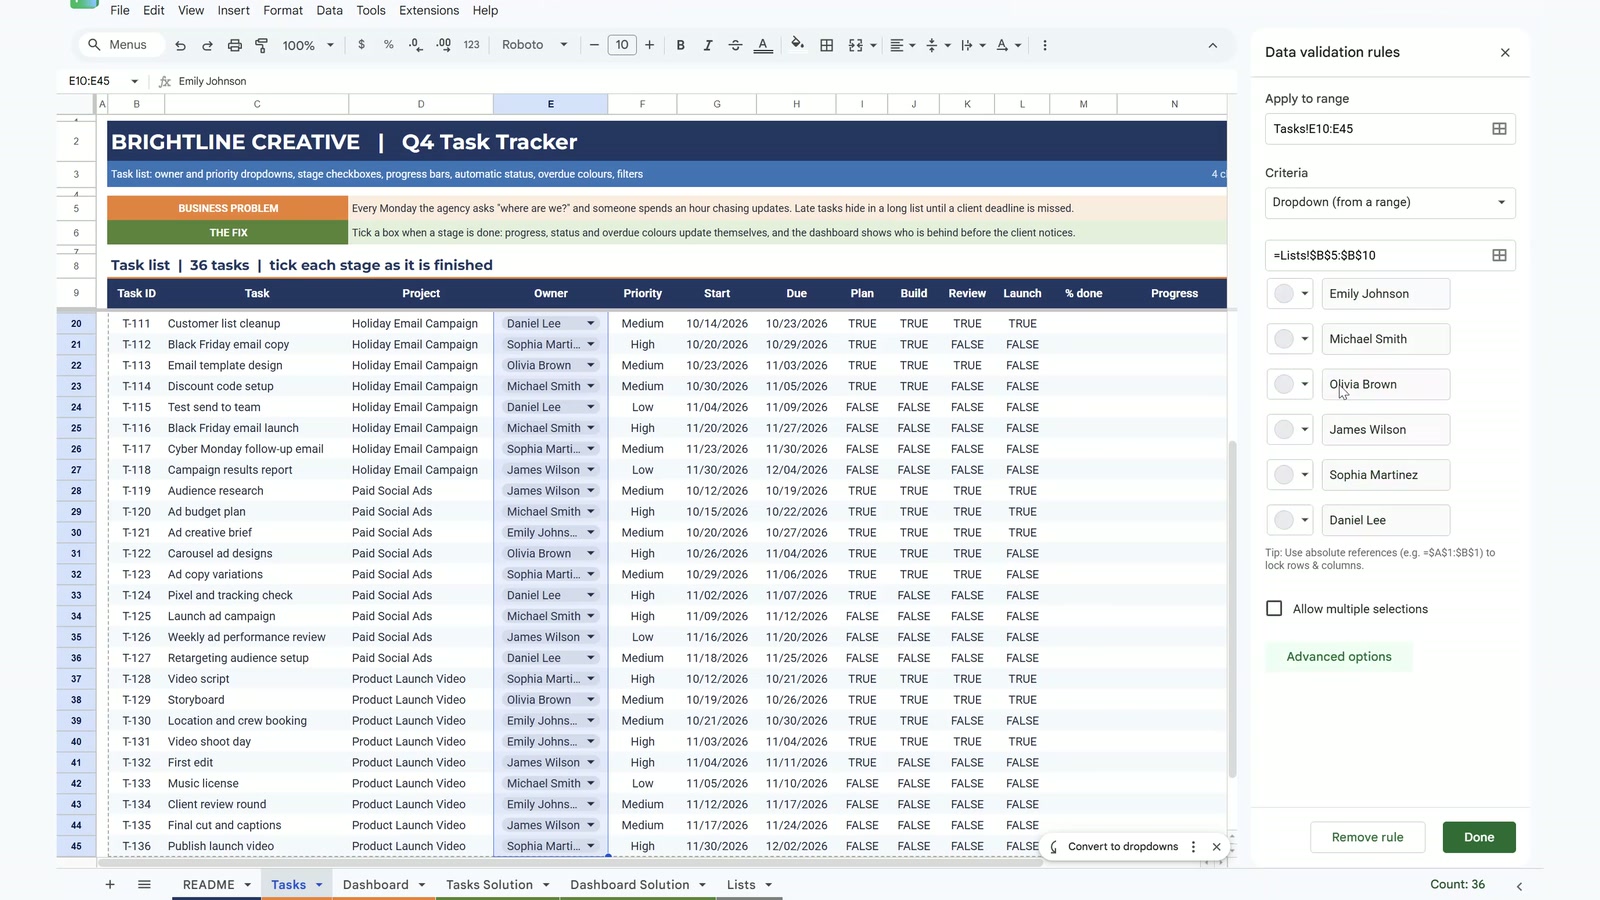
Select the Owner column, choose Data, then Data validation, and pick Dropdown (from a range) pointing at the names on the Lists sheet. Add a second dropdown for Priority with High, Medium and Low. Every task now has a clean owner and priority chip, so the dashboard can count them later without typos.
Step 2: Stage Tick Boxes
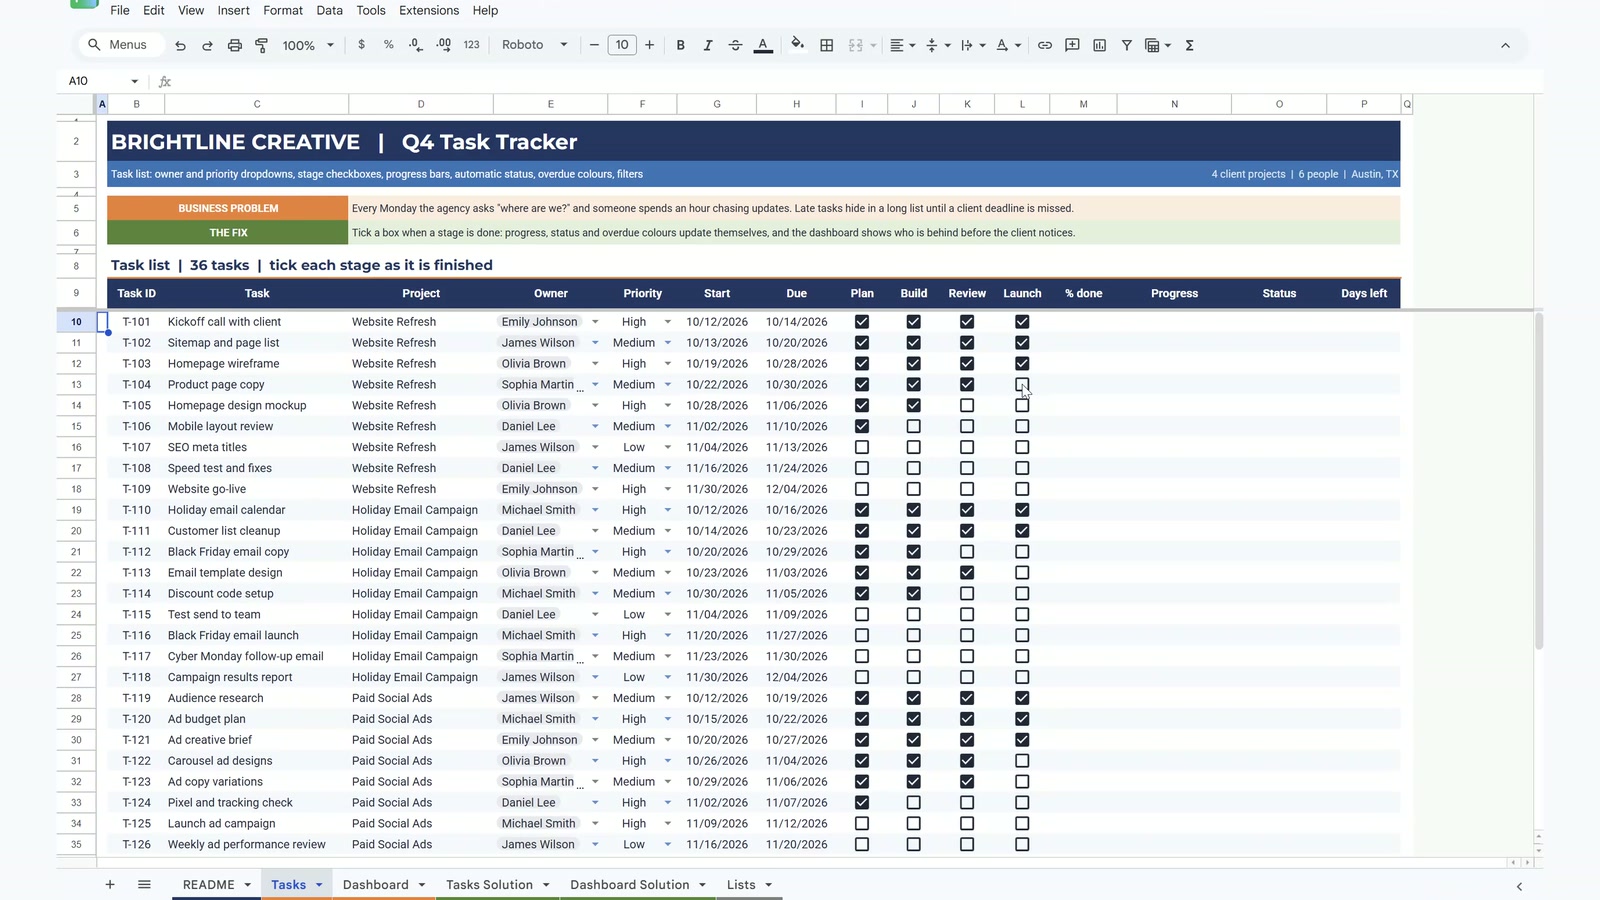
Select the four stage columns (Plan, Build, Review and Launch) and choose Insert, then Checkbox. Text that says TRUE becomes a ticked box and anything else becomes an empty one. Each task now has four stages to tick off.
Step 3: % Done with COUNTIF
Count the ticked boxes in the row and divide by four, then format the column as a percentage and double-click the fill handle to copy it down.
=COUNTIF(I10:L10,TRUE)/4Step 4: SPARKLINE Progress Bars
Draw a bar inside the cell. It is green when the task is 100% done and blue while it is still moving.
=SPARKLINE(M10,{"charttype","bar";"max",1;"color1",IF(M10=1,"#548235","#2E75B6")})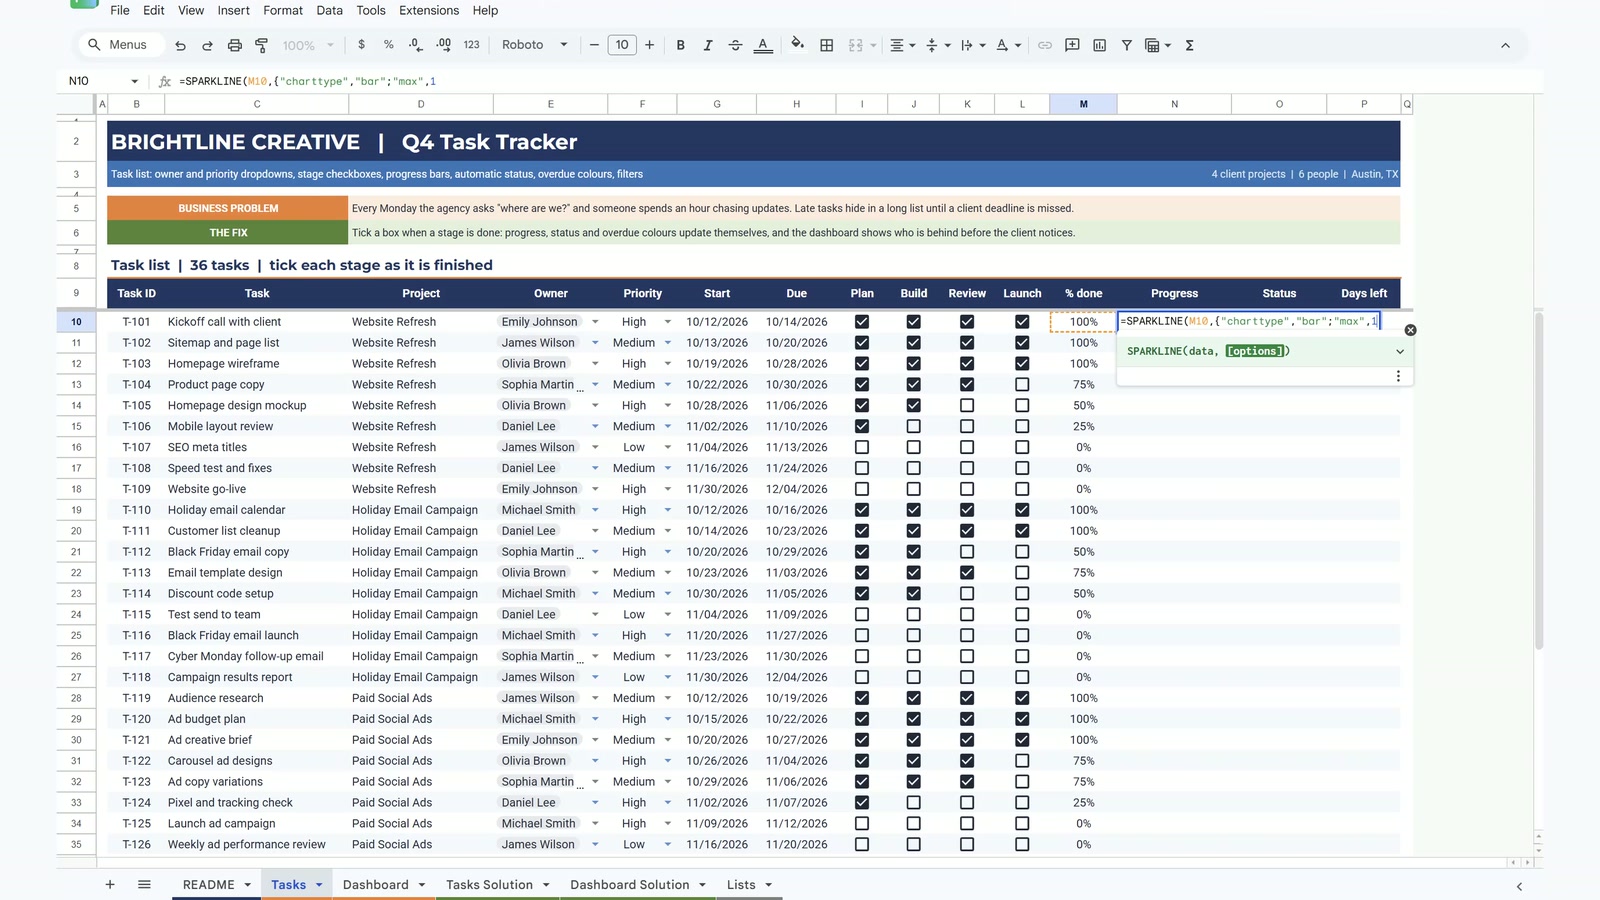
Step 5: Automatic Status with IF and TODAY
One formula decides the status: Done at 100%, Overdue when the due date is before today, Not Started at 0% and In Progress for everything else.
=IF(M10=1,"Done",IF(H10<TODAY(),"Overdue",IF(M10=0,"Not Started","In Progress")))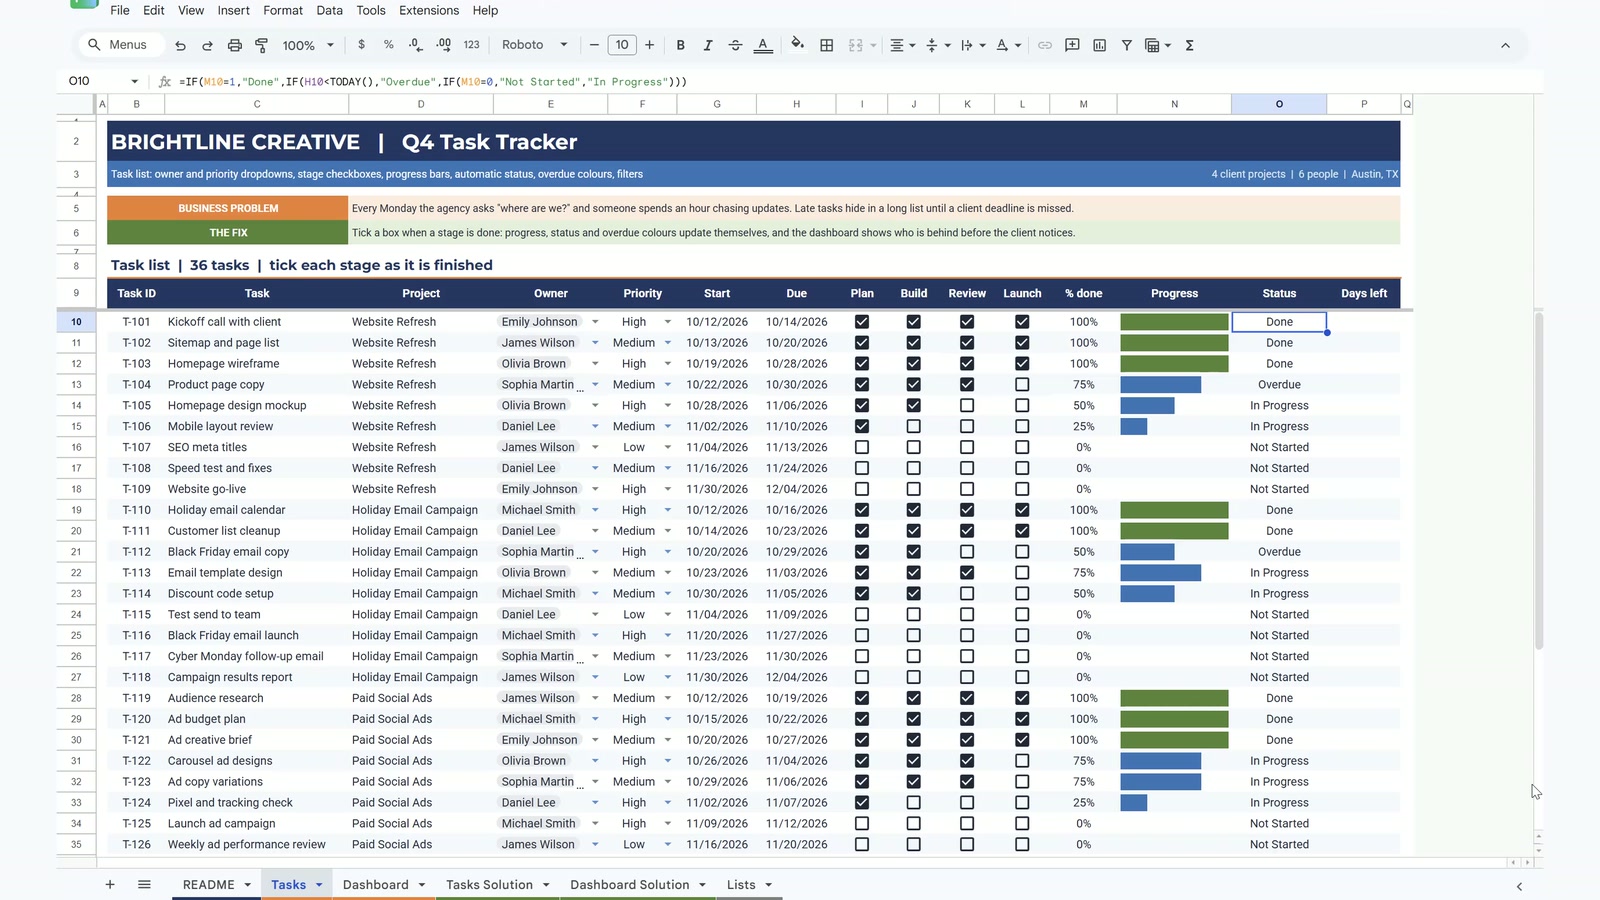
Step 6: Days Left
Show how many days remain, and keep the cell blank once the task is done.
=IF(O10="Done","",H10-TODAY())Step 7: Conditional Formatting for Overdue Rows
Select the whole task table, open Format, then Conditional formatting, choose Custom formula is and type the formula below. The dollar sign locks column O, so the whole row turns light red whenever the status says Overdue. Add a second rule for Done with grey text and colour chips for each status.
=$O10="Overdue"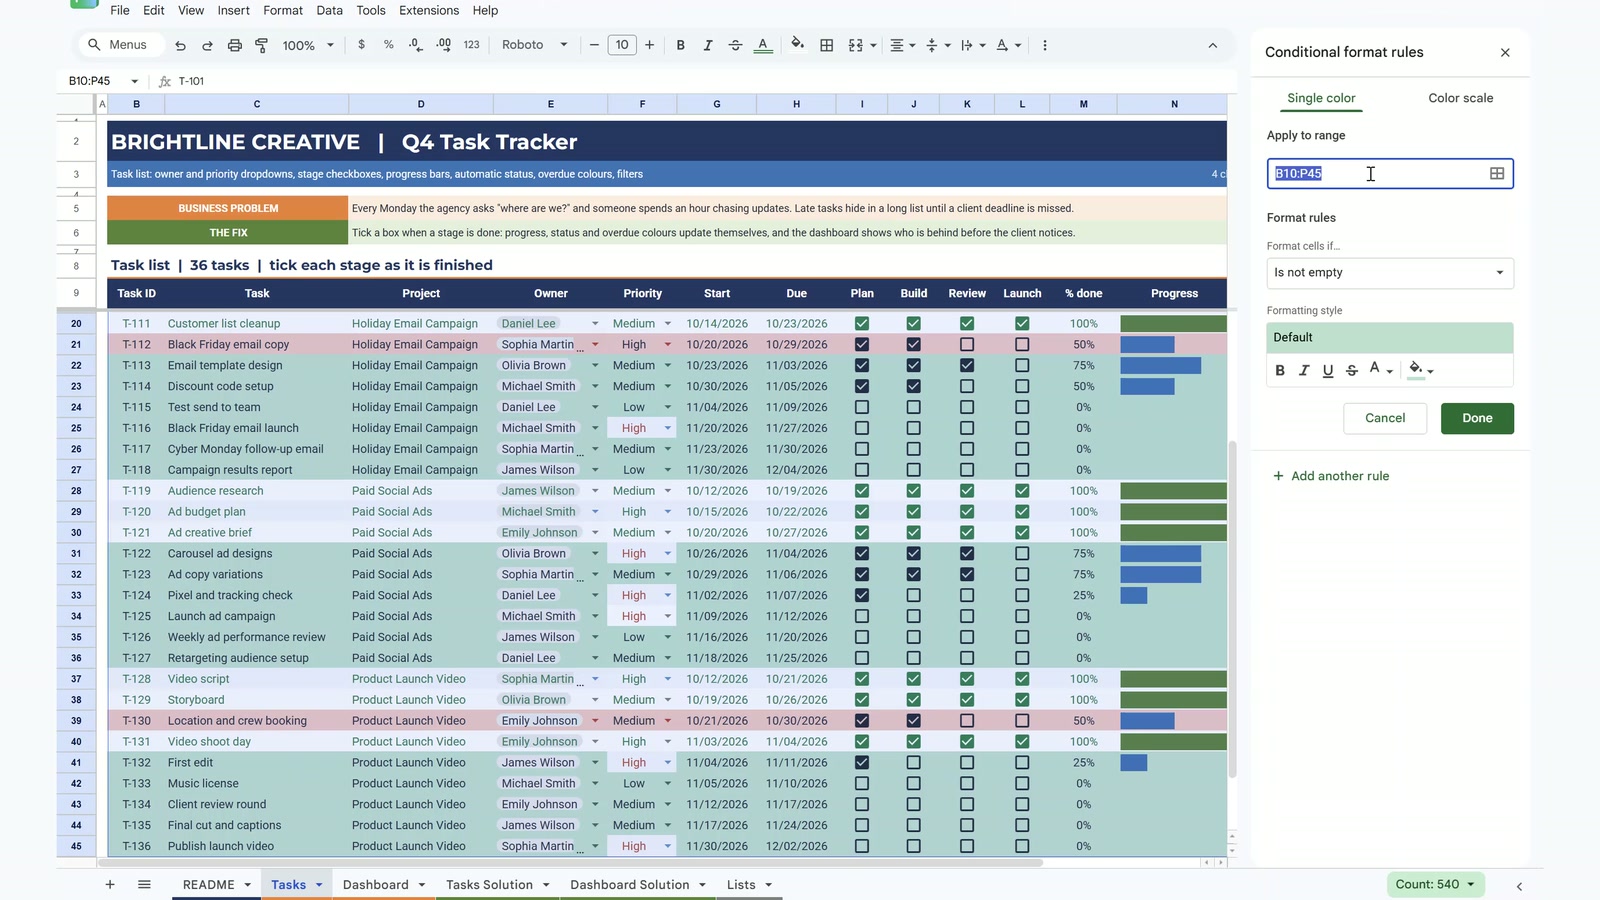
Step 8: A Filter for the Monday Meeting
Choose Data, then Create a filter. Show only Overdue to see what to chase first, or show a single owner to see one person’s list. Clear the filter when the meeting is over.
Step 9: Dashboard KPI Cards
On the Dashboard sheet each card is one formula. Total tasks uses COUNTA, each status uses COUNTIF with the status name, and % complete uses AVERAGE of the % done column.
=COUNTIF(Tasks!$O$10:$O$45,"Done")Step 10: Workload by Owner
List each owner once with a sorted unique list, then count tasks with COUNTIF, done and overdue tasks with COUNTIFS, the average progress with AVERAGEIF and a SPARKLINE bar that turns red when the owner has overdue work.
=SORT(UNIQUE(Tasks!$E$10:$E$45))Step 11: Tasks Due in the Next 7 Days
A single FILTER formula lists the tasks that are not done and fall due in the coming week, sorted by due date.
=IFERROR(SORT(FILTER({Tasks!C10:C45,Tasks!E10:E45,Tasks!H10:H45,Tasks!O10:O45,Tasks!P10:P45},Tasks!H10:H45>=TODAY(),Tasks!H10:H45<=TODAY()+7,Tasks!O10:O45<>"Done"),3,TRUE),"Nothing due in the next 7 days")Step 12: Status Doughnut Chart
Count each status in a small table, choose Insert, then Chart, pick a Pie chart and set the Donut hole to 50%. Tick one more stage on an overdue task and watch the Overdue card drop and the doughnut update.
Want the Finished Tracker?
The video builds the core tracker. If you would rather start from the finished file with every feature already set up, get the Task Management Tracker in Google Sheets from Next Gen Templates. Also work in Excel? The Excel Pivot Tables & Dashboards: Basic to Advanced course teaches dashboards step by step.
🛒 Get the Ready-to-Use Task Management Tracker
Google Sheets · all features included · Next Gen Templates
Frequently Asked Questions
How do I make a task management tracker in Google Sheets?
Start with a task list (task, project, owner, priority, start and due dates), add one tick box per stage, then let formulas work out % done, a progress bar, the status and the days left. Add conditional formatting for overdue rows and a dashboard sheet for the totals. The video builds all of this step by step.
How does the tracker know a task is overdue?
The Status formula compares the due date with TODAY(). If the task is not 100% done and the due date is before today, the status becomes Overdue and a conditional formatting rule turns the whole row red.
Why use tick boxes instead of typing a percentage?
Each task has four stages: Plan, Build, Review and Launch. Ticking a stage is faster and cannot be mistyped, and =COUNTIF(I10:L10,TRUE)/4 turns the ticks into 25%, 50%, 75% or 100% automatically.
What does the dollar sign do in =$O10="Overdue"?
It locks the column. Every cell in the row checks column O (Status) while the row number moves, so one rule colours the whole row, not just one cell.
Is there a free practice file for this video?
No. This is a build-along: you follow the steps on your own sheet. If you want the finished tracker with every feature already set up, the ready-to-use Task Management Tracker is available from Next Gen Templates.
Do I need Apps Script or add-ons?
No. The tracker uses only built-in features and formulas: data validation, checkboxes, COUNTIF, SPARKLINE, IF, TODAY, SORT, UNIQUE, FILTER, conditional formatting and a chart.
Is this the same tracker as the 2020 video?
It is the 2026 rebuild of the original task tracker video, with tick boxes, progress bars, automatic overdue status and a live dashboard. The 2020 original is still online for anyone who wants it.
More Google Sheets tutorials are on the NeoTech Navigators blog and the YouTube playlist.