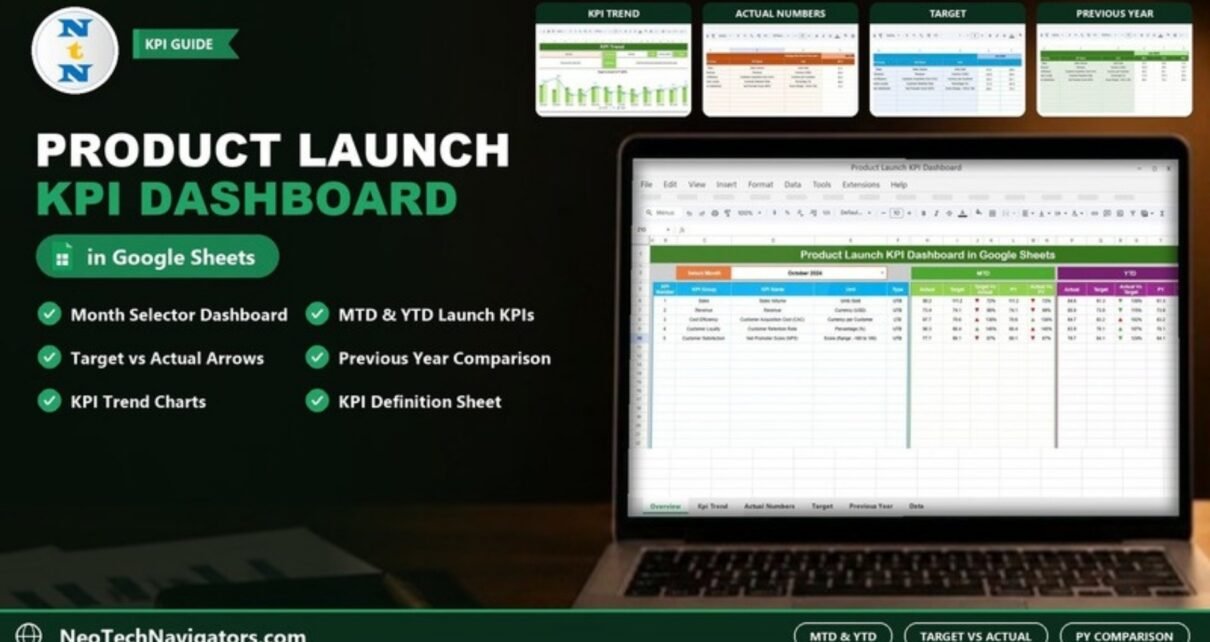
The Product Launch KPI Dashboard in Google Sheets gives product, marketing and sales teams one monthly scorecard for a new launch. Choose a month and each KPI shows its Month-to-Date (MTD) and Year-to-Date (YTD) actual next to its target and last year’s figure (PY), with arrows that flag what is ahead and what is falling behind.
This guide explains how the product launch KPI dashboard is structured across its six sheets, the five launch KPIs it ships with (Sales Volume, Revenue, Customer Acquisition Cost, Customer Retention Rate and Net Promoter Score) and how they are calculated, how to set it up with your own targets, and when you would need something more advanced. It is written for product managers, marketing leads, founders and launch teams in small and mid-sized businesses.
🎥 Watch the Video Tutorial
Get the Product Launch KPI Dashboard
Why a Launch Needs Its Own KPI Dashboard
A launch pulls in marketing, sales, operations, finance and product at the same time, and each team reports in its own format. Weekly status meetings end up comparing screenshots from ad platforms, CRM exports and finance spreadsheets, and nobody can say in one sentence whether the launch is on track.
A KPI dashboard fixes that by agreeing a short list of metrics up front, setting a target for each month, and showing actual against target in one place. Adding last year’s numbers (or the previous comparable launch) shows whether this launch is performing better than the last one, not just whether it hit an arbitrary goal.
The Five Launch KPIs in the Template
Each KPI is defined in the KPI Definition sheet with its group, unit, formula and definition, and the Dashboard shows its type (UTB = upper the better, LTB = lower the better). These are the five KPIs the template ships with:
| KPI Group | KPI Name | Unit | Formula | What it measures | Type |
|---|---|---|---|---|---|
| Sales | Sales Volume | Units Sold | Sum of units sold | The total quantity of the product sold | UTB (higher is better) |
| Revenue | Revenue | Currency (USD) | Price per unit × Units sold | The total revenue generated from product sales | UTB (higher is better) |
| Cost Efficiency | Customer Acquisition Cost (CAC) | Currency per Customer | Total marketing and sales expenses ÷ Number of new customers acquired | The cost incurred to acquire one customer | LTB (lower is better) |
| Customer Loyalty | Customer Retention Rate | Percentage (%) | (Customers at end of period − New customers during the period) ÷ Customers at the start of the period | The percentage of customers retained over a period | UTB (higher is better) |
| Customer Satisfaction | Net Promoter Score (NPS) | Score (Range: -100 to 100) | % Promoters − % Detractors | How likely customers are to recommend the product | UTB (higher is better) |
Worked Example: Reading the Dashboard
In the sample data with October 2024 selected, Revenue has an MTD Actual of 73.4 against an MTD Target of 74.1, and a YTD Actual of 85.0 against a YTD Target of 74.1. The comparison columns are ratios of actual to the benchmark:
MTD Target Vs Actual = 73.4 / 74.1 = 0.99  →  99%
YTD Actual Vs Target = 85.0 / 74.1 = 1.15  →  115%
So October came in just short of plan while the year to date is comfortably ahead. For an LTB KPI the reading flips: Customer Acquisition Cost shows an MTD Actual of 97.7 against a target of 70.6, which is 138% of target, and for CAC being above 100% is the bad direction. To calculate the actual itself, use the formula from the KPI Definition sheet; for example, $20,000 of launch marketing and sales spend that wins 250 new customers gives a CAC of 20,000 ÷ 250 = $80.
Inside the Product Launch KPI Dashboard: Six Sheets
1. Dashboard
The main view. Select the month in the Select Month drop-down in cell D3 and every KPI row updates. Each row shows KPI Number, KPI Group, KPI Name, Unit and Type, then an MTD block (Actual, Target, Target Vs Actual, PY, Actual Vs PY) and a YTD block (Actual, Target, Actual Vs Target, PY, Actual Vs PY). Conditional formatting adds up and down arrows beside each comparison so the status of each KPI is clear without reading every number.

2. KPI Trend
Pick a KPI from the drop-down in cell C3 to see its KPI Group, Unit, Type (LTB or UTB), Formula and Definition, along with a Target Vs Actual Vs PY (MTD) chart that shows Actual and PY as columns and Target as a line for each month from Jan-2024 to Dec-2024.

3. Actual Number
Enter MTD and YTD actuals for each KPI and month, with one MTD and one YTD column per month. Cell E1 (marked “Change the first of the year”) sets the first month so the months line up with your financial or launch calendar.

4. Target
Enter monthly MTD and YTD targets for each KPI in the same month-by-month layout. The dashboard uses them to calculate the gap between plan and reality.

5. Previous Year Number
Enter last year’s figures (2023 in the sample), or the numbers from a comparable earlier launch, to compare current performance and growth.

6. KPI Definition
The master list, with columns #, KPI Group, KPI Name, Unit, Formula and Definition. Clear definitions here mean marketing, sales and finance read each number the same way.

Other Launch KPIs Worth Tracking
The template does not include the KPIs below, but they are common in launch reviews and you can add them as extra rows in the KPI Definition sheet:
- Conversion Rate – orders ÷ product page visitors × 100 (higher is better).
- Marketing ROI – (revenue − marketing cost) ÷ marketing cost × 100 (higher is better).
- Return / Refund Rate – units returned ÷ units sold × 100 (lower is better).
- Order Fulfilment Time – average days from order to delivery (lower is better).
How to Use It With Your Own Data
- Make your own copy in Google Drive after purchase with File > Make a copy.
- Review the five KPIs in the KPI Definition sheet with the launch team, adjust formulas or definitions, and add any extra KPIs your launch needs with their unit and type.
- Set the first month of your year in cell E1 of the Actual Number sheet.
- Enter targets for each month of the launch period in the Target sheet.
- Add a baseline in the Previous Year Number sheet: last year’s figures or a previous launch.
- Update actuals at each month end from your sales, analytics, CRM and survey tools, then select the month in D3 and review.
Real-World Use Cases
- D2C consumer brand: tracks Sales Volume, Revenue and NPS for a new product line and uses the arrows in the monthly review with its agency.
- B2B software company: follows Customer Acquisition Cost and Customer Retention Rate for a new product, comparing them with last year’s major release.
- Manufacturer entering a new market: monitors units sold and revenue against target in the first six months after launch.
Best Practices
- Set targets before launch day. Targets written after the results arrive are not targets.
- Keep the list short. A handful of meaningful KPIs beats forty that nobody reads.
- Mark the KPI type carefully. CAC is LTB while the other four are UTB; a wrong setting makes a good result look bad.
- Validate numbers before entry. One mistyped figure distorts the YTD view for the rest of the year.
- Review weekly during the first month of a launch, then move to monthly once results settle.
Limitations and Who Should Not Use It
This is a monthly KPI scorecard built on numbers you enter. It does not connect to ad platforms, web analytics or your CRM, and it does not show daily campaign performance. If you need real-time marketing attribution or daily dashboards, use your analytics or BI tool for that and keep this sheet as the management summary. Teams launching many products at once may also prefer one copy per product so the KPI lists stay focused.
Related Templates and Guides
To plan the launch itself, use the Product Launch Checklist and the Product Launch Calendar. For a chart-based view of launch data, see the Product Launch Dashboard in Google Sheets, and for the wider funnel, the Marketing KPI Dashboard and Product Development KPI Dashboard.
Related template on NextGenTemplates: Product Launch Dashboard in Google Sheets.
If you want to learn how KPI dashboards like this are built, the Excel Pivot Tables & Dashboards course on NextGenTemplates Academy walks through the structure, formulas and charts with structured lessons.
Frequently Asked Questions
Which KPIs does the template track?
Five: Sales Volume, Revenue, Customer Acquisition Cost (CAC), Customer Retention Rate and Net Promoter Score (NPS). You can add others, such as conversion rate or marketing ROI, in the KPI Definition sheet.
What does MTD and YTD mean in this dashboard?
MTD (Month-to-Date) is the result for the selected month. YTD (Year-to-Date) is the cumulative result from the first month of your year up to the selected month.
Can I add or remove KPIs?
Yes. Edit the KPI Definition sheet to add, rename or remove KPIs, then enter matching targets, actuals and previous-year values.
What if this is our first launch and we have no previous-year data?
Leave the Previous Year Number sheet blank at first, or use a comparable benchmark such as a pilot or a similar product. The Target vs Actual comparison still works on its own.
Is it suitable for small businesses?
Yes. It runs in Google Sheets, needs no BI software, and a small team can maintain it in under an hour a month.
Do I need advanced spreadsheet skills?
No. You enter numbers in the input sheets and choose a month; the formulas, arrows and charts are already built.
Wrapping Up
The Product Launch KPI Dashboard in Google Sheets turns a launch from a collection of status updates into a short, agreed set of numbers with clear targets. Review the five KPIs before launch day, enter actuals every month, and use the arrows and trend chart to decide where to push and where to fix.
Get the Product Launch KPI Dashboard
📅 Last updated: October 2026