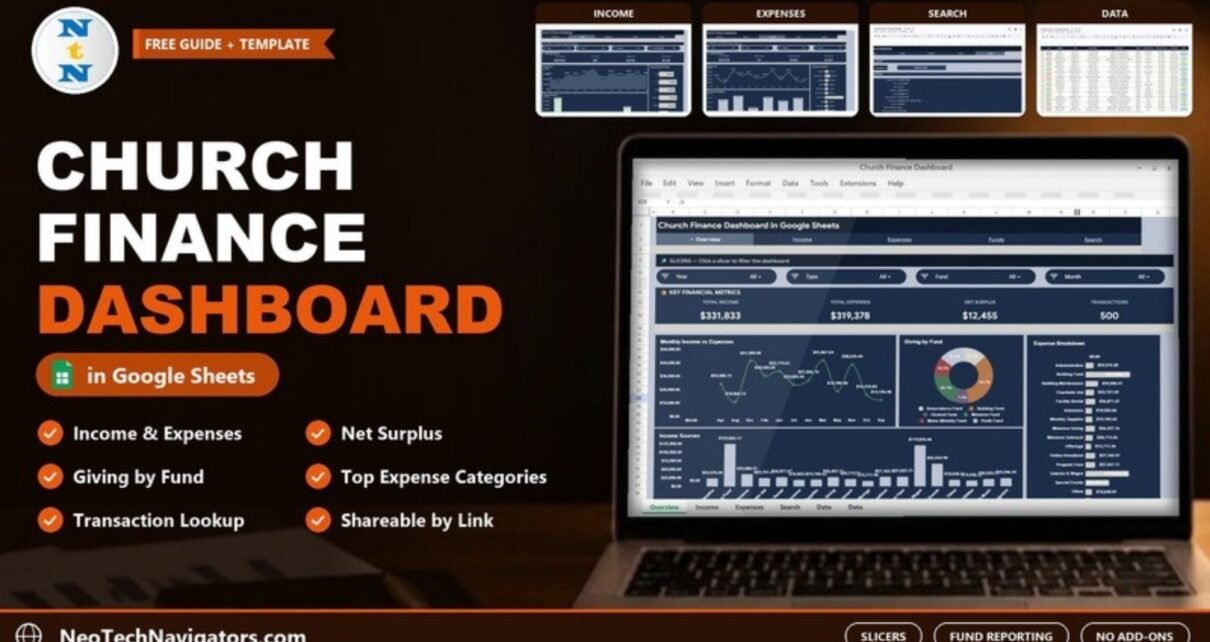
The Church Finance Dashboard in Google Sheets helps church treasurers, finance committees and pastors see the congregation’s money clearly: how much came in, how much went out, which funds received the giving, and where the spending went. It is designed for small and mid-size churches and ministries that keep their records in a spreadsheet and want a visual monthly report without paying for church management software.
The file has Overview, Income, Expenses and Search tabs linked by a navigation bar, plus a Data sheet that holds every transaction. Slicers at the top of the analysis tabs filter the figures by year, month, fund, type, category, payment method or status. It is built entirely with Google Sheets formulas, charts and slicers, so it can be shared with the committee by link.
Below we go through each tab with the sample numbers, explain how the key figures are calculated, and show how to replace the sample with your own church records.
🎥 Watch the Video Tutorial
Get the Church Finance Dashboard
What the Church Finance Dashboard in Google Sheets Solves
Church finances are usually kept by volunteers, recorded transaction by transaction, and reported once a month to a committee that wants a simple answer: are we taking in more than we spend, and is each fund being used for its purpose? Turning a ledger into that answer often means rebuilding the same summary tables every month.
This dashboard does the summarising for you. Once the transactions are in the Data sheet, the income, expense and fund views are ready for the next meeting, and the Search tab lets anyone look up a single transaction when a question comes up.
The Dashboard Tabs Explained
1. Overview
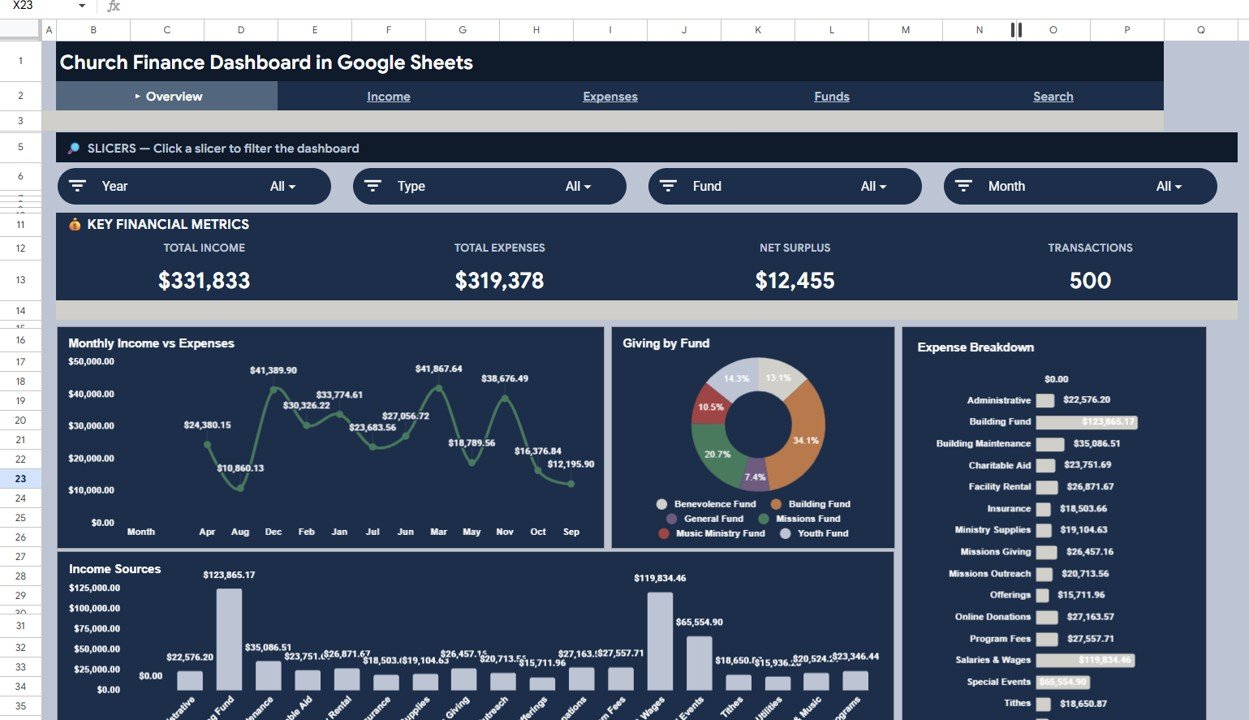
The Overview starts with four slicers – Year, Type, Fund and Month – and a Key Financial Metrics band. In the 500-transaction sample it shows Total Income $331,833, Total Expenses $319,378, Net Surplus $12,455 and Transactions 500.
The charts below are:
- Monthly Income vs Expenses – a month-by-month line chart. In the sample screenshot one line is visible, and its values match the Expense Trend on the Expenses tab.
- Giving by Fund – a donut across the six funds in the sample: Benevolence Fund, Building Fund, General Fund, Missions Fund, Music Ministry Fund and Youth Fund.
- Expense Breakdown – a bar chart of amounts by category, from Administrative and Building Maintenance to Salaries & Wages and Youth Programs.
- Income Sources – a column chart of amounts by category, where Building Fund ($123,865.17) is the tallest bar.
In the sample screenshot, both category charts on the Overview list every category in the data – income categories such as Offerings and Tithes appear alongside expense categories such as Salaries & Wages. For a spending-only view, use Top Expense Categories on the Expenses tab, which lists only the ten expense categories. Also note that the months on the trend charts are shown alphabetically (Apr, Aug, Dec and so on) rather than in calendar order, so read them as a month-by-month comparison rather than a timeline.
2. Income
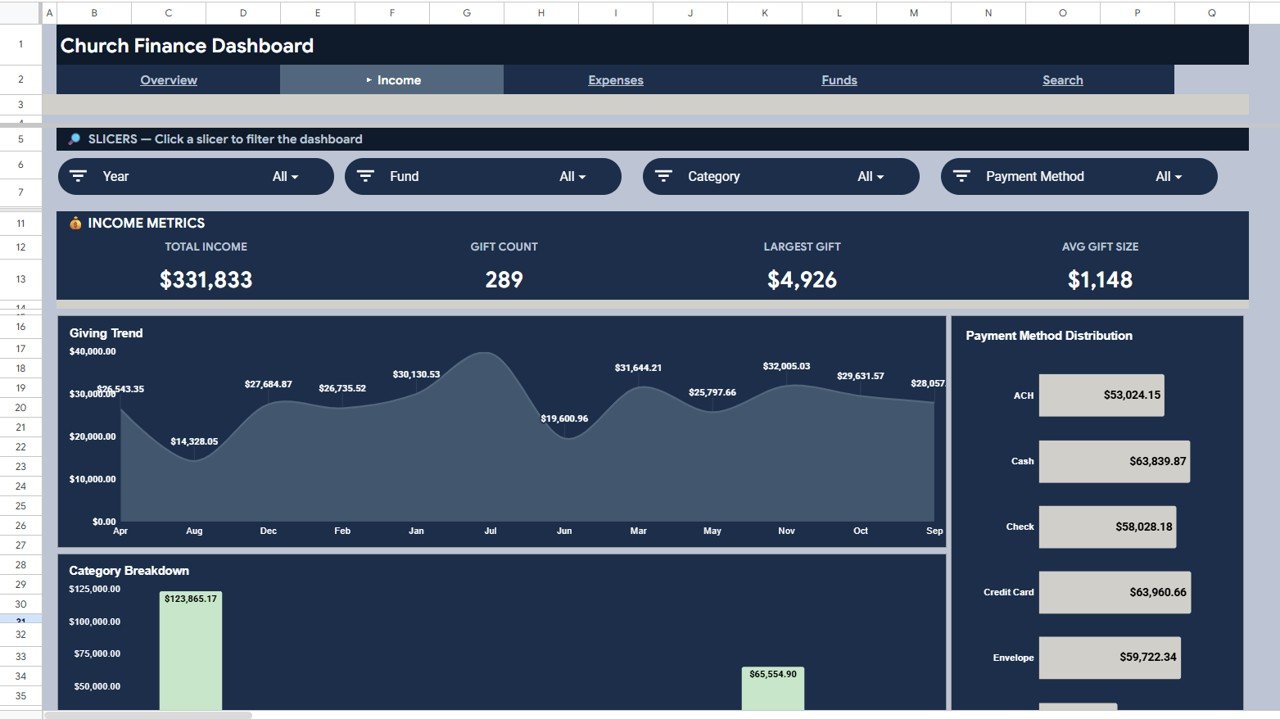
The Income tab has its own slicers – Year, Fund, Category and Payment Method – and an Income Metrics band: Total Income $331,833, Gift Count 289, Largest Gift $4,926 and Avg Gift Size $1,148.
Giving Trend plots income month by month. Payment Method Distribution shows how people give – ACH, Cash, Check, Credit Card and Envelope are visible in the sample, and the data also uses Online Transfer – and Category Breakdown shows which income categories bring in the most.
3. Expenses
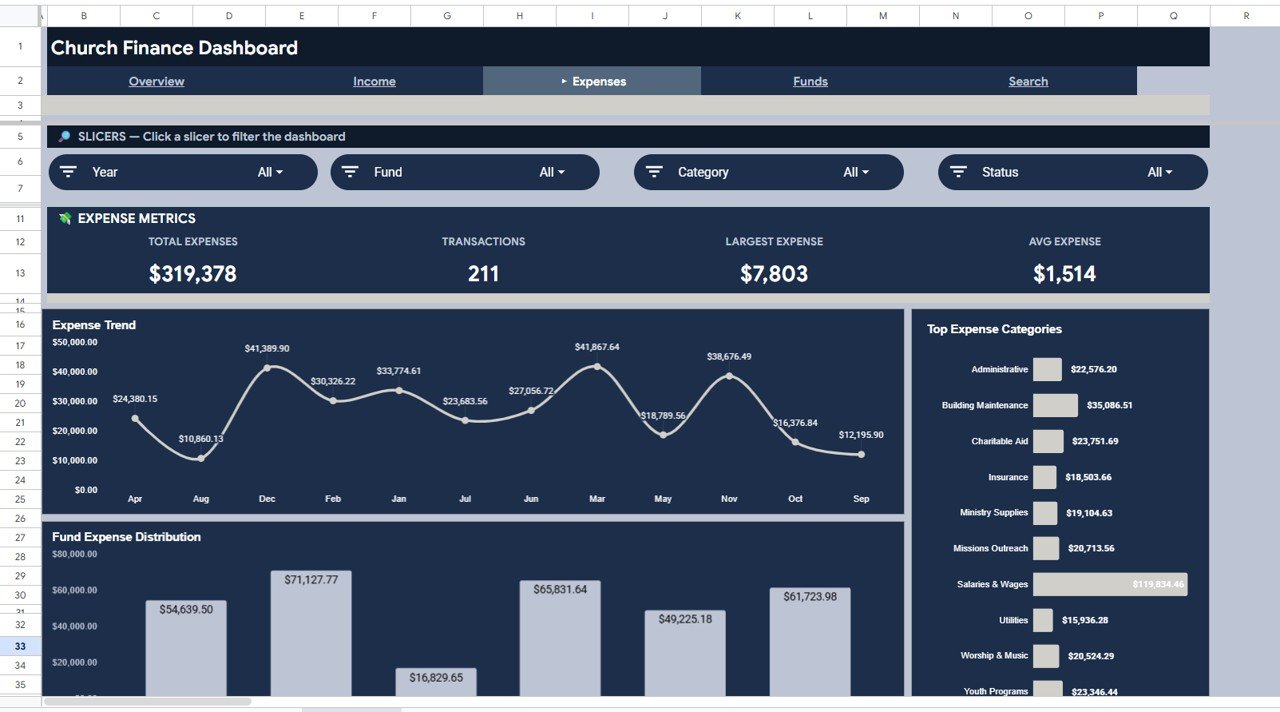
The Expenses tab uses Year, Fund, Category and Status slicers. Its Expense Metrics band shows Total Expenses $319,378, Transactions 211, Largest Expense $7,803 and Avg Expense $1,514.
Expense Trend follows spending month by month, Fund Expense Distribution shows how much each fund has paid out, and Top Expense Categories ranks spending – Salaries & Wages is by far the largest at $119,834.46, followed by Building Maintenance at $35,086.51. That fund view is useful for confirming that restricted money is spent where donors intended.
4. Reporting by Fund
The navigation bar also shows a Funds link, but the product listing does not describe a separate Funds page. Fund reporting is covered by the Giving by Fund donut on the Overview, the Fund Expense Distribution chart on the Expenses tab and the Fund slicer on the Overview, Income and Expenses tabs. Together they let you report on each fund separately, which matters when a building fund or missions fund has to be accounted for on its own.
5. Search
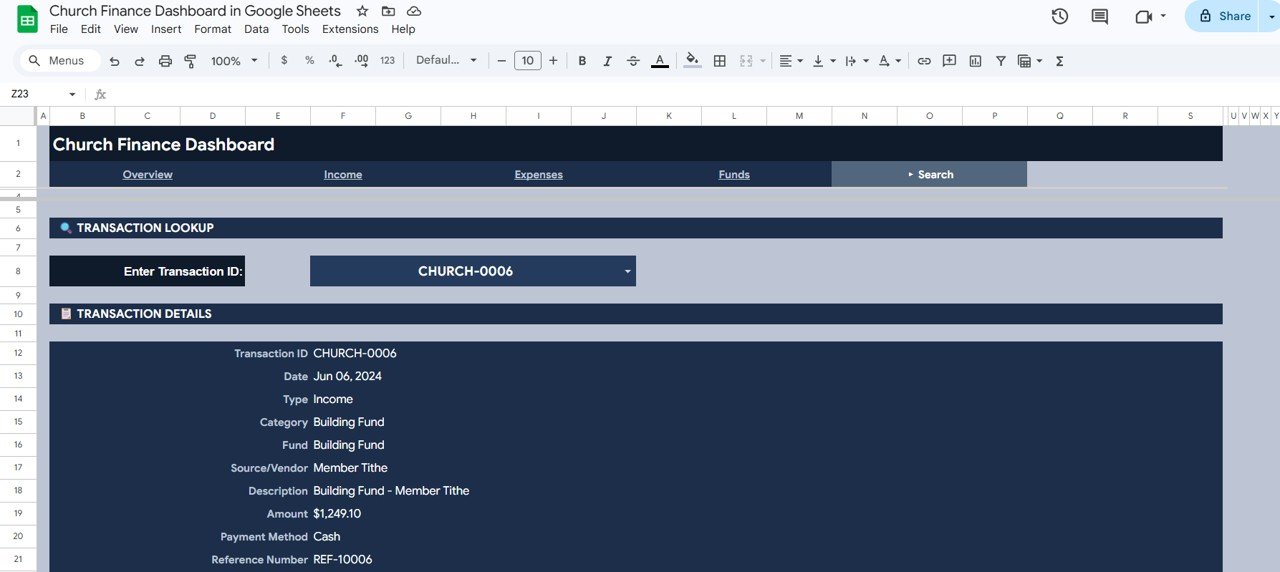
The Search tab is a Transaction Lookup. Choose a Transaction ID from the Enter Transaction ID drop-down and the Transaction Details panel shows Transaction ID, Date, Type, Category, Fund, Source/Vendor, Description, Amount, Payment Method and Reference Number. In the screenshot, CHURCH-0006 is a $1,249.10 cash member tithe to the Building Fund on Jun 06, 2024.
6. Data
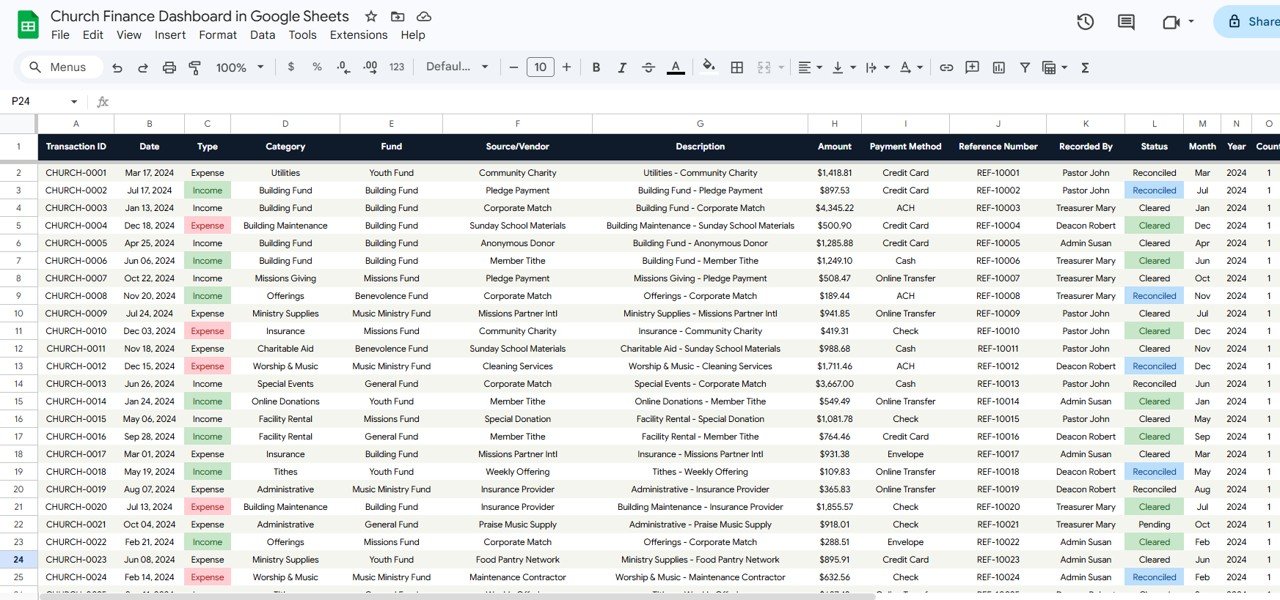
The Data sheet holds one row per transaction with these columns: Transaction ID, Date, Type (Income or Expense), Category, Fund, Source/Vendor, Description, Amount, Payment Method, Reference Number, Recorded By, Status (Cleared, Reconciled or Pending in the sample), Month, Year and Count. It comes with 500 sample rows that you replace with your own.
Key Church Finance Metrics
The table shows how the main figures relate to each other in the sample. Every calculation reproduces the numbers on the screenshots.
| Metric | What it measures | Calculation (sample) | Better when |
|---|---|---|---|
| Total Income | All money received | Sum of Amount where Type = Income → $331,833 | Higher |
| Total Expenses | All money paid out | Sum of Amount where Type = Expense → $319,378 | Within budget |
| Net Surplus | Income left after expenses | $331,833 − $319,378 = $12,455 | Higher (positive) |
| Transactions | Number of records | 289 income + 211 expense = 500 | — |
| Avg Gift Size | Typical size of a gift | $331,833 ÷ 289 gifts = $1,148 | Higher |
| Largest Gift | Single largest income record | $4,926 | — |
| Avg Expense | Typical size of a payment | $319,378 ÷ 211 = $1,514 | Lower, if spending is under pressure |
| Largest Expense | Single largest payment | $7,803 | — |
You can reproduce the headline numbers with two simple formulas, which is a good way to check your data after pasting it in (column C is Type and column H is Amount on the Data sheet):
Total Income   = SUMIFS(Data!H:H, Data!C:C, "Income")
Total Expenses = SUMIFS(Data!H:H, Data!C:C, "Expense")
How to Use It With Your Church’s Records
- Make your own copy of the Google Sheet from the link included with the download.
- Decide your category and fund names before you start, and use them consistently – they drive every chart and slicer.
- Export or copy your transactions into the Data sheet column order: Transaction ID, Date, Type, Category, Fund, Source/Vendor, Description, Amount, Payment Method, Reference Number, Recorded By and Status.
- Use exactly “Income” or “Expense” in the Type column.
- Make sure the Month, Year and Count columns are filled for every row (copy them down if they hold formulas) so the monthly charts and slicers work.
- Delete the sample rows once your own data is in place, then check Total Income and Total Expenses against your ledger.
- Share the file with “Viewer” access for the committee and “Editor” access only for the treasurer.
New to spreadsheets? The learning paths on NextGenTemplates Academy are a gentle way for volunteer treasurers to build the basics before customising a dashboard.
Real-World Use Cases
- Monthly finance committee meeting – set the Month slicer to the month just closed and walk through income, expenses and net surplus on the Overview.
- Restricted fund reporting – filter by Fund to show how much the Building Fund or Missions Fund received and spent this year.
- Answering a question about a payment – open the Search tab, enter the Transaction ID, and the source, description, reference number and amount are on screen.
Best Practices
- Record transactions weekly so the month-end update is quick.
- Use the Status column (Pending, Cleared, Reconciled) to show which entries have been checked against the bank statement.
- Fill in Recorded By on every row – it makes questions easier to answer and supports good internal controls.
- Keep one master copy and avoid several people maintaining separate versions.
- Keep an untouched copy of the template before changing any formulas or charts.
Limitations
This dashboard is for reporting, not bookkeeping. It does not connect to your bank, generate donor giving statements or tax receipts, manage members or run payroll. Churches that need those features will still need an accounting package or a church management system; this file can sit alongside them as the visual report for the committee.
Related Templates and Guides
The same report is available as the Church Finance Dashboard in Excel for treasurers who work offline. On this blog, see the Church Finance Dashboard in HTML, the Church Transaction Analysis Dashboard, the Religious & Faith-Based Organizations Dashboard and the Donation Management Tracker in Google Sheets.
Frequently Asked Questions
What does the Church Finance Dashboard in Google Sheets track?
It tracks Total Income, Total Expenses, Net Surplus and the number of transactions, plus gift count, largest gift, average gift size, largest expense and average expense on the Income and Expenses tabs.
Can I track giving by fund, such as a building or missions fund?
Yes. Each transaction has a Fund, the Overview has a Giving by Fund chart, the Expenses tab shows Fund Expense Distribution, and the Fund slicer filters the figures by fund.
How do I look up one transaction?
Open the Search tab and choose the Transaction ID from the drop-down. The panel shows the date, type, category, fund, source or vendor, description, amount, payment method and reference number.
Can the whole finance committee use it at once?
Yes. It is a Google Sheet, so you can share it by link with view or edit permissions and everyone sees the same live figures.
Does it produce donor tax receipts?
No. It is a reporting dashboard. Giving statements and receipts need a donor management or accounting tool.
Can other nonprofits use it?
Yes. Any organisation that records income and expenses by fund – ministries, charities or community groups – can rename the categories and funds to suit.
Wrapping Up
The Church Finance Dashboard in Google Sheets gives treasurers a ready-made monthly report: income, expenses and net surplus at the top, giving and spending by fund and category underneath, and a lookup for any single transaction. Start by agreeing your fund and category names, paste in the last three months of transactions, and check the totals against your ledger before your next committee meeting.
Get the Church Finance Dashboard
📅 Last updated: October 2026