The Environmental Services Dashboard in Google Sheets is a ready-to-use reporting template for waste management, recycling, remediation, municipal environmental programs, and sustainability service teams. The U.S. EPA reports that 292.4 million tons of municipal solid waste were generated in 2018, and only 32.1 percent was recycled or composted. That is why tracking revenue, service volume, recovery rate, compliance, CO2 saved, region, and client satisfaction in one shared dashboard can make daily environmental operations easier to review.
This Google Sheets dashboard includes seven sheet tabs: Overview, Performance, Regional, Sustainability, Clients, Search Sheet, and Data Sheet. It is built for teams that want quick reporting without a monthly SaaS subscription or a heavy implementation project.
Environmental Services Dashboard in Google Sheets product page
Key Features of Environmental Services Dashboard in Google Sheets
- Seven dashboard tabs: Overview, Performance, Regional, Sustainability, Clients, Search Sheet, and Data Sheet.
- Four KPI cards: Total Revenue, Services Done, Avg Recovery Rate, and CO2 Saved (t).
- Multiple slicers: Filter the dashboard quickly by the fields used in your service records.
- Operational analysis: Review volume processed, revenue, cost, monthly volume, and service priority.Environmental Services Dashboard in Google Sheets
- Regional analysis: Compare revenue and volume across service regions and service types.Environmental Services Dashboard in Google Sheets
- Sustainability analysis: Track CO2 saved, compliance status, recovery rate, and regional impact.
- Client analysis: Review revenue, satisfaction, client type, service type, and priority.
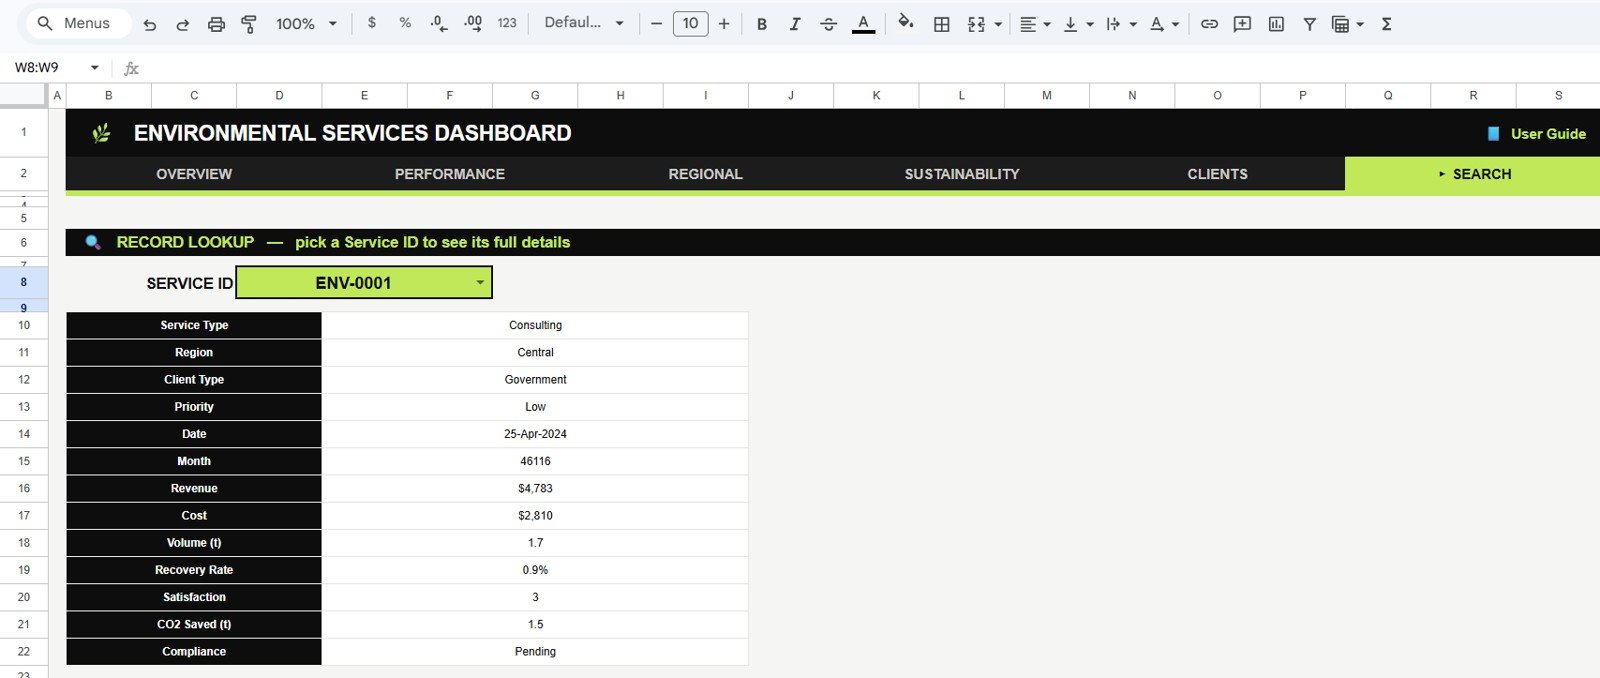
- Search Sheet: Select a Service ID and view the full environmental service record.
- Editable Data Sheet: Replace sample data with your own records in the same format.
Dashboard Pages Explanation
Overview Page
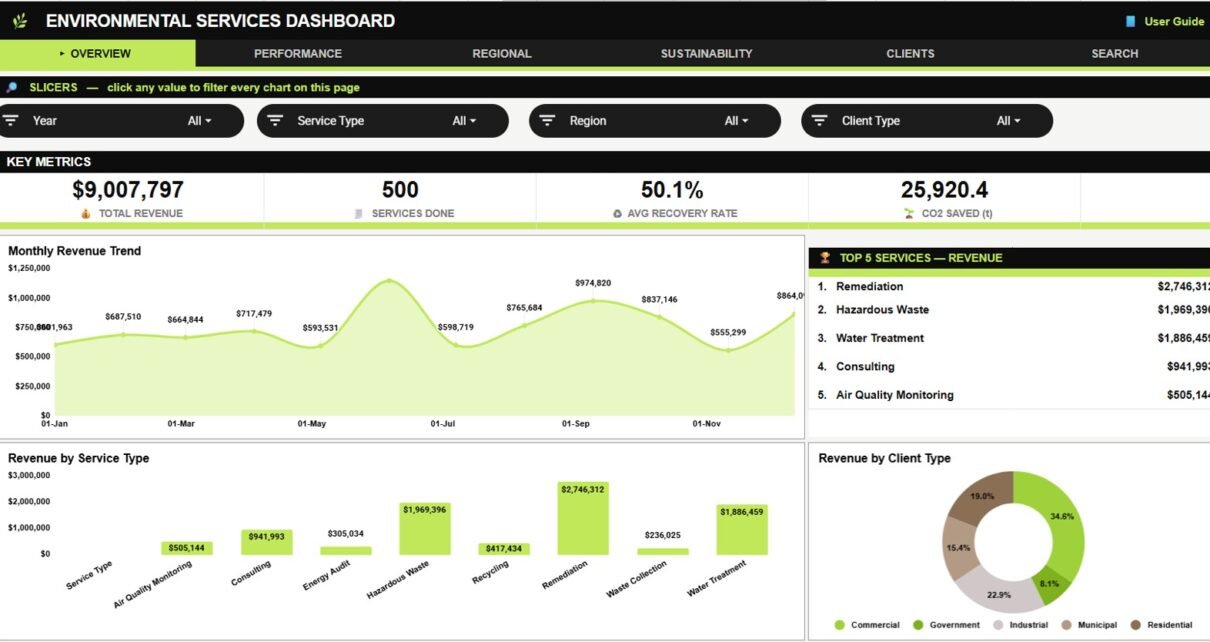
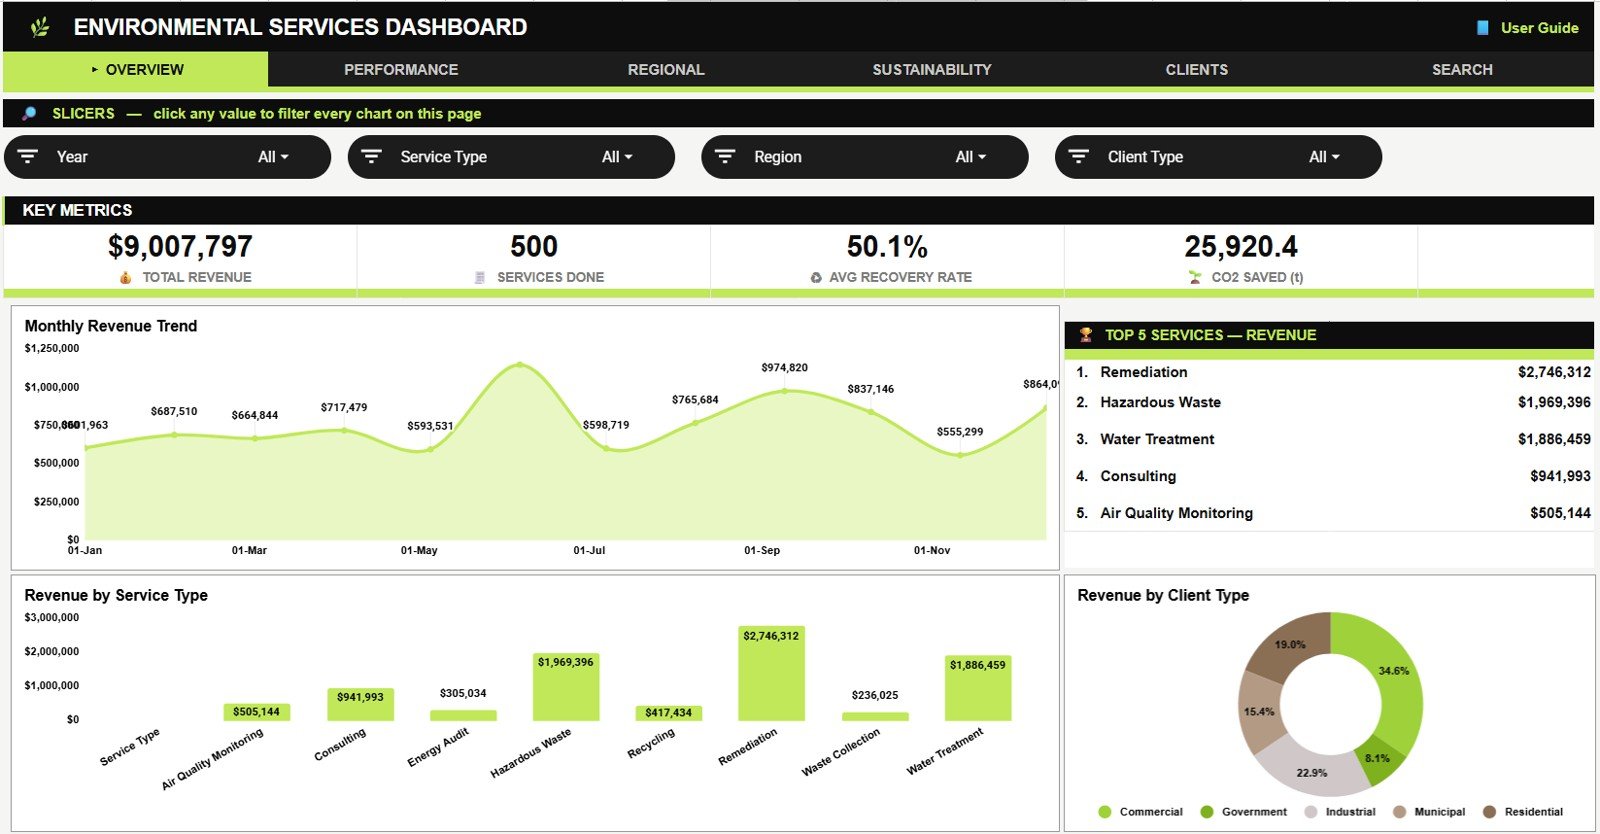
The Overview page shows the main headline cards: Total Revenue, Services Done, Avg Recovery Rate, and CO2 Saved (t). These cards give managers a quick read on financial output, completed workload, recovery performance, and environmental impact.
Monthly Revenue by Month: This chart shows how revenue changes across the reporting period. It helps managers spot seasonal peaks, slower months, and periods that need sales or operational follow-up.Environmental Services Dashboard in Google Sheets
Revenue by Top Services: This chart ranks the services generating the most revenue. It helps teams see which environmental services contribute most to the business and which services may need pricing review.Environmental Services Dashboard in Google Sheets
Revenue by Service Type: This chart groups revenue by service category. It helps compare performance across recycling, waste handling, recovery, remediation, or other service types used in the data.
Revenue by Client Type: This chart separates revenue by client segment. It helps teams understand whether municipal, commercial, industrial, or other client groups are driving revenue.
Environmental Services Dashboard in Google Sheets product page
Performance
Volume Processed by Service: This chart compares the amount of material or service volume handled by each service. It helps identify the services carrying the largest operational workload.Environmental Services Dashboard in Google Sheets
Revenue and Cost by Service: This chart compares income and expense side by side for each service. It helps managers see which services are profitable and which may need cost control.
Monthly Volume by Month: This chart shows how processed volume changes month by month. It helps plan staffing, equipment, vendor capacity, and service schedules.
Services by Priority: This chart groups service records by priority level. It helps teams understand how much work is urgent, normal, or lower priority.
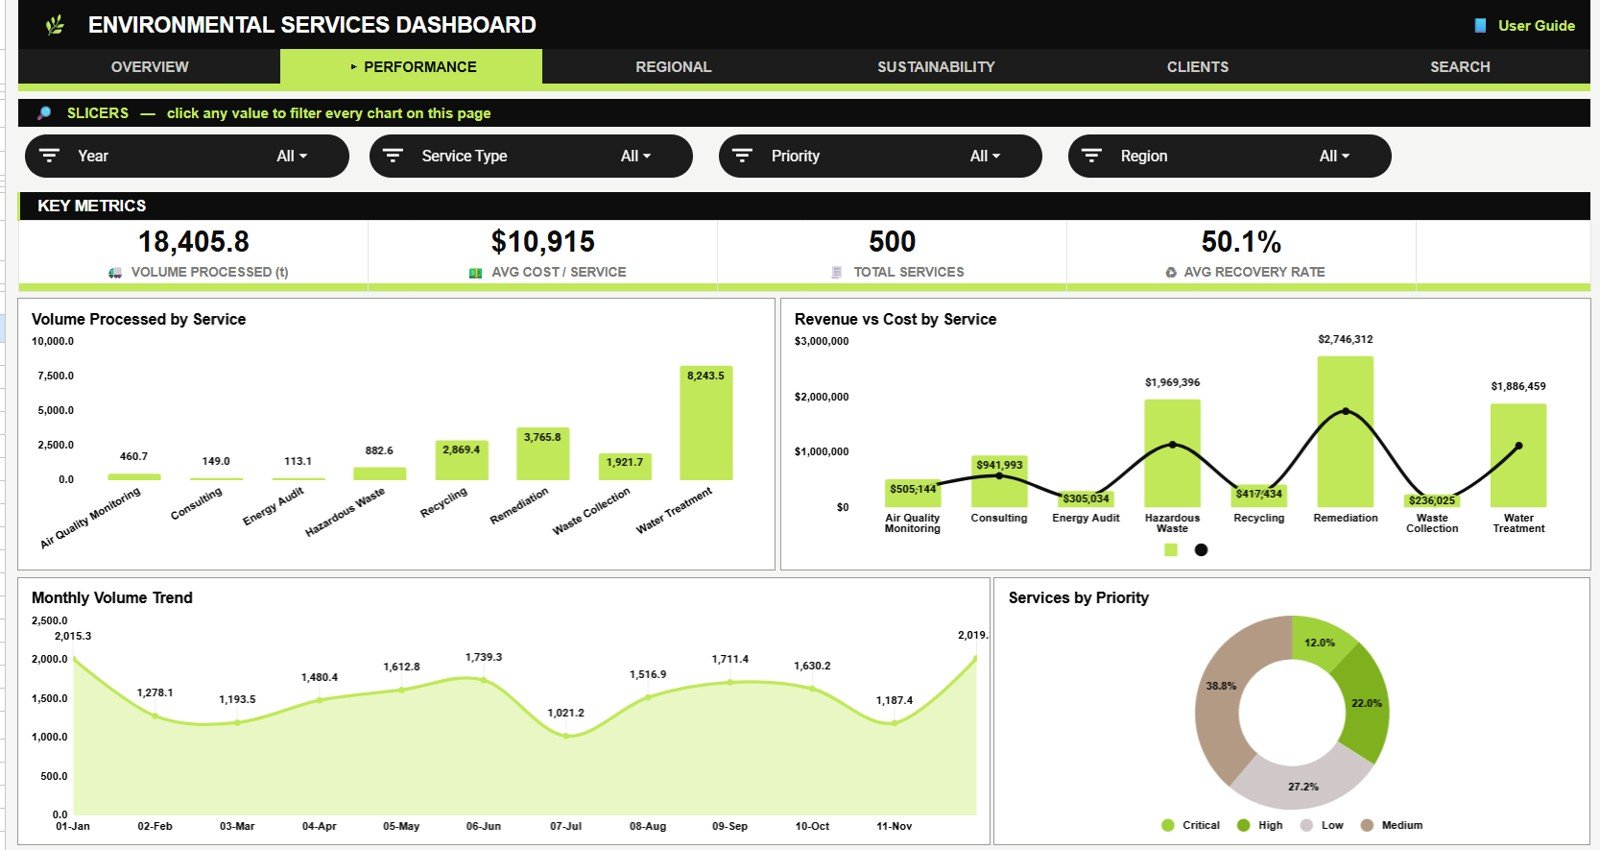
Environmental Services Dashboard in Google Sheets product page
Regional
Revenue by Region: This chart compares total revenue across regions. It helps identify where service demand and revenue performance are strongest.Environmental Services Dashboard in Google Sheets
Monthly Revenue by Region: This chart shows regional revenue movement over time. It helps compare growth, seasonality, and regional changes month by month.Environmental Services Dashboard in Google Sheets
Volume Processed by Region: This chart compares operational volume by location. It helps teams see which regions handle the most material or service activity.
Revenue by Region and Service Type: This chart combines location and service category. It helps managers understand which service types perform best in each region.
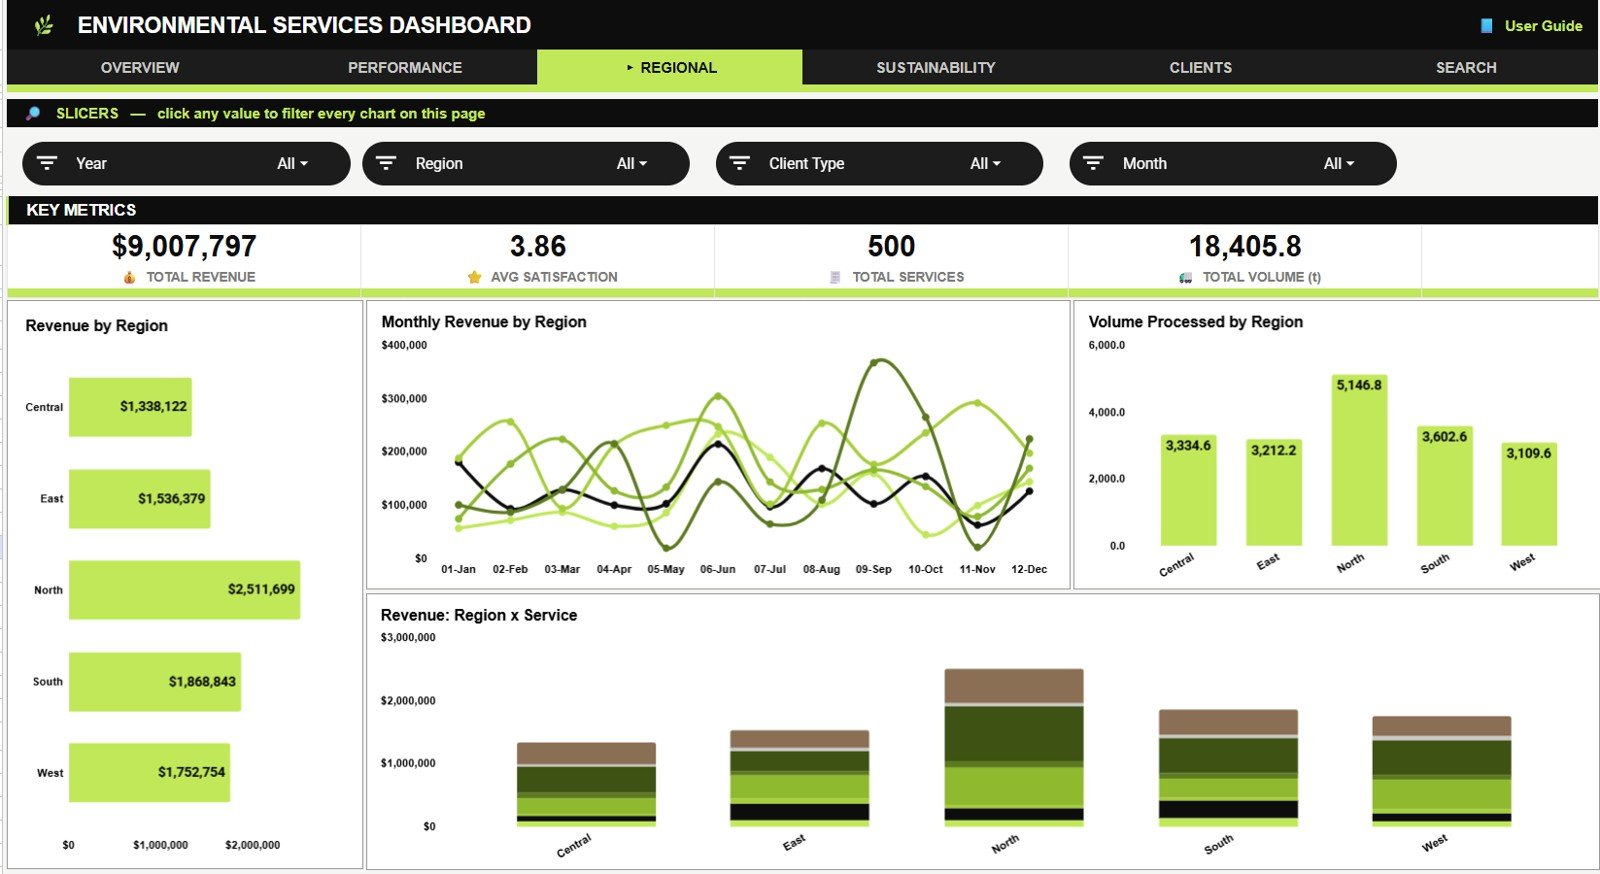
Environmental Services Dashboard in Google Sheets product page
Sustainability
CO2 Saved by Month: This chart tracks the environmental impact achieved over time. It helps sustainability teams explain how services contribute to emissions reduction or avoided impact.
Services by Compliance Status: This chart shows how services are distributed by compliance result. It helps teams monitor compliant, pending, and non-compliant service records.Environmental Services Dashboard in Google Sheets
CO2 Saved by Region: This chart compares CO2 savings across regions. It helps identify where environmental impact is strongest and where process improvements may be needed.
Average Recovery Rate by Service Type: This chart compares recovery performance by service category. It helps teams identify which service types recover the highest percentage of materials or value.
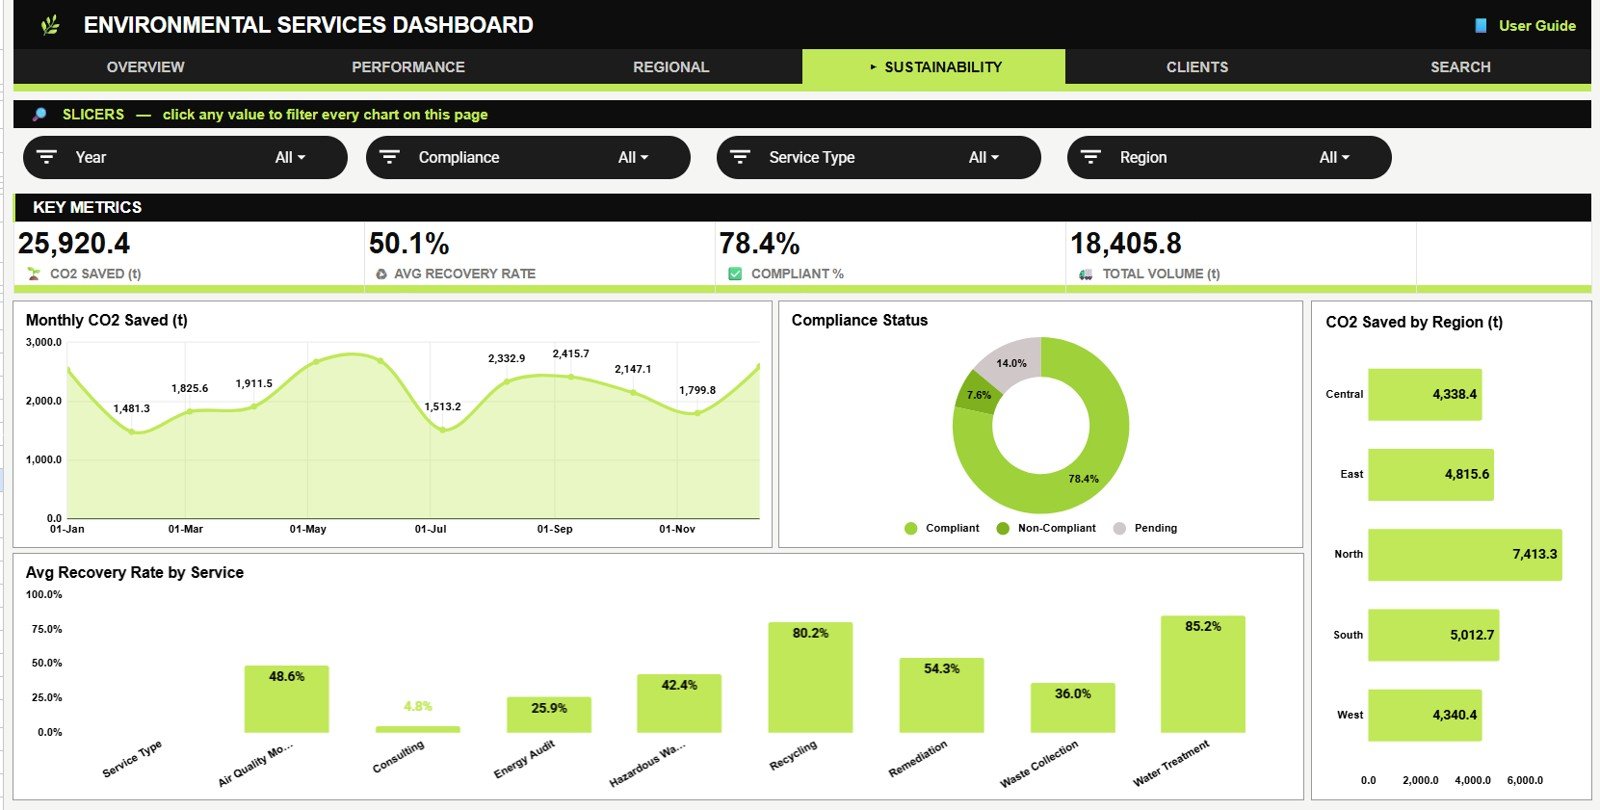
Environmental Services Dashboard in Google Sheets product page
Clients
Revenue by Client Type: This chart shows how much revenue each client segment contributes. It helps teams compare municipal, commercial, industrial, or other client groups.
Monthly Satisfaction by Month: This chart tracks satisfaction across the reporting period. It helps managers see whether service quality is improving or declining over time.
Average Satisfaction by Service Type: This chart compares satisfaction across service categories. It helps identify which services create better client experiences and which need attention.
Services by Client Type and Priority: This chart combines customer segment and priority level. It helps teams see which client groups create the most urgent or high-priority work.
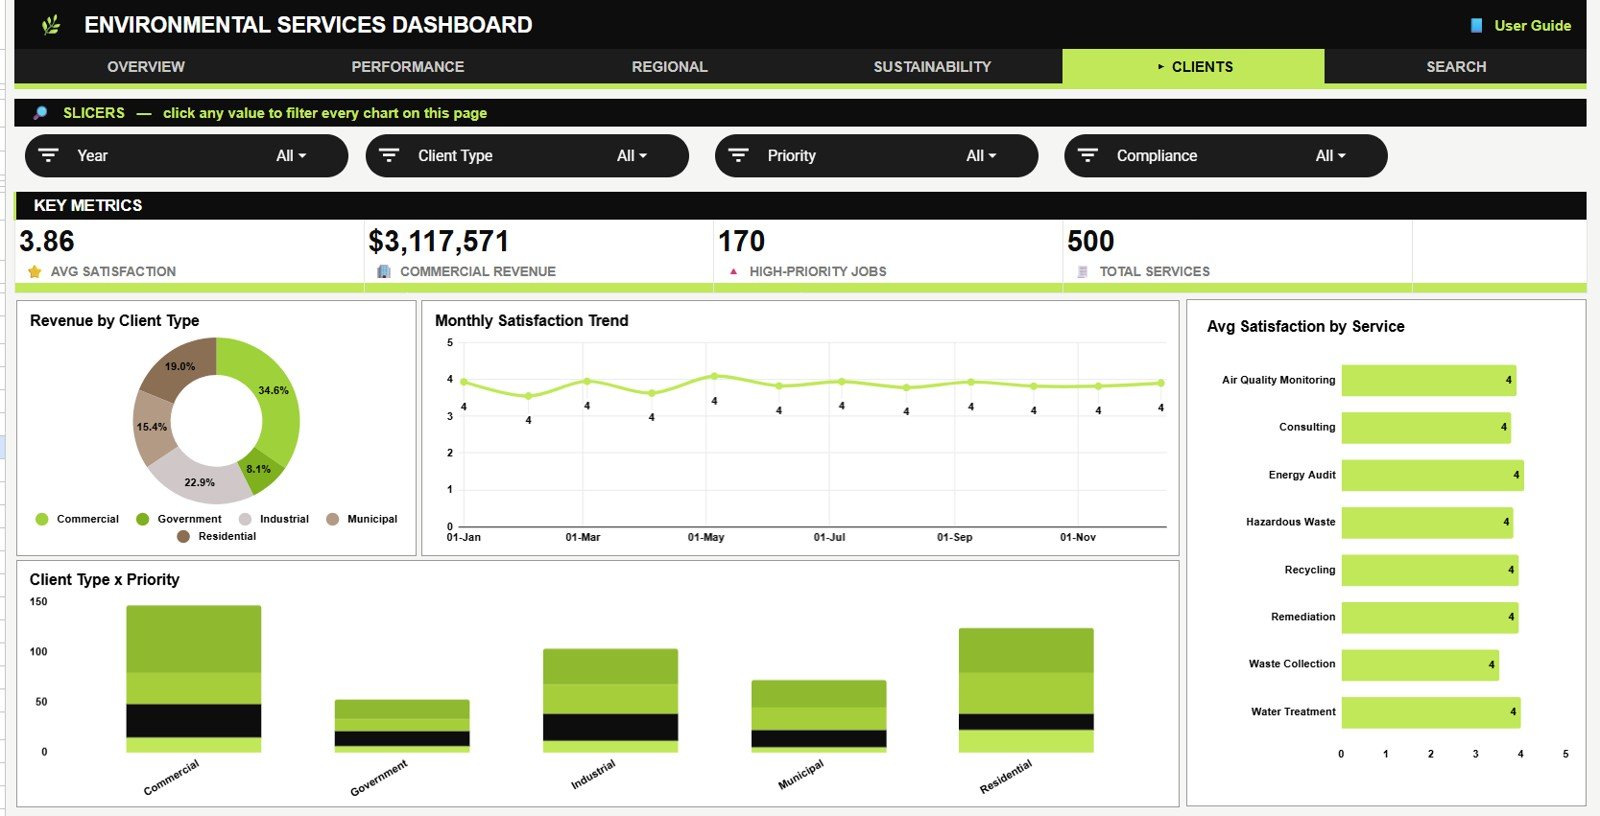
Environmental Services Dashboard in Google Sheets product page
Search Sheet Tab
The Search Sheet includes a record lookup area where users can select a Service ID and view the full details for that service. The lookup shows service type, region, client type, priority, date, month, revenue, cost, volume, recovery rate, satisfaction, CO2 saved, and compliance.
Data Sheet Tab
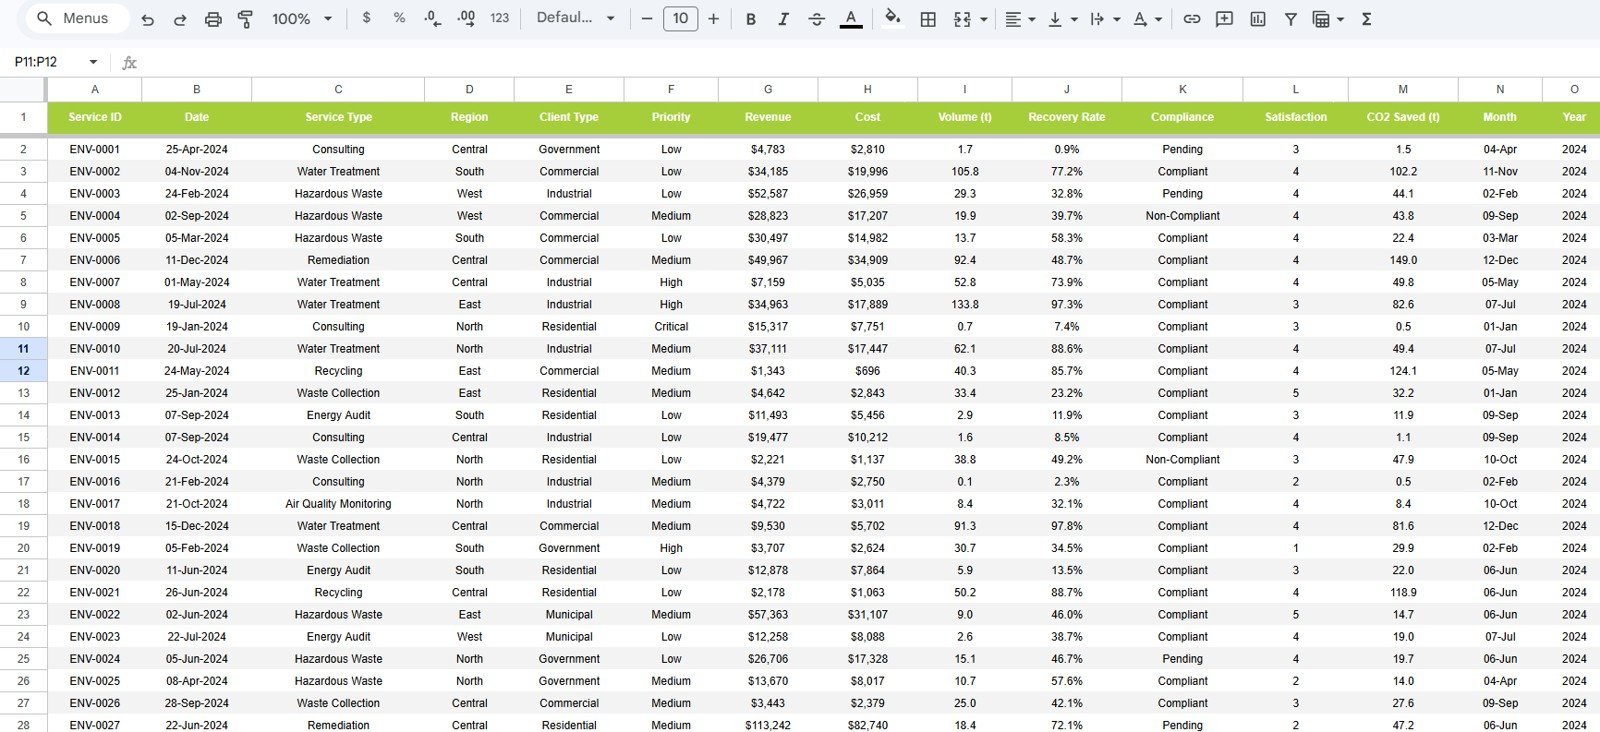
The Data Sheet is where users add the source data in the same format as the sample records. Keeping the column structure consistent allows the KPI cards, charts, slicers, and Search Sheet lookup to update correctly.
Environmental Services Dashboard in Google Sheets product page
Environmental Services Dashboard in Google Sheets vs. Microsoft Excel Dashboard vs. Paid Environmental SaaS – Feature Comparison
| Feature | This template | Microsoft Excel dashboard | Paid environmental SaaS |
|---|---|---|---|
| Cost | $9.99 sale price, one-time | Template cost plus Microsoft licensing | Usually monthly or annual subscription |
| Platform | Google Sheets in Drive | Excel desktop or web | Vendor-hosted application |
| Setup time | Copy the file and replace sample records | Open workbook and customize | Often requires onboarding and configuration |
| Real-time team collaboration | Built into Google Sheets sharing | Available through Microsoft sharing tools | Usually included by user role |
| Mobile access | Google Sheets app or browser | Excel mobile app | Usually included |
| Customizable fields | Editable sheet labels and records | Editable workbook structure | Depends on vendor settings |
| Share with link | Yes, through Google Drive permissions | Yes, through OneDrive or SharePoint | Usually invite-based |
| Year-1 cost at 5 users | $9.99 before any Google Workspace costs | Template plus license costs | Can rise quickly with users and modules |
| Service ID lookup | Included Search Sheet | Must be built or customized | Usually included |
| Best fit | Lightweight reporting and team review | Teams standardized on Excel | Regulated workflows and system integrations |
Who Should Use This Template
Environmental Services Dashboard in Google Sheets product page
This dashboard is useful for environmental service providers, waste management companies, recycling teams, remediation service providers, municipal environmental departments, sustainability analysts, operations managers, and consultants. It works best when you already have service records and need a faster way to present them.
Because it is built in Google Sheets, teams can use normal Drive sharing permissions. Google provides official guidance for sharing files from Google Drive, which is helpful when deciding who should view or edit the dashboard.
Real-World Use Cases
Operations review: A recycling operations manager can use the Overview and Performance tabs to review revenue, volume, service priority, and recovery rate before a weekly team meeting.
Municipal reporting: A city environmental analyst can use the Regional and Sustainability pages to explain service impact by region, including CO2 saved and compliance status.
Client reporting: A sustainability consultant can use the Clients page and Search Sheet to prepare monthly updates for commercial or municipal clients without rebuilding charts manually.
Advantages of Environmental Services Dashboard in Google Sheets
- It uses a familiar spreadsheet interface, so users do not need a new software login.
- It combines financial, operational, regional, sustainability, and client reporting in one file.
- It includes a Search Sheet for fast Service ID lookup.
- It can be shared with team members through Google Drive permissions.
- It is easier to customize than many locked SaaS reports.
Opportunities for Improvement
This template does not automatically connect to dispatch systems, scales, route systems, invoices, sensors, or regulated compliance databases. Teams that need automatic data ingestion can use this dashboard as a reporting layer after exporting records from another system.
For highly regulated filings, users should confirm internal data governance rules before relying on any spreadsheet-based reporting process.
Best Practices
- Keep Service ID values unique so the Search Sheet returns the right record.
- Do not change source column names unless you also update the formulas and charts.
- Refresh or review the dashboard after adding new data rows.
- Use protected ranges if multiple team members will edit the file.
- Keep one clean backup copy before making structural changes.
Explore Relevant Templates
- Environmental Services Dashboard in Google Sheets – the product page for this template.
- Environmental Services Dashboard in Power BI – for teams that prefer BI reporting.
- Environmental Services KPI Dashboard in Excel – for teams standardized on Microsoft Excel.
- ESG Environmental Dashboard in Google Sheets – for ESG pillar reporting.
- Smart Workplace Sustainability Dashboard in Google Sheets – for workplace sustainability tracking.
Frequently Asked Questions
Environmental Services Dashboard in Google Sheets product page
What data does this dashboard track?
It tracks Service ID, service type, region, client type, priority, date, month, revenue, cost, volume, recovery rate, satisfaction, CO2 saved, and compliance status.
Can I use this with my own environmental service records?
Yes. Replace the sample records in the Data Sheet while keeping the same column structure.
Does this template require add-ons?
No. It is designed for standard Google Sheets use.
Can multiple people collaborate on the file?
Yes. After copying the template to Google Drive, you can share view or edit access with your team.
Is it a replacement for environmental compliance software?
No. It is a reporting dashboard, not a regulated compliance filing system, dispatch system, or legal archive.
Can I customize the dashboard pages?
Yes. You can edit labels, data, charts, and formulas if you are comfortable working in Google Sheets.
About the Author
Built by PK – Microsoft Certified Professional with 15+ years of Excel, Google Sheets, and Power BI experience. Founder of NextGenTemplates, reaching 300K+ subscribers across YouTube channels. Every template is hand-built and tested before release.
Conclusion
The Environmental Services Dashboard in Google Sheets gives environmental service teams a clear way to review revenue, service activity, regions, sustainability impact, clients, and individual service records. It is best for teams that want a practical spreadsheet-based dashboard before moving into larger environmental systems.
Visit the Environmental Services Dashboard in Google Sheets product page to review the template. For step-by-step Google Sheets and dashboard tutorials, visit