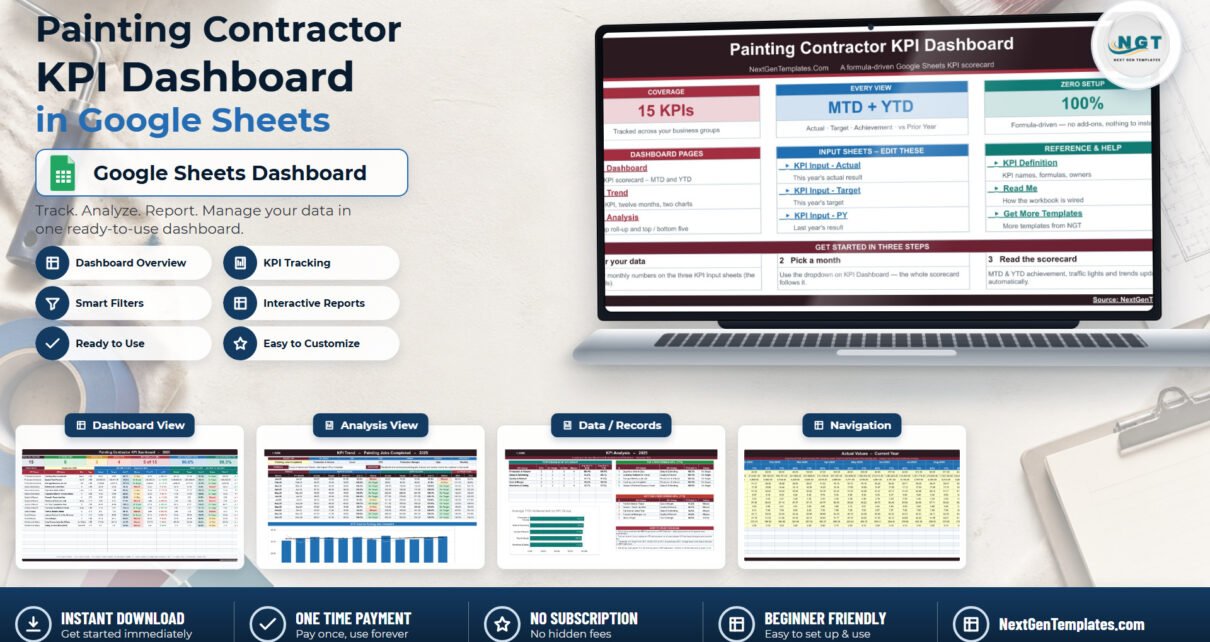
The Painting Contractor KPI Dashboard in Google Sheets tracks 15 painting-business KPIs across 5 KPI groups and 9 sheets, and reports each one twice — month-to-date and year-to-date — against target and against the same period last year. Pick a month from a single dropdown and the entire scorecard, the trend page and the analysis page recalculate. It is 100% formula-driven: no add-on, no Apps Script, no refresh step.
Most painting contractors already know their revenue. What they usually cannot see on one page is whether the close rate is slipping, whether rework is eating the margin the estimator priced in, and whether crews are getting slower or safer. This template puts all of that on one scorecard, with a traffic light on every row, so a monthly review takes minutes rather than an afternoon of spreadsheet archaeology.
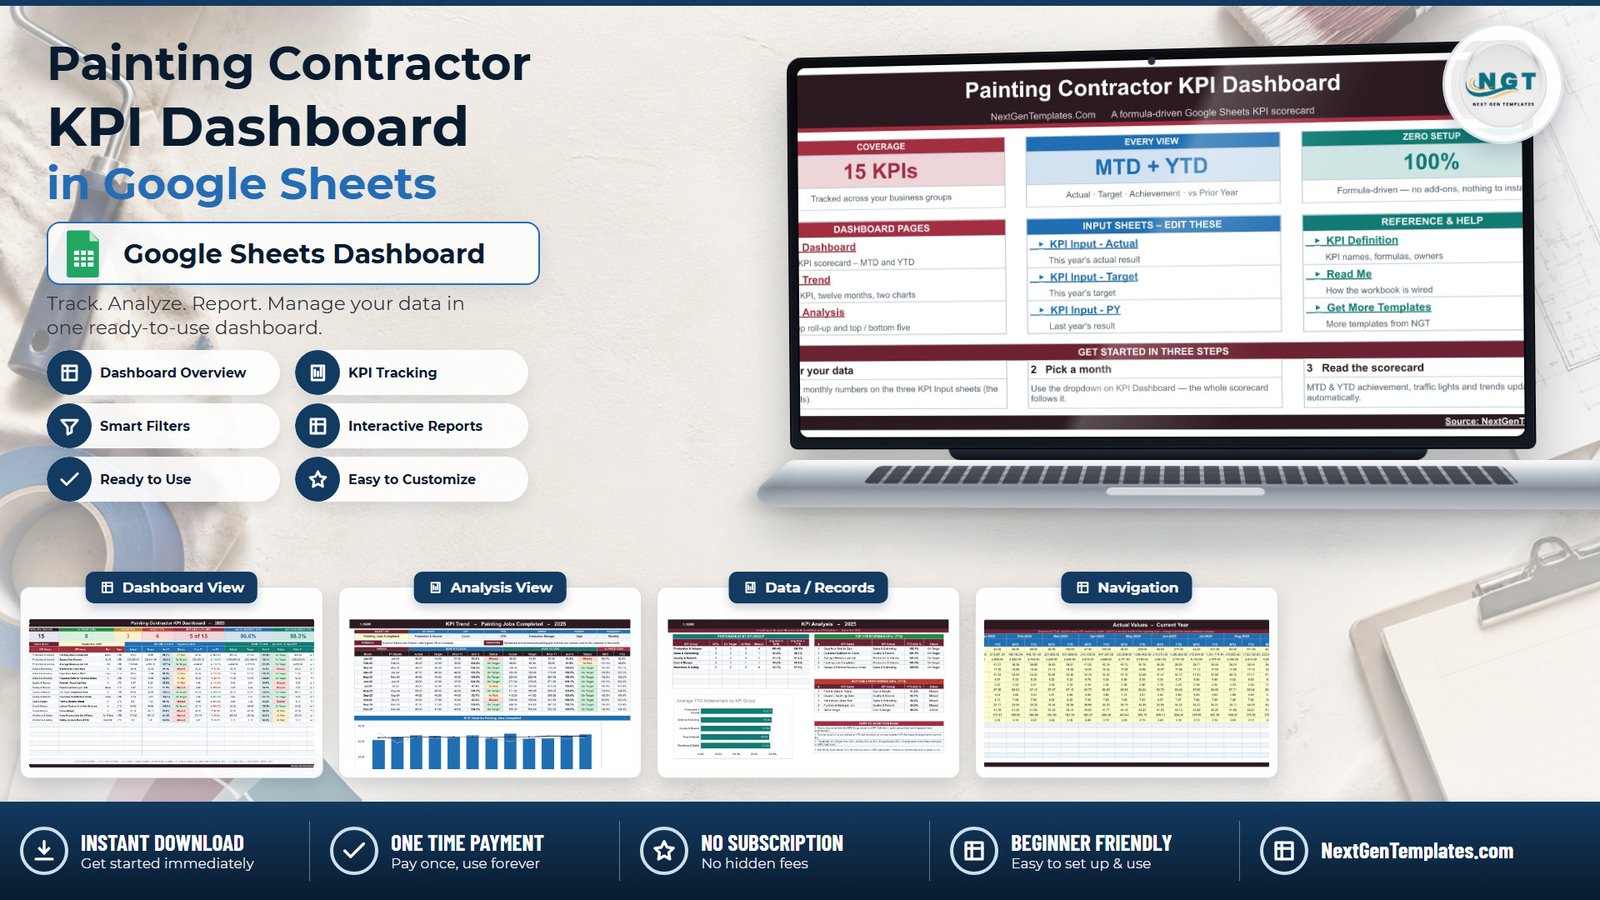
A quick note on naming. NextGenTemplates publishes more than one painting template, and the names look similar. This post is about the KPI Dashboard build — the month-picker scorecard with a KPI Trend page and a KPI Analysis page. It is a different file from the Painting Contractor KPI Scorecard in Google Sheets, which is a lighter, separate layout. Same trade, two different products.
Key Features of the Painting Contractor KPI Dashboard in Google Sheets
- 15 painting-specific KPIs. Painting Jobs Completed, Square Feet Painted, Average Revenue per Job, Estimate-to-Close Rate, Days from Sold to Start, Repeat & Referral Revenue Share, Rework / Touch-Up Rate, Punch-List Items per Job, On-Time Completion Rate, Customer Satisfaction Score, Paint & Material Waste, Labour Cost as % of Job Revenue, Gross Margin, Crew Productivity (Sq Ft/Day) and Safety Incident Rate (TRIR).
- Five KPI groups. Production & Volume, Sales & Estimating, Quality & Rework, Cost & Margin, and Workforce & Safety — so a weak area is visible as a group, not just as one stray row.
- One month dropdown drives every page. Selecting September 2025 shows MTD figures for September and YTD figures for January to September, and the Trend and Analysis pages follow the same choice.
- Direction-aware scoring. Every KPI is tagged UTB (upper-the-better) or LTB (lower-the-better). Achievement is Actual ÷ Target for UTB and Target ÷ Actual for LTB, so beating a cost, cycle-time or safety target correctly scores above 100%.
- Three status bands. On Target at 100% and above, At Risk from 95% to 99%, Missed below 95%. The thresholds live in the Status formulas on the KPI Dashboard sheet, so they can be changed.
- Prior-year comparison on every row, for both MTD and YTD, with the arrow colour set by direction — a falling TRIR reads green, a rising one reads red.
- The KPI list is the control panel. Add, rename or delete a row on the KPI Definition sheet and every other sheet follows automatically. No formula edits.
Dashboard Pages Explanation
Home & Navigation
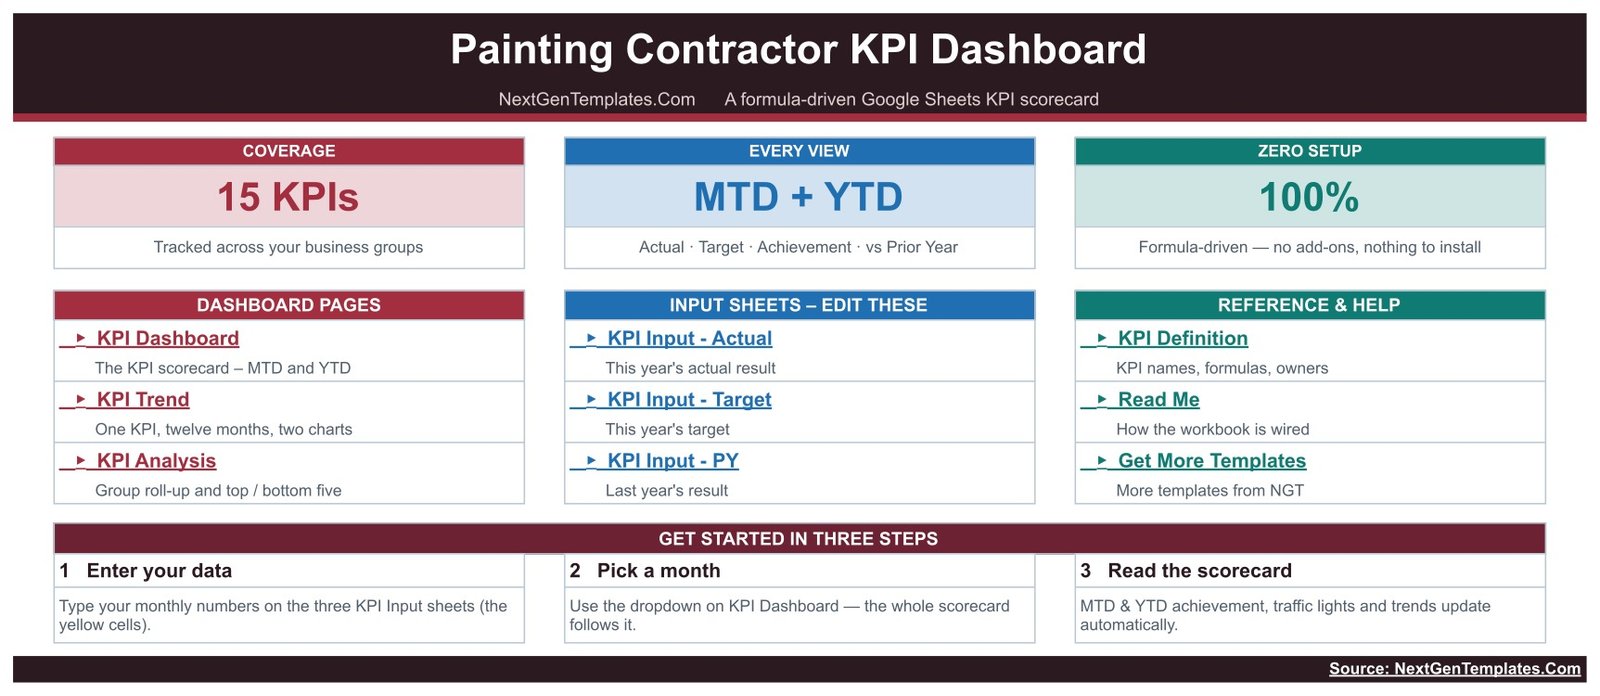
The landing sheet opens with three summary cards — 15 KPIs tracked, MTD + YTD in every view, and 100% formula-driven — then splits into three link groups: the dashboard pages, the input sheets you edit, and the reference sheets. A three-step start strip at the bottom tells a first-time user exactly what to do: enter your data, pick a month, read the scorecard.
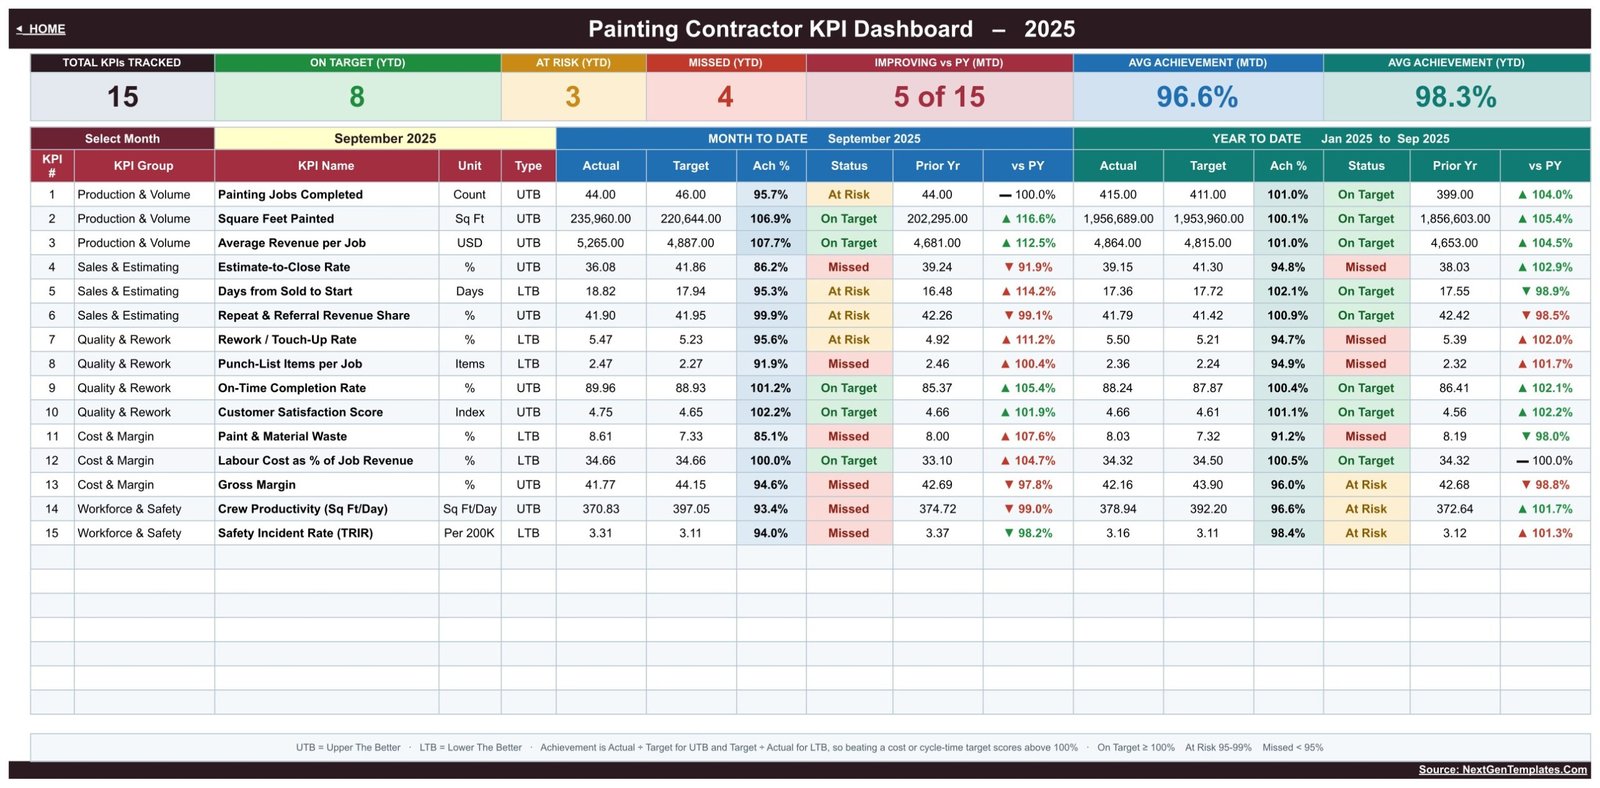
KPI Dashboard — the month-picker scorecard
Seven header cards summarise the year: Total KPIs Tracked, On Target (YTD), At Risk (YTD), Missed (YTD), Improving vs PY (MTD), Avg Achievement (MTD) and Avg Achievement (YTD). Under them sits the grid — all 15 KPIs with group, unit and UTB/LTB type, followed by a Month-to-Date block and a Year-to-Date block, each carrying Actual, Target, Ach %, Status, Prior Yr and vs PY.
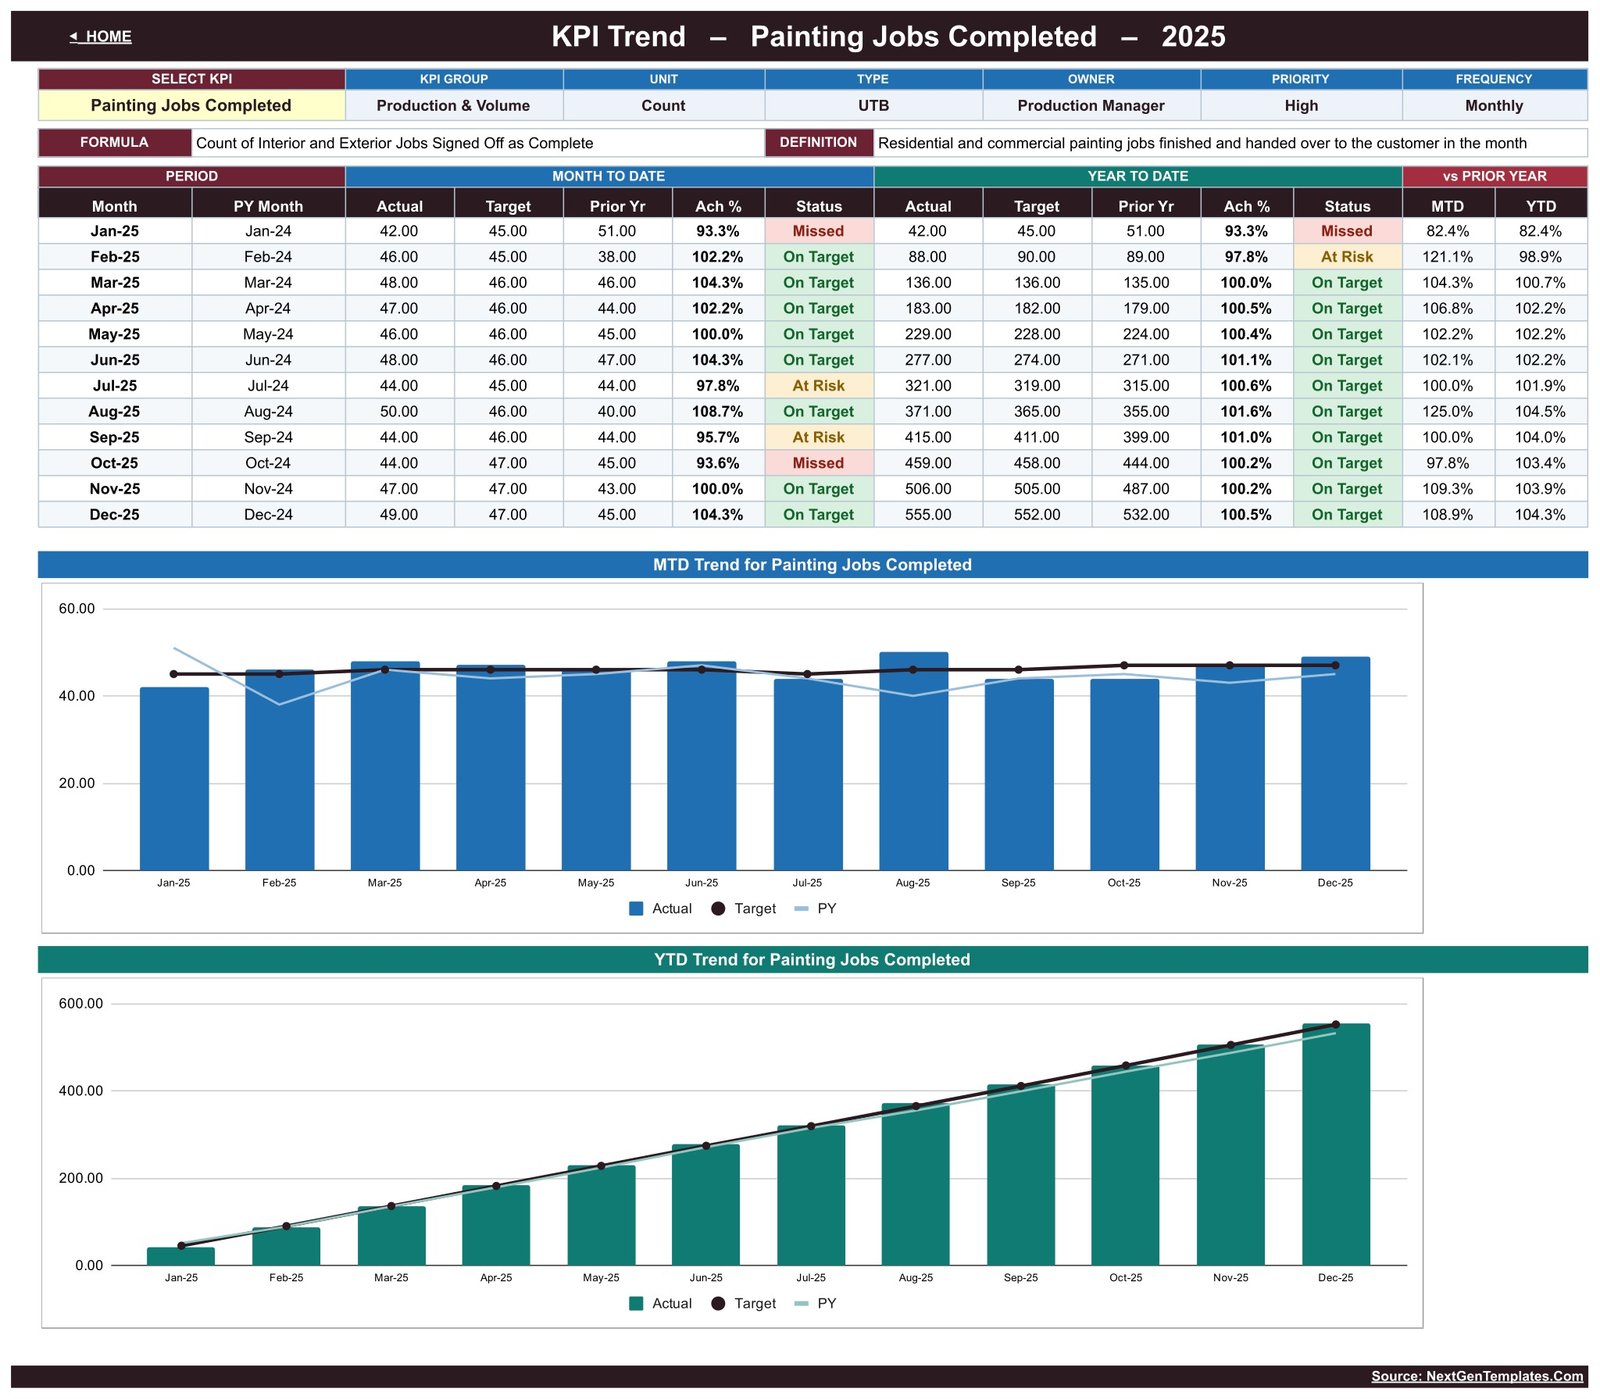
KPI Trend — one KPI, twelve months
Select any KPI from the dropdown and the header strip fills in its group, unit, type, owner, priority and frequency, with the calculation formula and plain-English definition beside them. A twelve-month table then lists MTD and YTD actual, target, prior year, achievement and status for every month, plus vs prior year for both. Two charts close the page: Painting Jobs Completed by Month (MTD) and Painting Jobs Completed by Month (YTD), each plotting actual columns against a target line and a prior-year line.
KPI Analysis — group roll-up and top / bottom five
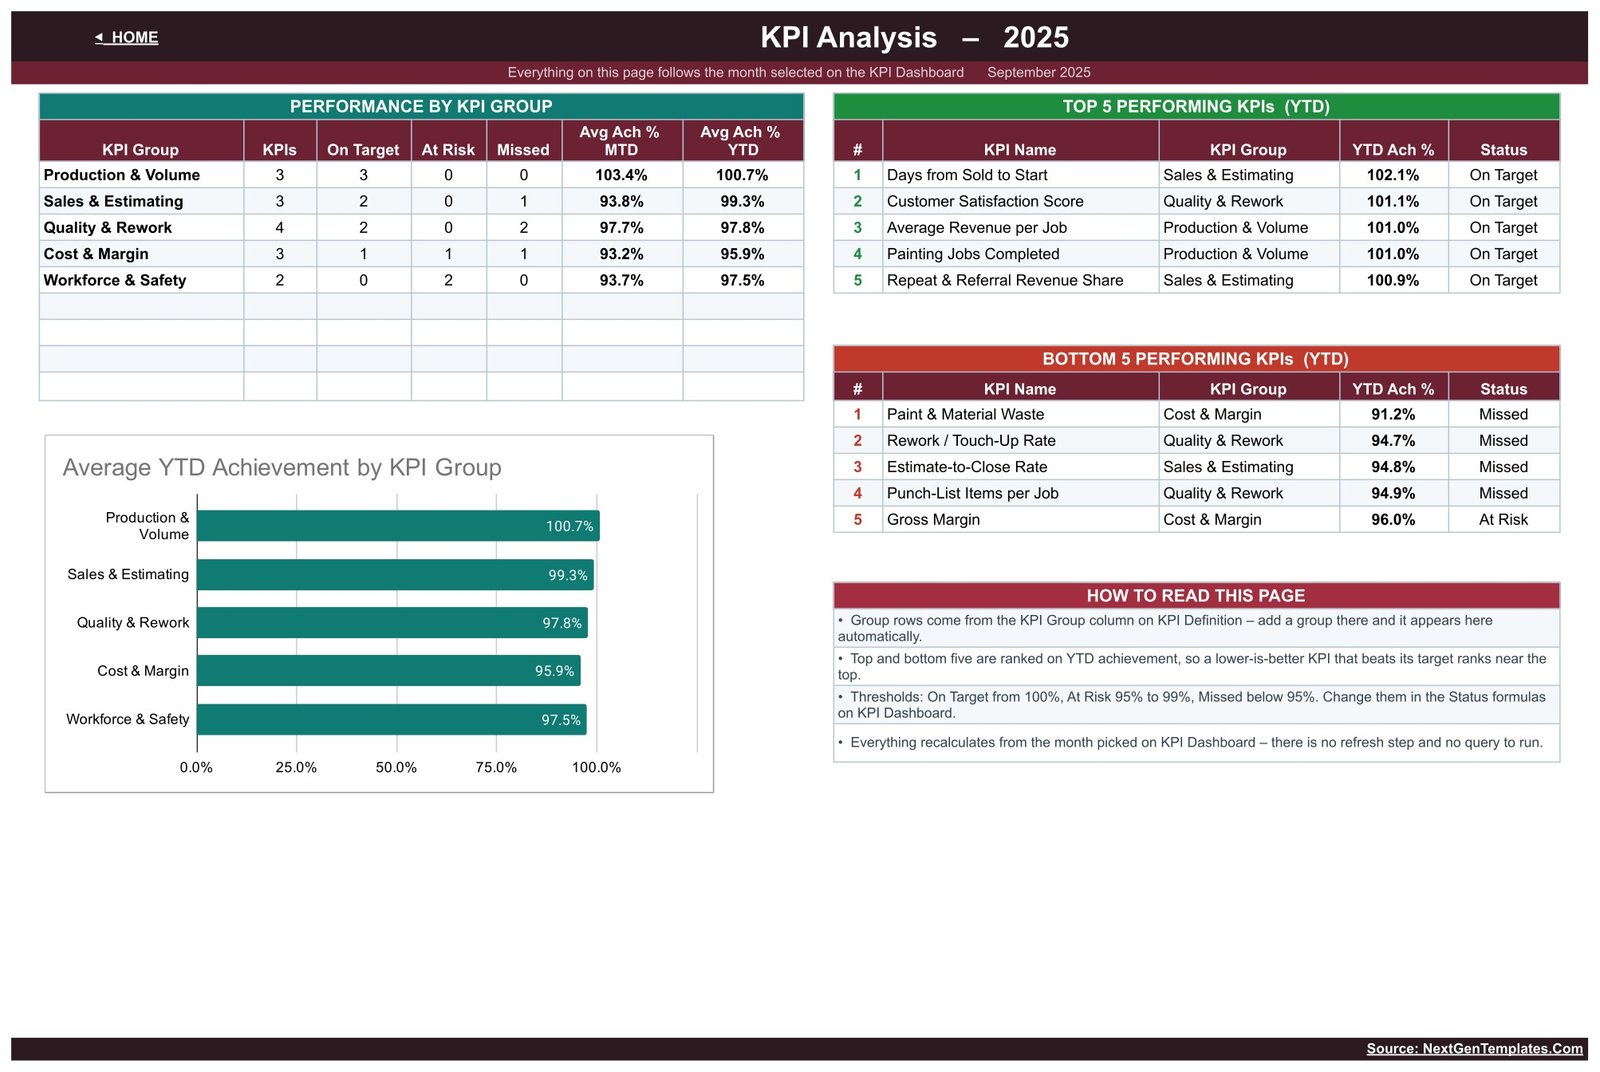
The Performance by KPI Group table counts On Target, At Risk and Missed KPIs per group and shows average MTD and YTD achievement for each. Beside it, Top 5 and Bottom 5 Performing KPIs are ranked on YTD achievement, each with its group and status. The chart is Average YTD Achievement by KPI Group. A short “How to read this page” panel explains that groups come from the KPI Definition sheet and that everything follows the month picked on the KPI Dashboard.
KPI Input – Actual, Target and PY
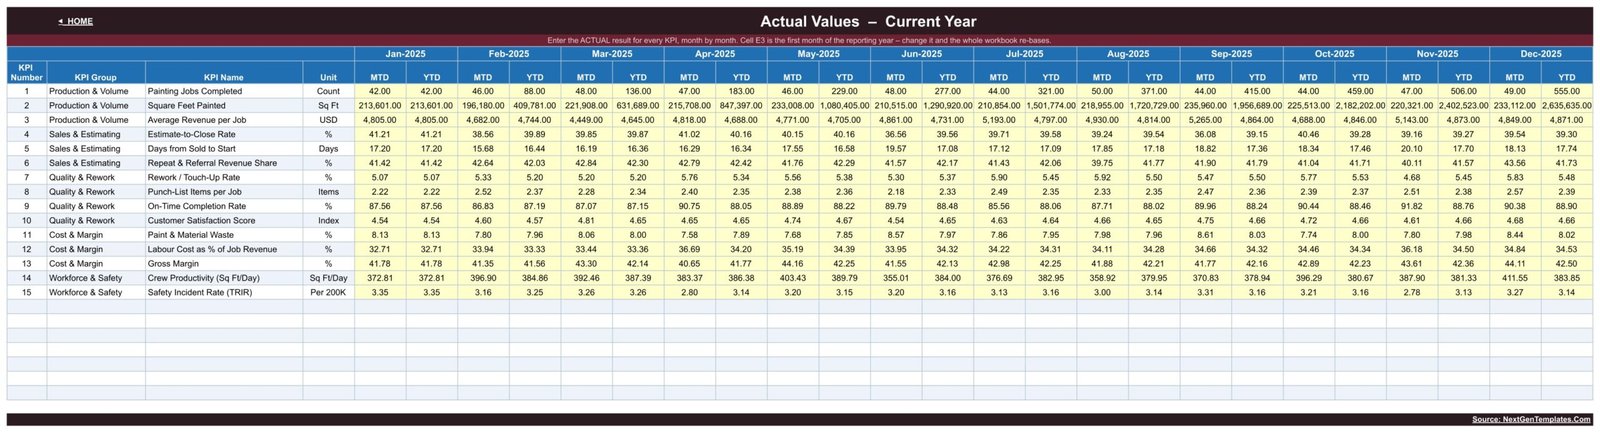
Three input sheets share one layout. The Actual Values sheet holds this year’s result for every KPI, month by month, with MTD and YTD columns side by side from January to December, all in yellow entry cells. The Target sheet holds the budget and the PY sheet holds last year’s figures. Cell E3 sets the first month of the reporting year, so changing it re-bases the whole workbook.
KPI Definition — the master list
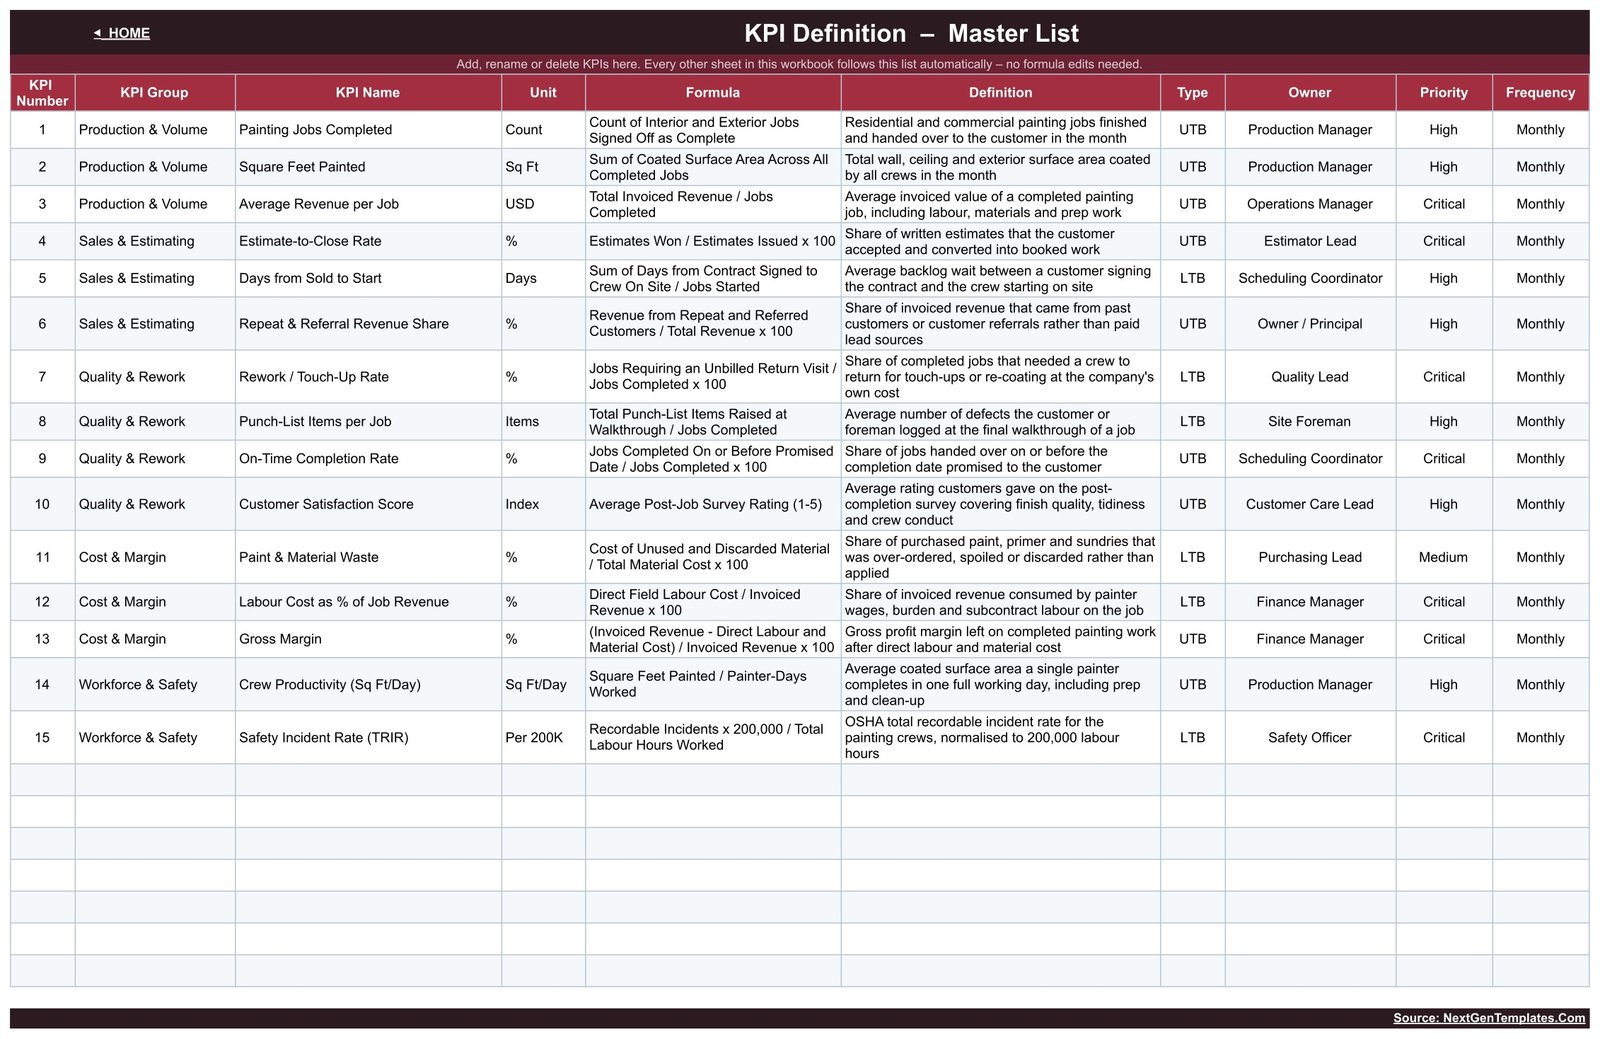
Every KPI is documented with its number, group, name, unit, calculation formula, definition, UTB/LTB type, owner, priority and frequency. Rework / Touch-Up Rate, for example, is defined as jobs requiring an unbilled return visit divided by jobs completed, owned by the Quality Lead, flagged Critical and reviewed monthly. Safety Incident Rate is the OSHA total recordable incident rate normalised to 200,000 labour hours, owned by the Safety Officer.
Painting Contractor KPI Dashboard vs. Microsoft Excel Dashboard vs. Paid Field-Service SaaS — Feature Comparison
| Feature | Painting Contractor KPI Dashboard in Google Sheets | Microsoft Excel Dashboard | Jobber / ServiceTitan / Housecall Pro |
|---|---|---|---|
| Cost | $8.99 one-time | $9.99–$19.99 one-time + Excel licence | $49–$399 / month |
| Platform | Google Sheets, any browser | Desktop Excel | Vendor cloud only |
| Setup time | Under 10 minutes ✅ | 15–20 minutes | Days of onboarding |
| Real-time team collaboration | Yes, native ✅ | Only via OneDrive co-authoring | Yes |
| Mobile access | Google Sheets app ✅ | Limited | Yes |
| Customisable KPI list | Edit the KPI Definition sheet ✅ | Yes, with formula edits | Fixed vendor metrics |
| Share with a link | Yes ✅ | File attachment | Paid seat required |
| Prior-year comparison built in | Yes, MTD and YTD ✅ | Yes | Reporting tier only |
| Year-1 cost at 5 users | $8.99 ✅ | $19.99 + licences | $3,000–$12,000 |
For painting crews that want month-by-month KPI discipline without paying a per-technician SaaS seat, the Painting Contractor KPI Dashboard in Google Sheets sits in the sweet spot.
Who Should Use This Template
Perfect for:
- Residential and commercial painting contractors running 2–20 crews with a monthly numbers review
- Owner-operators who already record jobs, revenue and hours somewhere and want a scorecard sitting on top
- Production managers and estimators who need close rate, rework and gross margin on one page
- Painting firms that prepare a monthly management pack or an owner update from Google Drive
Not a fit if:
- You need scheduling, dispatch, invoicing or crew GPS — this is a reporting scorecard, not a field-service platform
- You expect an automatic feed from QuickBooks, Jobber or a CRM — the three input sheets are typed or pasted each month
- You want daily or per-job tracking; the model is monthly throughout
Real-World Use Cases
Marcus runs a 12-painter residential firm in Denver. Each month he enters jobs completed, square feet painted and invoiced revenue, then opens the KPI Dashboard on the first Monday. When Rework / Touch-Up Rate came in at 95.6% achievement and Punch-List Items per Job at 91.9%, both flagged against target, he knew exactly what the crew briefing had to cover — and he did not have to buy a reporting add-on to find out.
Dana is the estimator lead at a commercial painting contractor. Estimate-to-Close Rate and Days from Sold to Start are the two rows she owns. She uses the KPI Trend page to show the owner twelve months of close-rate movement against both target and prior year in one chart, instead of rebuilding a pivot table every quarter.
Ray is the safety officer for a multi-crew painting operation. Safety Incident Rate (TRIR) is flagged LTB, so a drop against prior year shows as a green improvement rather than a red decline. He lifts the Workforce & Safety row from the KPI Analysis group table straight into the monthly safety report.
Advantages of the Painting Contractor KPI Dashboard in Google Sheets
- One-time cost instead of a monthly seat. At $8.99 the template costs less than a single day of most field-service subscriptions, and there is no per-user charge as the crew grows.
- No technical setup. Because everything is native spreadsheet formulas, there is no add-on to authorise, no script to approve and no query to refresh — a real advantage if your Google Workspace admin restricts add-ons.
- Correct maths for lower-is-better metrics. Plenty of home-built scorecards divide actual by target for everything, which quietly rewards rising waste and rising incident rates. This one does not.
- Documented ownership. The KPI Definition sheet names an owner and a priority for every metric, which turns a monthly review into a list of accountable actions.
- Shareable and mobile. Send a link, set view-only for the crew, edit from the Google Sheets mobile app on site.
Opportunities for Improvement
The template is honest about its scope, and it is worth knowing the limits before you buy. Data entry is manual — there is no connector pulling job or invoice data in, so somebody has to spend a few minutes a month on the three input sheets. The model is strictly monthly, so weekly or per-job analysis needs a different tool. The KPI Trend page examines one KPI at a time rather than comparing several at once. And because the sample year is 2025, you will want to re-base cell E3 on the input sheets to your own reporting year on day one. None of these are defects; they are the trade-offs that keep the file light and formula-only.
Best Practices
- Set targets before the year starts, not retrospectively. A target entered after the fact turns the traffic lights into decoration.
- Fill the PY sheet even if last year’s records are rough. The vs PY column is where most of the useful conversation happens.
- Trim the KPI list rather than tracking all 15 badly. Ten well-sourced KPIs beat fifteen guesses.
- Assign each KPI an owner on the KPI Definition sheet and review it with that person, not with the whole team.
- Lock the formula columns and share the file view-only with anyone who is not entering data.
- Take a copy at year end and start a fresh file, so the twelve-month trend stays clean.
Explore Relevant Templates
Also available as: the same 15-KPI painting scorecard ships as the Painting Contractor KPI Dashboard in Excel and the Painting Contractor KPI Dashboard in Power BI.
- Painting Contractor KPI Scorecard in Google Sheets — the separate, lighter scorecard layout for the same trade.
- Roofing Contractor KPI Dashboard in Google Sheets — identical build, roofing KPI set. There is a full write-up of the roofing version too.
- Electrical Contractor KPI Dashboard in Google Sheets — see also the electrical contractor post.
- Plumbing Business KPI Dashboard in Google Sheets and the HVAC Contractor KPI Dashboard in Google Sheets — useful if you run more than one trade under the same roof.
- Browse the whole Google Sheets Dashboards range.
Frequently Asked Questions
What KPIs does the Painting Contractor KPI Dashboard in Google Sheets track?
The Painting Contractor KPI Dashboard in Google Sheets tracks 15 KPIs across five groups: Production & Volume, Sales & Estimating, Quality & Rework, Cost & Margin, and Workforce & Safety. They include Square Feet Painted, Estimate-to-Close Rate, Rework / Touch-Up Rate, Gross Margin and Safety Incident Rate (TRIR).
How long does setup take?
Setup takes under 10 minutes. Make your own copy from the link in the PDF, type or paste your monthly actual, target and prior-year figures into the three yellow input sheets, then pick a month on the KPI Dashboard. There is no add-on, no script and no refresh step to run.
Can I add or remove KPIs?
Yes. The KPI Definition sheet is the master list for the whole workbook. Add a row, rename a KPI, move it to a different group or switch it between UTB and LTB, and the KPI Dashboard, KPI Trend and KPI Analysis pages pick the change up with no formula edits.
How does the Painting Contractor KPI Dashboard score a lower-is-better KPI?
Achievement is Target ÷ Actual for LTB metrics and Actual ÷ Target for UTB metrics. Beating a waste, cycle-time or safety target therefore scores above 100% and shows green, while a rising Safety Incident Rate correctly registers as a red movement against prior year.
How is this different from the Painting Contractor KPI Scorecard?
The Painting Contractor KPI Dashboard in Google Sheets is the month-picker build with a traffic-light scorecard grid, a single-KPI Trend page and a group Analysis page. The Painting Contractor KPI Scorecard is a separate template with its own lighter layout. Both cover painting work, but they are two different files.
How does this compare to Jobber or ServiceTitan?
Jobber and ServiceTitan run scheduling, dispatch and invoicing from roughly $49 per month upward. The Painting Contractor KPI Dashboard in Google Sheets is a one-time $8.99 reporting layer over numbers you already hold, with no seat limits and no data leaving your own Google Drive.
Do I need Excel or a paid add-on to use it?
No. The Painting Contractor KPI Dashboard in Google Sheets is entirely formula-driven and runs in a free Google account in any browser. If you would rather work on the desktop, the same KPI set is also published as an Excel workbook and a Power BI report.
About the Author
Built by PK — Microsoft Certified Professional with 15+ years of Excel, Google Sheets and Power BI experience. Founder of NextGenTemplates, reaching 300K+ subscribers across YouTube channels. Every template is hand-built and tested before release.
Conclusion
If you run a painting business and your monthly review is still a phone call and a gut feeling, the Painting Contractor KPI Dashboard in Google Sheets gives you 15 measured KPIs, a traffic light on every one, and a twelve-month trend behind each. It costs less than an hour of a painter’s time and it will outlive any single job.
👉 Click here to Purchase the Painting Contractor KPI Dashboard in Google Sheets
✅ Instant download · One-time payment · No subscription
🎥 For step-by-step walkthroughs, visit Youtube.com/@NeoTechNavigators.
Last updated: August 2026