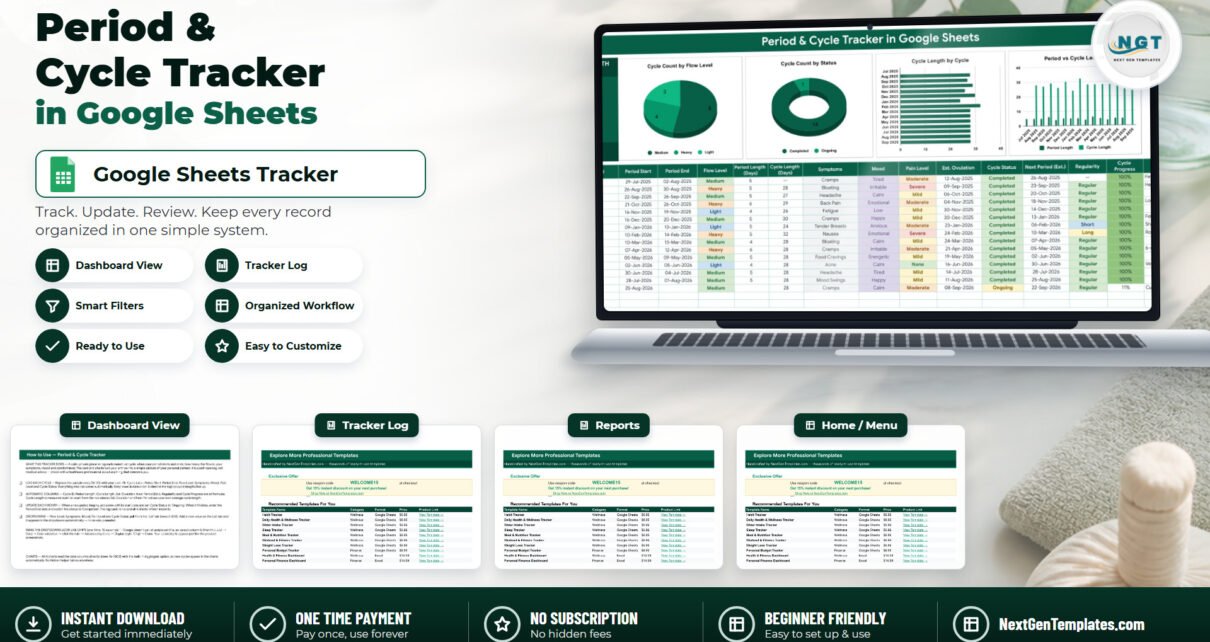
The Period & Cycle Tracker in Google Sheets records one menstrual cycle per row across 16 columns, fills 7 of those columns by formula, and drives 1 summary card and 4 charts that update the moment you type. Five dropdown lists ship with 31 pre-loaded values – 5 flow levels, 11 symptoms, 8 moods, 4 pain levels and 3 cycle statuses – and the log has room for roughly 985 cycles before you touch a single formula.
Cycle notes usually live in three places at once: a phone app you stopped opening, a note on the fridge, and memory. When someone asks how long your cycles have been running, none of the three can answer. A single dated table can, and that is all this template is – a table, a card and four charts, in a file that belongs to you.
Get the Period & Cycle Tracker in Google Sheets
Before anything else: what this template is, and what it is not
This is a personal record-keeping spreadsheet. It is not a medical device. It does not diagnose, screen, treat or monitor any condition, it uses no clinical scale or validated questionnaire, and it interprets nothing you enter.
Two columns need to be described precisely, because their names invite more than they do. Est. Ovulation and Next Period (Est.) are ordinary arithmetic on your own average cycle length – a date shifted forward by a number the sheet worked out from the rows above. They are not a fertility test, not a fertile-window prediction, and not a contraceptive method. Nothing in the file should be relied on to avoid or to achieve a pregnancy. Regularity is the same kind of arithmetic: it compares one cycle length with your own average and prints Short, Regular or Long. It is a description of your numbers, never an assessment of your health.
It is also worth being blunt about storage. A Google Sheet is not encrypted, HIPAA-compliant or GDPR-compliant storage, and this template makes no such claim. It is a private notebook for one person.
If anything about your cycle worries you – a change in length, unusual bleeding, pain that interferes with your day – please speak to a qualified healthcare professional. A dated log is genuinely useful to bring to that appointment. It is not a substitute for it, and the file’s own How to Use tab says exactly the same thing.
Key Features of the Period & Cycle Tracker
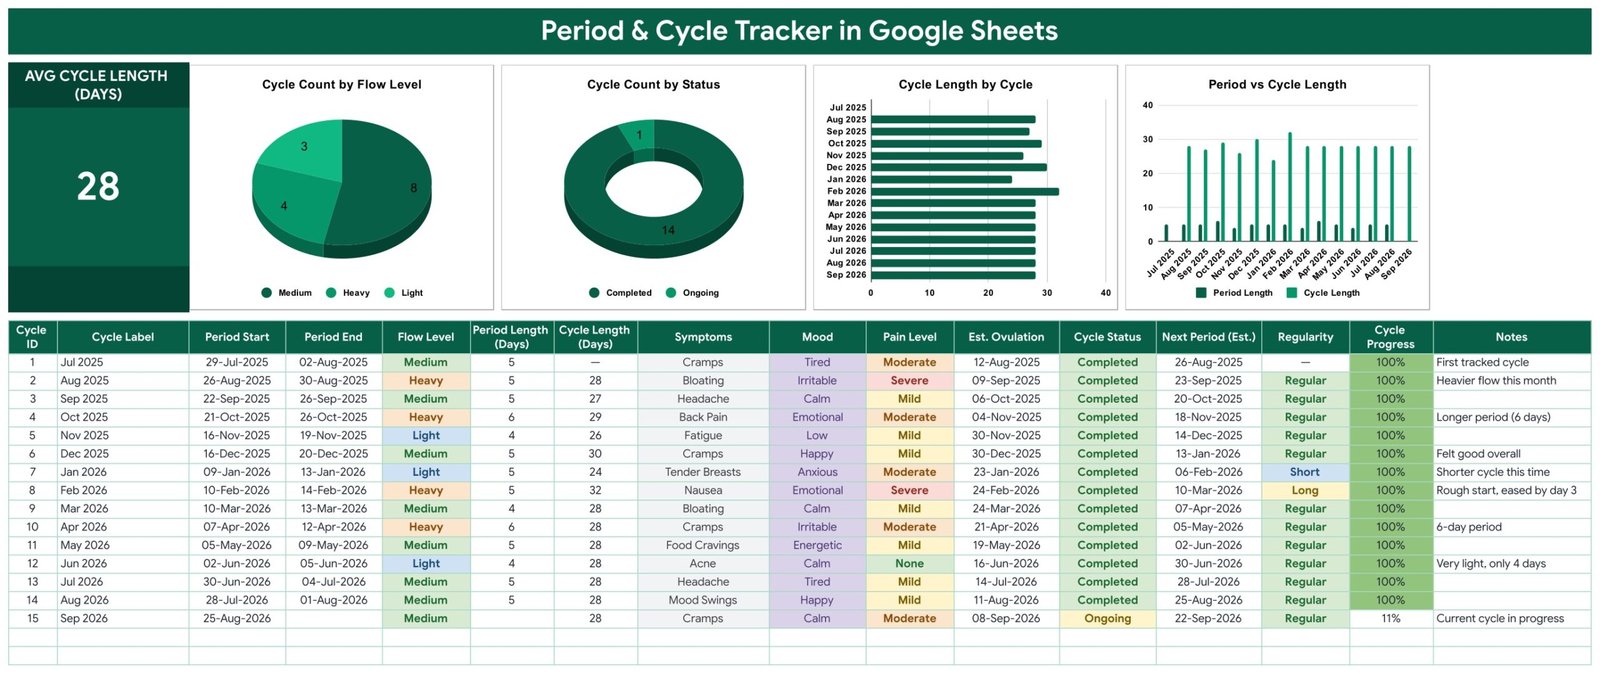
- Sixteen columns, eight of them yours. Cycle ID, Cycle Label, Period Start, Period End, Flow Level, Period Length (Days), Cycle Length (Days), Symptoms, Mood, Pain Level, Est. Ovulation, Cycle Status, Next Period (Est.), Regularity, Cycle Progress and Notes. You type eight; the other seven fill themselves.
- Cycle length is measured start to start. Each row’s Cycle Length (Days) is the gap between that Period Start and the one on the row above – the way cycle length is normally counted, rather than the length of the bleed.
- Period Length is separate. The number of days between Period Start and Period End sits in its own column, so a long period and a long cycle never get confused with one another.
- One summary card. Avg Cycle Length (Days), averaged across every completed cycle in your log. In the sample data it reads 28.
- Four charts named by what they measure. Cycle Count by Flow Level, Cycle Count by Status, Cycle Length by Cycle, and Period vs Cycle Length – the last one plotting both lengths side by side so you can see them move together or apart.
- Charts read the columns directly with the built-in Aggregate option, down to row 1000, with no hidden helper tables anywhere in the file.
- Dropdown lists you can extend. Flow Level, Symptoms, Mood, Pain Level and Cycle Status each read rows 2 to 500 of their column on the List tab, so a symptom you type there appears in the dropdown immediately.
- Cycle Progress shows how far through the current cycle today is, as a percentage of your own average length.
- Fifteen sample cycles from Jul 2025 to Sep 2026 are already in place – fourteen Completed, one Ongoing – so you can see everything working before you clear them.
Template Structure – the four tabs explained
Tab 1: Period & Cycle Tracker
The working page, and the whole product. A green title banner runs across the top. Below it, the Avg Cycle Length card sits on the left with the four charts to its right. The log table’s header is on row 15 and your cycles start at row 16, which leaves room for roughly 985 entries within the charted range. Flow Level, Symptoms, Mood, Pain Level and Cycle Status are colour-coded dropdowns, so a year of cycles reads as a block of colour before you read a single number.
Tab 2: List
Five columns that feed every dropdown: Flow Level (Spotting, Light, Medium, Heavy, Very Heavy), Symptoms (None, Cramps, Bloating, Headache, Fatigue, Back Pain, Tender Breasts, Nausea, Acne, Food Cravings, Mood Swings), Mood (Happy, Calm, Energetic, Irritable, Anxious, Emotional, Tired, Low), Pain Level (None, Mild, Moderate, Severe) and Cycle Status (Completed, Ongoing, Predicted). Add a row under any of them and the dropdown picks it up with no other setup.
Tab 3: How to Use
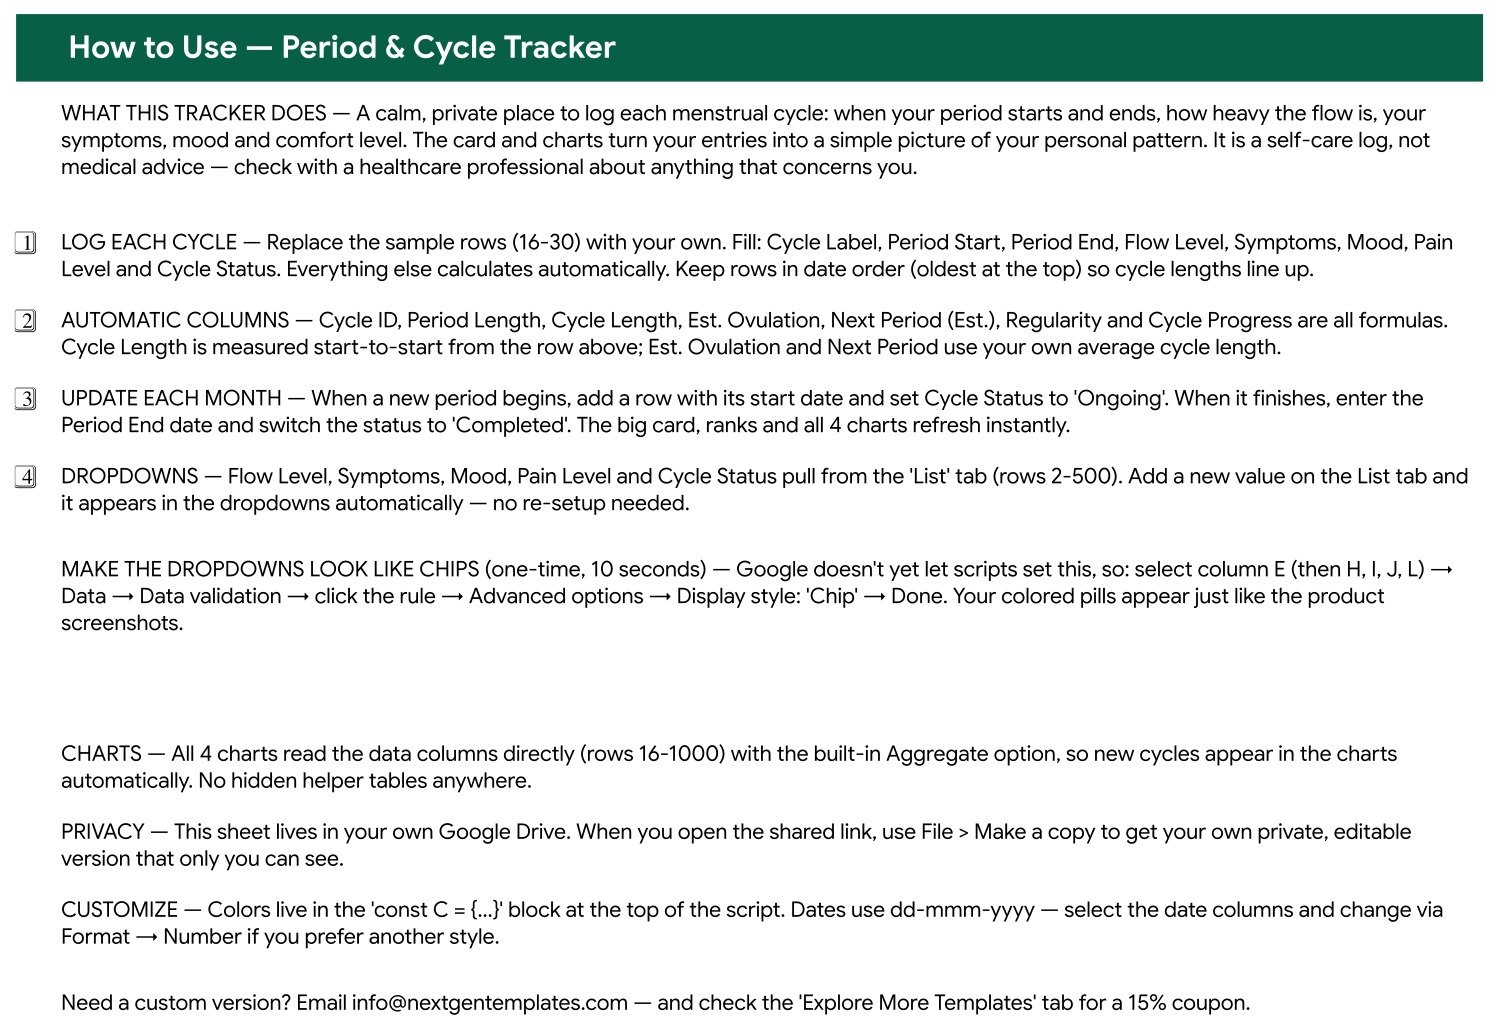
A short guide that travels with the file: which eight columns to fill, which seven calculate themselves, what to do when a new period starts, how the dropdowns are wired, how to turn them into coloured chips, how the charts read the data, the privacy note, and how to change the colours or the dd-mmm-yyyy date format.
Tab 4: Explore More Templates
A closing page with a 15% coupon code and links to related NextGenTemplates files. Nothing on it affects the tracker.
Period & Cycle Tracker in Google Sheets vs. Excel vs. a Paid Period App – Feature Comparison
| This template | An Excel sheet you build | Paid period app | |
|---|---|---|---|
| Cost | One payment | Free, plus your time | Roughly $5-$10 a month |
| Platform | Google Sheets, any browser | Microsoft Excel | Phone app |
| Setup time | Minutes – copy, clear the samples, log | Hours of formula and chart work | Minutes |
| Where the data lives | Your own Google Drive | Your own device | The vendor’s servers |
| Mobile access | Google Sheets mobile app | Excel mobile app | Native app |
| Customisable fields | Yes – edit the List tab, add columns | Yes | Usually fixed |
| Share with a link | Yes, if you choose to | Needs a cloud service | Limited |
| Year-one cost | The purchase price | Free | Around $60-$120 |
| Cycle length, regularity, estimates | Built in as formulas | You write them | Built in |
| Reminders and notifications | None | None | Yes |
| Exports to a plain table | Already is one | Already is one | Often paywalled or unavailable |
Who Should Use This Template
It suits anyone who wants their cycle history written down in a file they control. That includes people who prefer a spreadsheet to a phone app, people gathering dates and symptoms to take to an appointment, people who already work in Google Sheets every day, and people who simply want to stop trying to remember when the last period started.
It does not suit you if you want push notifications – there are none. It is the wrong tool if you need clinically validated symptom scoring, encrypted or compliant storage, or anything that has to stand up as a medical record. And it is emphatically the wrong tool if you are looking for contraception or fertility software.
Real-World Use Cases
Preparing for an appointment. A GP asks how long your cycles have been running and whether anything has changed. Instead of scrolling through a year of phone notes, you read the average off the card and point at the two rows the Regularity column flagged Short and Long. The conversation starts from a record rather than a recollection.
Keeping the data off a company’s servers. Some people are happy to use a health app and some are not. Making a copy into your own Drive, sharing it with nobody, and typing eight fields once a month is a complete answer for the second group.
Watching one thing over time. If you suspect heavier months come with worse cramps, six months of Flow Level and Pain Level entries give you something concrete to look at. The Cycle Count by Flow Level chart counts what you logged. It describes your entries; it does not explain them.
Advantages of the Period & Cycle Tracker
The strongest thing about it is how little it asks. Eight fields a month, most of them a click on a dropdown, and the seven calculated columns keep themselves current. Because the charts point straight at the data columns rather than at a helper table, adding a row is genuinely the only maintenance there is – nothing to refresh, no range to extend, no pivot to rebuild.
The second is the separation of concerns. Period Length and Cycle Length are different numbers in different columns, Cycle Status distinguishes a finished cycle from one in progress, and Notes stays free-text for the things that do not fit anywhere else. That structure is what makes six months of entries readable instead of merely stored.
Opportunities for Improvement
Be clear about the gaps before you buy. There are no reminders – nothing will prompt you to log. There is no filter or slicer view; the log is one flat table you scroll, so a very long history is read by sorting or by Google Sheets’ own filter tools rather than by a control built into the page. There is no separate reports page and no home or menu page – four tabs is the whole file.
Two smaller notes. The coloured chip display on the dropdown columns has to be switched on once by hand, because Google does not currently let a script set it; the How to Use tab walks through the ten-second step, and Google’s own data validation documentation covers the same options. And the Predicted value in the Cycle Status list is there for you to pencil in a cycle you expect – the sheet does not create predicted rows for you.
Best Practices
Keep the rows in date order, oldest at the top. Cycle Length reads the row above it, so a row inserted out of sequence produces a length that means nothing. Add the row when the period starts rather than when it ends, set the status to Ongoing, and come back for the end date – that way Cycle Progress stays meaningful during the month. Put anything unusual in Notes while you still remember it; a five-word note is worth more later than an accurate symptom dropdown. And extend the List tab early. The lists are deliberately short, and a symptom you record every month deserves its own dropdown entry rather than living in the Notes column.
Explore Relevant Templates
- Symptom & Pain Diary Tracker in Google Sheets – a day-by-day symptom and pain log, where this one records once per cycle.
- Mood & Mental Health Tracker in Google Sheets – daily mood, where this template captures one mood per cycle.
- Medication & Pill Tracker in Google Sheets – what you take and when.
- Doctor Appointments & Medical History Tracker in Google Sheets – visits, notes and follow-ups.
- Lab Results & Health Metrics Tracker in Google Sheets – results and measurements over time.
If you would like to learn how a tracker like this is put together, the NextGenTemplates Academy learning paths cover the spreadsheet skills involved, with practice files along the way.
Get the Period & Cycle Tracker in Google Sheets
Frequently Asked Questions
Is the Period & Cycle Tracker a medical or diagnostic tool?
No. It is a personal record-keeping spreadsheet. It does not diagnose, screen, treat or monitor any condition, and nothing in it replaces a conversation with a qualified healthcare professional.
Can I use the Est. Ovulation column for contraception or to plan a pregnancy?
No. It is a date derived by simple arithmetic from your own average cycle length. It is not a fertility test, not a fertile-window prediction, and must not be relied on either to avoid or to achieve a pregnancy. Speak to a healthcare professional about either.
How does it work out my next period date?
Next Period (Est.) adds your own average cycle length to the current Period Start date. The estimate moves as your average moves, and it cannot account for anything that changes a cycle.
Which columns calculate automatically?
Seven: Cycle ID, Period Length (Days), Cycle Length (Days), Est. Ovulation, Next Period (Est.), Regularity and Cycle Progress. You type the other eight.
Will it remind me to log a cycle?
No. There are no reminders, alerts or notifications anywhere in the file. It is a log you open and update.
Can I add my own symptoms, moods and flow levels?
Yes. The List tab drives every dropdown from rows 2 to 500. Type a value in the right column and it appears in the dropdown straight away.
Who can see what I log?
Only the people you choose to share your copy with. After File > Make a copy, the sheet sits in your own Google Drive under your account – ordinary Drive storage, not encrypted or compliance-grade storage.
About the Author
Built by PK – Microsoft Certified Professional with 15+ years of Excel, Google Sheets, and Power BI experience. Founder of NextGenTemplates, reaching 300K+ subscribers across YouTube channels. Every template is hand-built and tested before release.
Conclusion
The Period & Cycle Tracker in Google Sheets is a small, honest tool: sixteen columns, seven of them automatic, one summary card and four charts, in a file that lives in your Drive and nowhere else. It will not predict anything it cannot calculate, it will not remind you, and it will not tell you what your numbers mean. What it will do is turn a year of scattered dates into one readable table you can open, sort, and take to an appointment.
Get the Period & Cycle Tracker in Google Sheets – one payment, instant download, and a PDF with the Google Sheets copy link inside.
For more Google Sheets walkthroughs, subscribe to NeoTechNavigators on YouTube.
This template is a personal record-keeping tool. It is not a medical device, it is not medical advice, and it is not a contraceptive or fertility method. Please speak to a qualified healthcare professional about anything that concerns you.