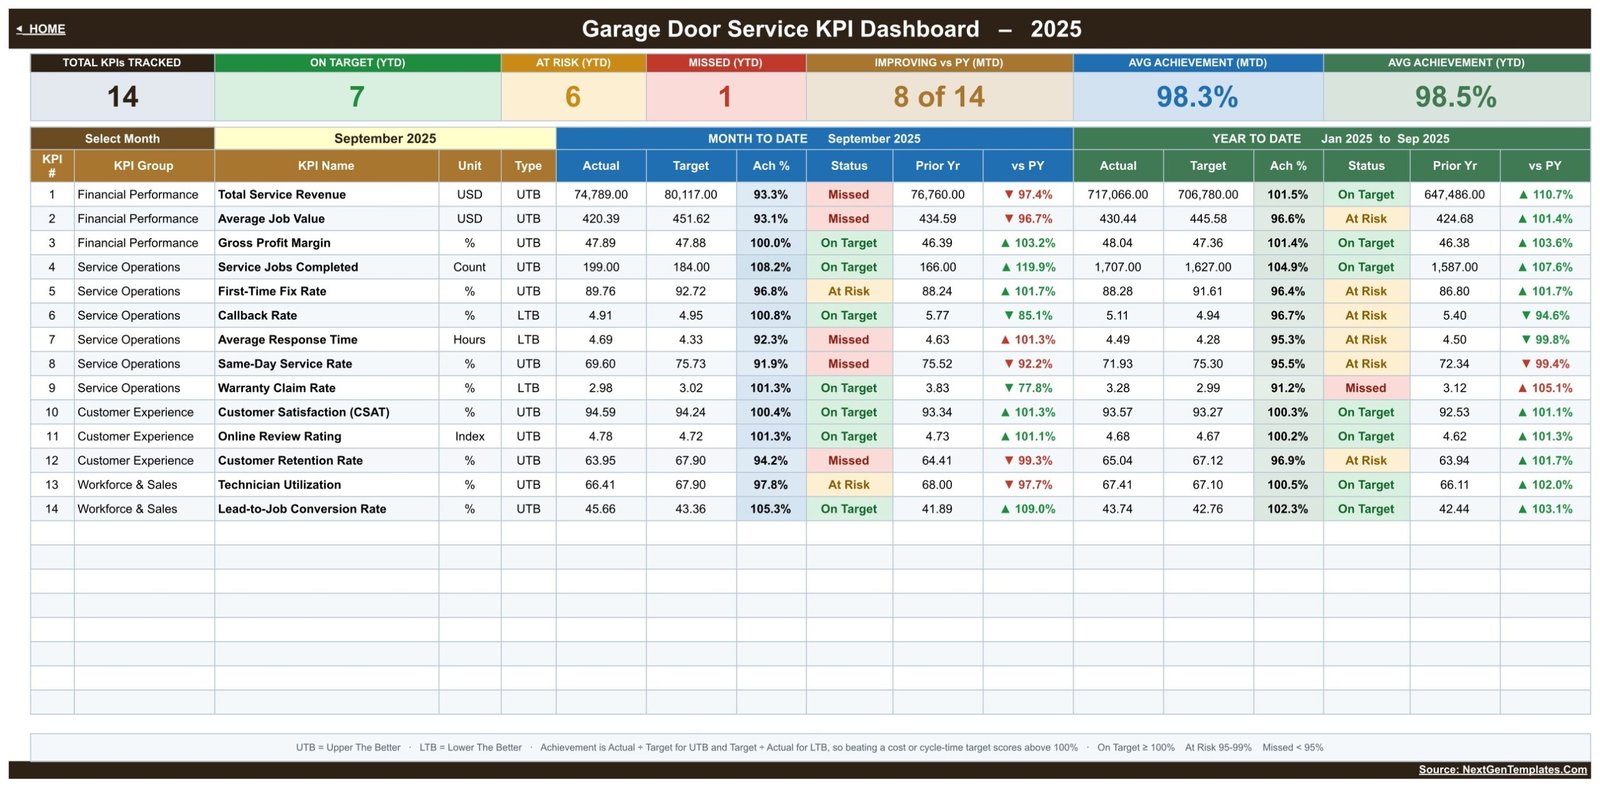
A garage door company can be fully booked and still lose money quietly – a callback rate creeping up, a response time slipping past four hours, a margin sliding while revenue looks fine. The Garage Door Service KPI Dashboard in Google Sheets turns 14 monthly KPIs into a single review system: 4 groups, 12 months, MTD and YTD views, target and prior-year comparison, a trend page, and a top and bottom five analysis. The supplied September 2025 sample contains 7 On Target, 6 At Risk, and 1 Missed YTD KPI, with 98.5% average YTD achievement. Those figures are sample data, not a benchmark for the garage door trade.Garage Door Service KPI Dashboard in Google Sheets
This is the KPI Dashboard family: a 14-row scorecard driven by a month picker, plus dedicated Trend and Analysis pages. It is a different product from the published Garage Door Service KPI Scorecard in Google Sheets, which is a 10-KPI card-based template for the same trade. Same industry, different structure – worth knowing before you pick one.
Key Features of the Garage Door Service KPI Dashboard in Google Sheets
14 KPIs across four management groups
The supplied register covers Financial Performance (Total Service Revenue, Average Job Value, Gross Profit Margin), Service Operations (Service Jobs Completed, First-Time Fix Rate, Callback Rate, Average Response Time, Same-Day Service Rate, Warranty Claim Rate), Customer Experience (Customer Satisfaction (CSAT), Online Review Rating, Customer Retention Rate) and Workforce & Sales (Technician Utilization, Lead-to-Job Conversion Rate). Service Operations is deliberately the largest group with six metrics, because that is where a door and opener business usually leaks time.Garage Door Service KPI Dashboard in Google Sheets
Direction-aware achievement and traffic lights
Eleven KPIs are UTB, or upper the better. Three are LTB, or lower the better: Callback Rate, Average Response Time, and Warranty Claim Rate. Achievement is Actual divided by Target for UTB metrics and Target divided by Actual for LTB metrics, so beating a callback or response-time target scores above 100% instead of being flagged as a failure. The thresholds are plain: On Target from 100%, At Risk 95% to 99%, Missed below 95%, and they sit in editable Status formulas rather than a hidden script.Garage Door Service KPI Dashboard in Google Sheets
One month picker, two reporting horizons
Choose a month from the dropdown and the whole workbook follows it. Every KPI row shows Month to Date actual, target, achievement, status, prior-year value and change, then the same six fields again for Year to Date. There is no refresh step, no query to run, and no add-on to authorise.
Dashboard Pages Explanation
1. Home
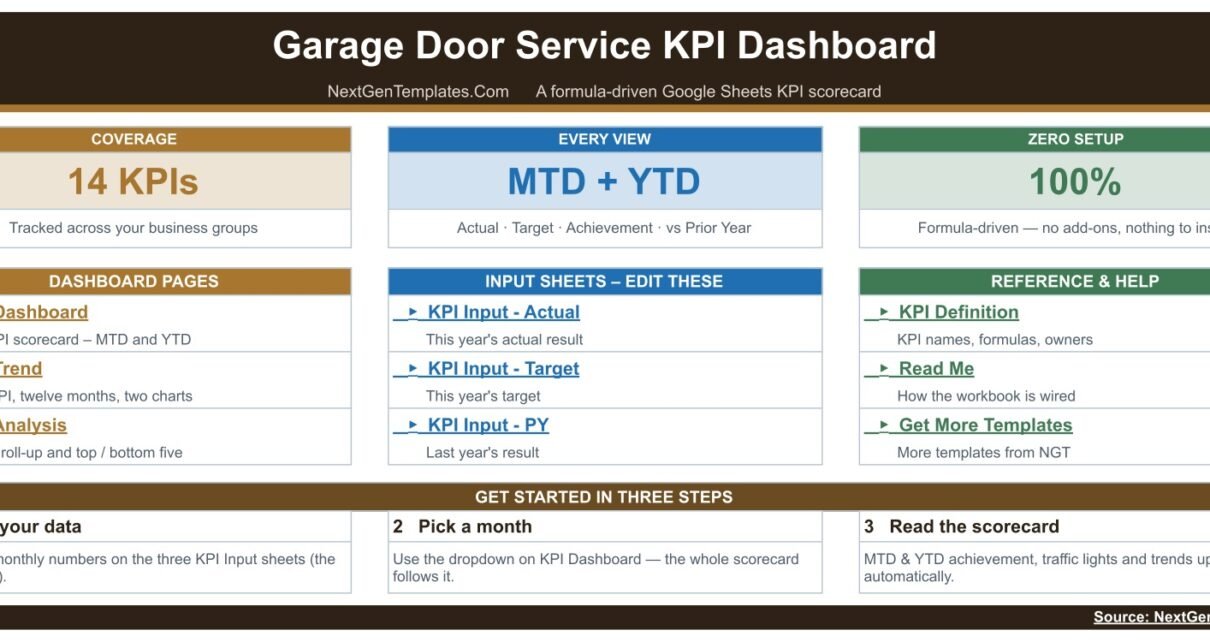
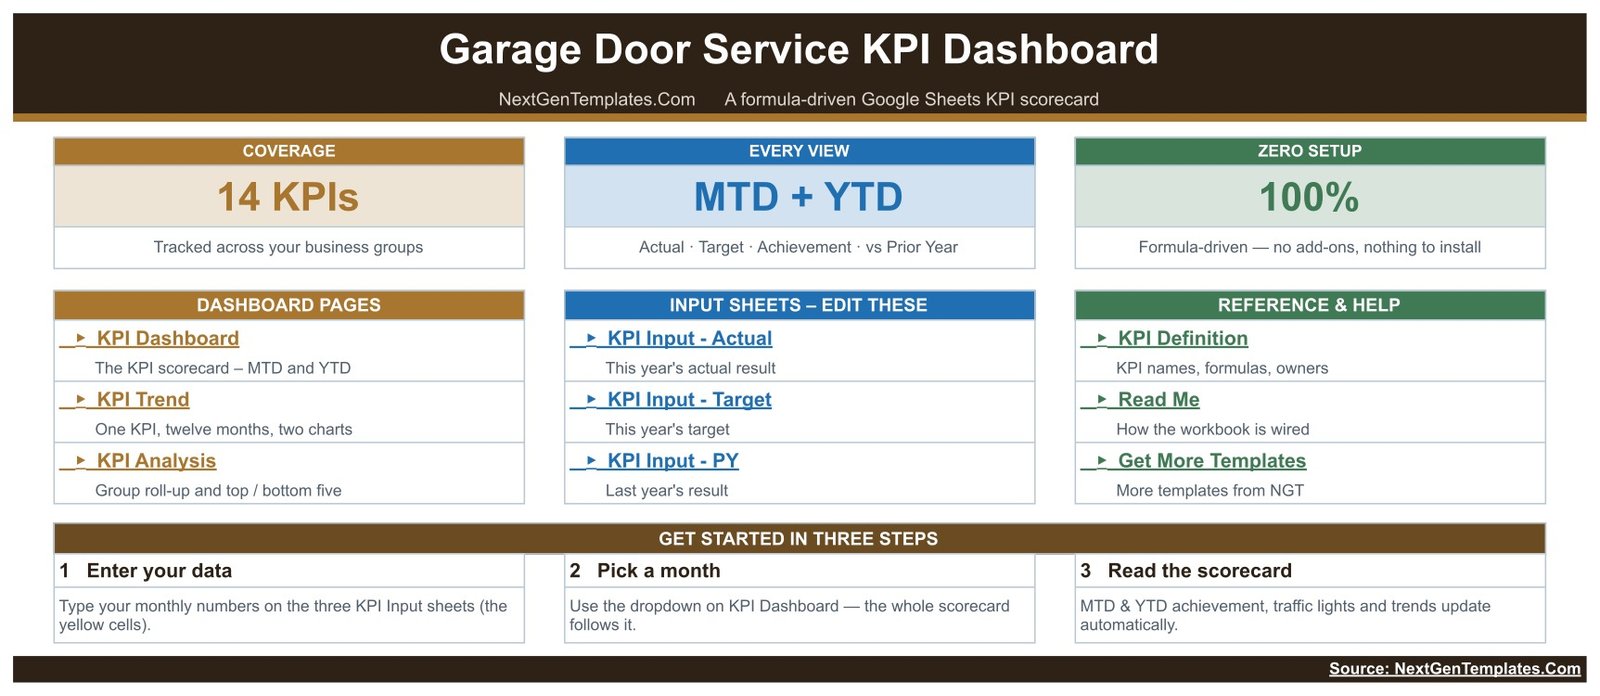
The index states the structure before you start: 14 KPIs, MTD plus YTD, three editable input sheets, and “formula-driven – no add-ons, nothing to install”. Navigation links open KPI Dashboard, KPI Trend, KPI Analysis, the three KPI Input sheets, KPI Definition, Read Me, and Get More Templates. A three-step Get Started strip explains the whole workflow in one screen: enter your data, pick a month, read the scorecard.
2. KPI Dashboard
The main page puts all 14 KPIs in one table with seven summary cards above it – KPIs tracked, On Target, At Risk, Missed, improving versus prior year, and average achievement for MTD and YTD. In the sample month the cards read 14 tracked, 7 On Target, 6 At Risk, 1 Missed, 8 of 14 improving on prior year, 98.3% average MTD achievement and 98.5% average YTD achievement.Garage Door Service KPI Dashboard in Google Sheets
3. KPI Trend
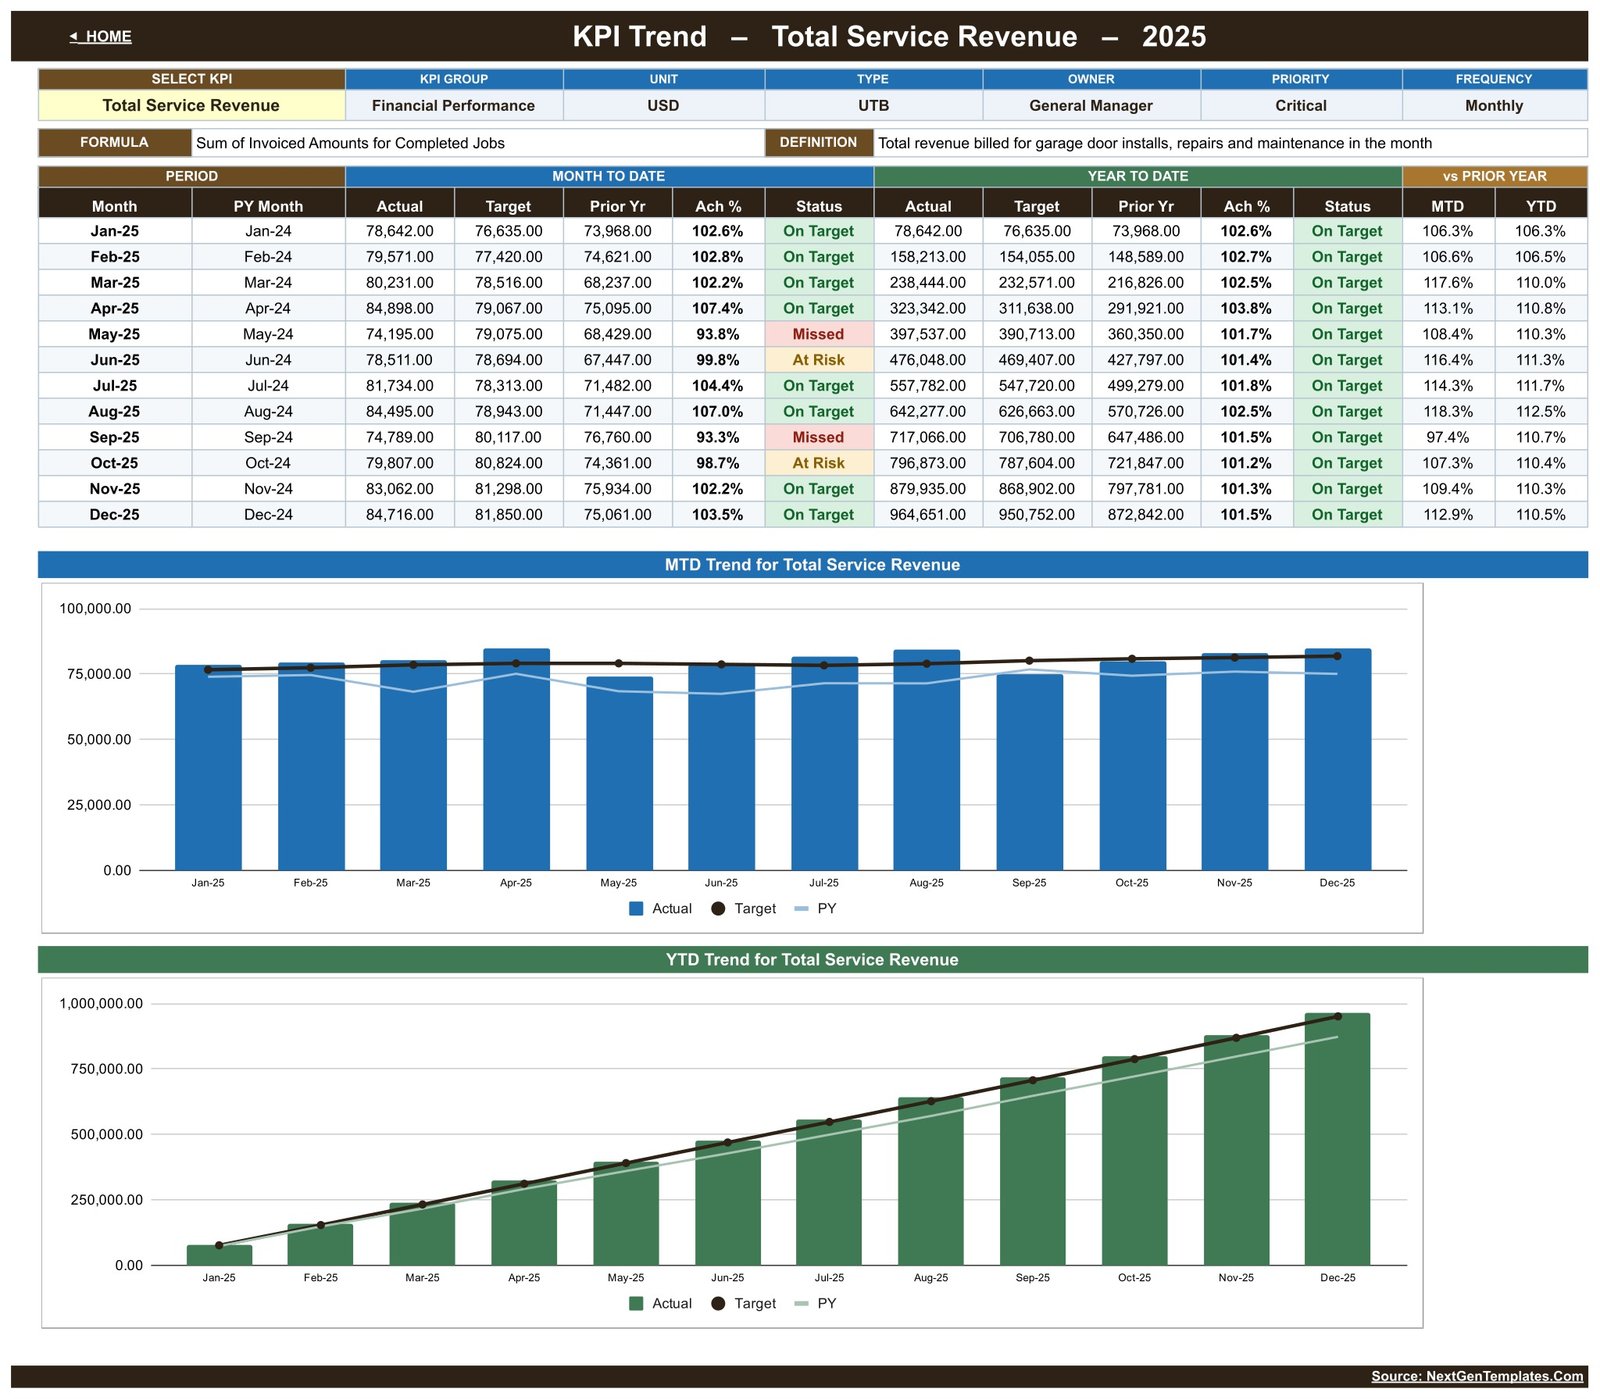
Select one metric and the page shows its group, unit, type, owner, priority, frequency, written formula, and definition. A twelve-row table follows with MTD and YTD Actual, Target, Prior Year, achievement, and status, then two charts: MTD Trend and YTD Trend, each plotting Actual against Target and Prior Year.Garage Door Service KPI Dashboard in Google Sheets
4. KPI Analysis
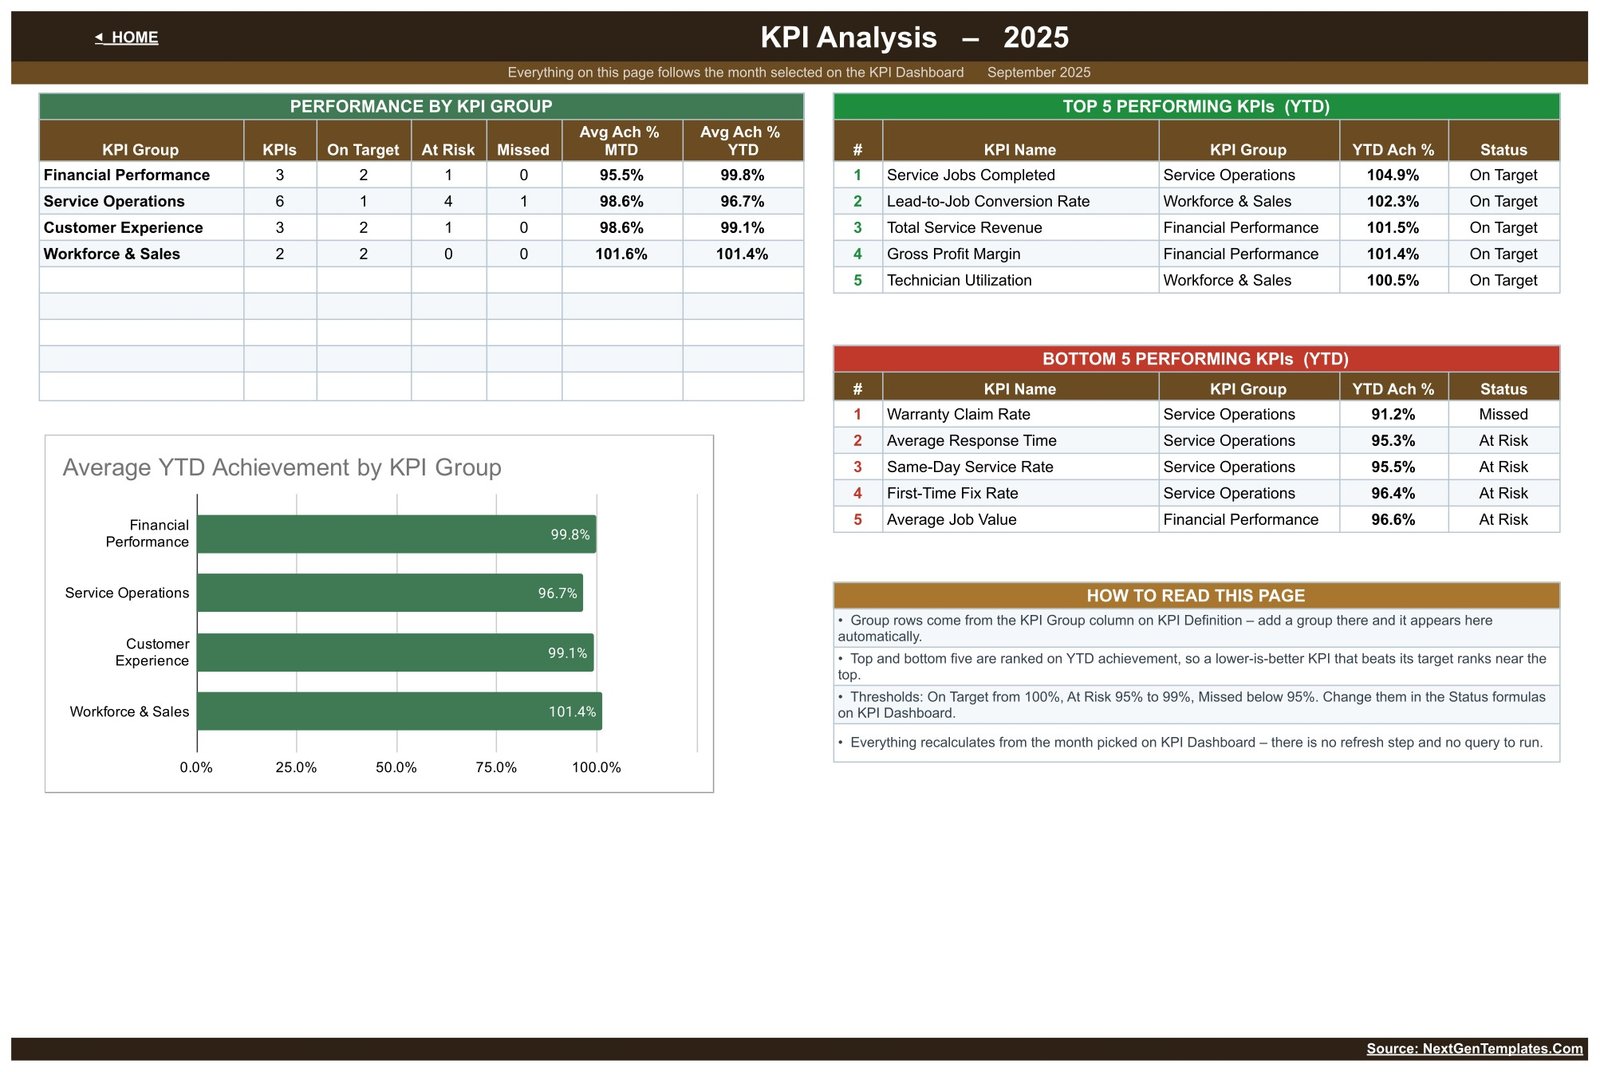
The analysis page rolls the register up into its four groups, counts On Target, At Risk, and Missed in each, charts average YTD achievement by group, and lists the top and bottom five YTD performers. In the sample, Workforce & Sales leads on 101.4% and Service Operations trails on 96.7% – which is exactly the kind of one-line answer a monthly meeting needs before it argues about individual jobs.Garage Door Service KPI Dashboard in Google Sheets
5. Actual, Target, and PY input sheets
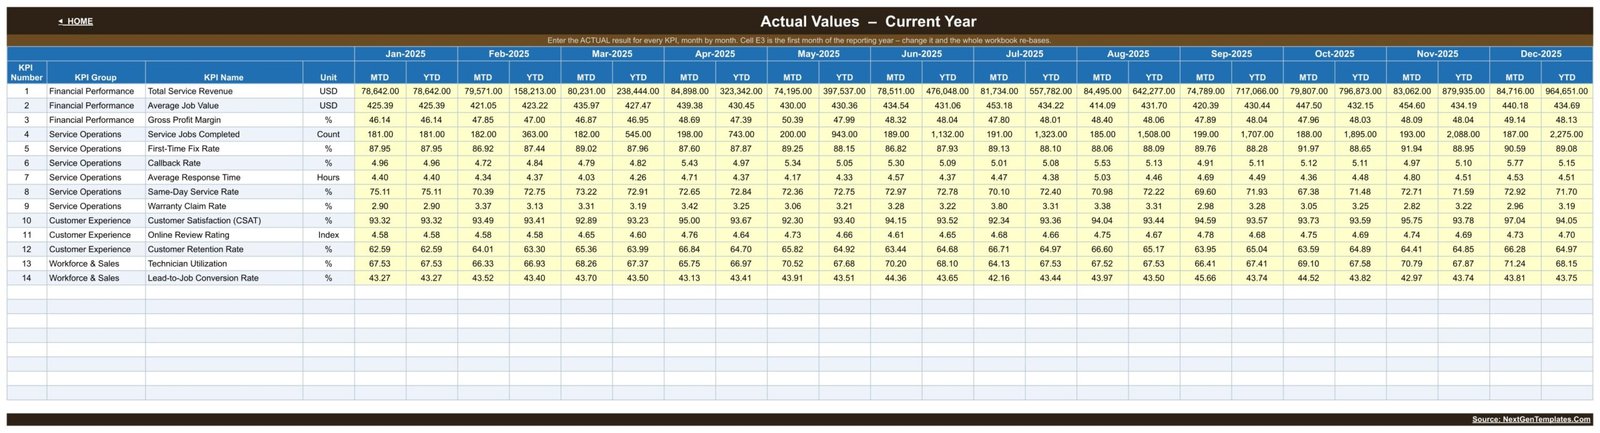
These three tables are the data-entry layer. Each holds the 14 KPIs from January to December with MTD and YTD columns. Type or paste your monthly summaries into the yellow cells and every reporting page updates through formulas.
6. KPI Definition
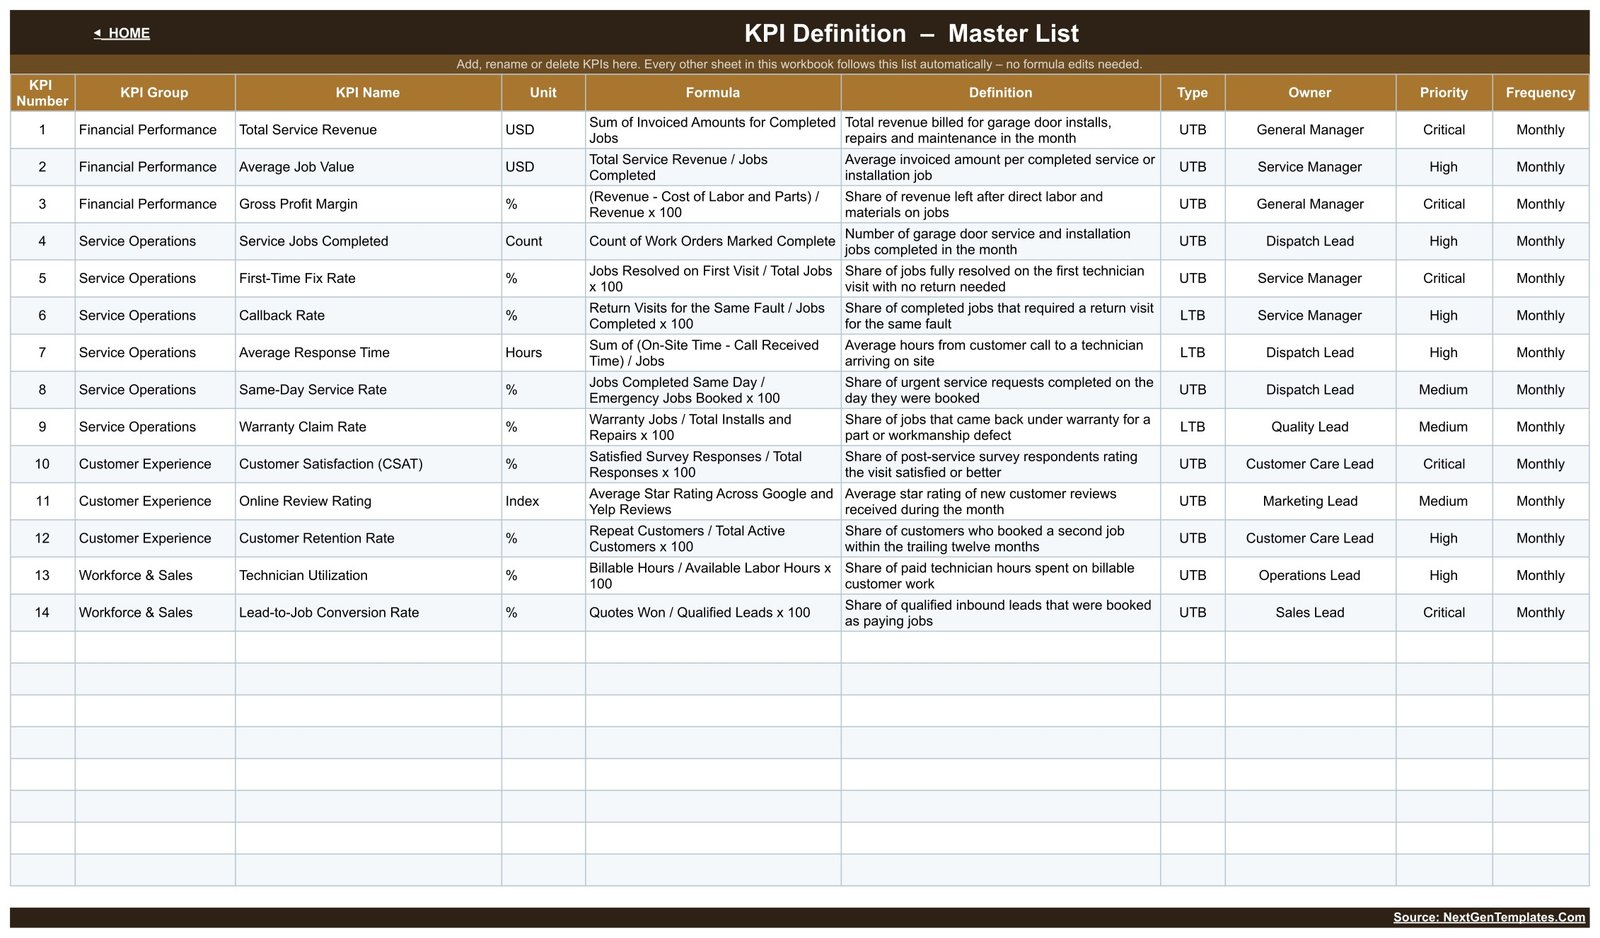
The master register gives each metric a group, unit, written formula, plain-language definition, UTB or LTB direction, owner, priority, and monthly frequency. Owners are named – General Manager, Service Manager, Dispatch Lead, Quality Lead, Customer Care Lead, Marketing Lead, Operations Lead, Sales Lead – so no row is anonymous. This page matters because it stops two managers using different definitions for the same number.Garage Door Service KPI Dashboard in Google Sheets
Garage Door Service KPI Dashboard in Google Sheets vs. Excel vs. Paid Field Service SaaS – Feature Comparison
| Area | This template | Excel alternative | Paid field service SaaS |
|---|---|---|---|
| Price | $8.99 one time | Template plus Microsoft 365 if needed | Recurring, often per user |
| Platform | Google Sheets in browser or app | Excel desktop or web | Vendor web and mobile apps |
| Collaboration | Native sharing and permissions | Best through OneDrive | Native, usually seat-based |
| Setup time | Copy the sheet, replace monthly values | Download and edit locally | Configuration and onboarding |
| Editing KPI definitions | Visible cells on one register page | Editable workbook | Depends on vendor plan |
| Dispatch, work orders, invoicing | No | No | Usually yes |
| Job-level door and opener records | No – monthly summary only | Depends on workbook | Usually yes |
Who Should Use This Template
Garage door company owners, service managers, dispatch leads, quality leads, and marketing or sales leads who already assemble monthly totals and want one board everyone reads the same way. It fits a single-crew installer as easily as a multi-van operation, and it suits a company that would rather share one Google Sheet than buy another per-seat subscription. If you currently email a spreadsheet of totals around before each monthly meeting, this replaces that habit with a fixed structure.
Real-World Use Cases
Dan, a service manager, reads First-Time Fix Rate, Callback Rate, and Warranty Claim Rate on one screen before deciding whether a repeated spring or opener fault is a training problem or a parts problem.Garage Door Service KPI Dashboard in Google Sheets
Priya, a dispatch lead, watches Average Response Time and Same-Day Service Rate against Service Jobs Completed to judge whether an extra van would pay for itself next quarter.Garage Door Service KPI Dashboard in Google Sheets
Marcus, an owner, compares Gross Profit Margin, Average Job Value, Lead-to-Job Conversion Rate, and Technician Utilization before changing pricing or hiring plans.
Advantages of the Garage Door Service KPI Dashboard in Google Sheets
- Clear structure: one definition register, three input tables, three reporting pages.
- No black box: formulas, thresholds, and KPI definitions all stay visible and editable.
- Two benchmarks at once: every KPI is measured against plan and against last year.
- Correct maths for cost metrics: LTB handling means a lower callback rate reads as a win, not a miss.
- Named accountability: each KPI carries an owner, a priority, and a frequency.
- No recurring fee: one-time payment, no per-user charge, no subscription.
Opportunities for Improvement
- Manual input: there is no connection to dispatch, CRM, accounting, or scheduling systems.
- Monthly grain: it does not drill down to an individual job, address, van, technician, or day.
- Summary warranty measure: Warranty Claim Rate is one entered percentage; no claim records, part numbers, or manufacturer correspondence are stored.
- Fixed starting structure: 14 supplied rows and four groups are ready to edit, but expanding well beyond the designed area may need formula changes.
- No alerts: red, amber, and green are visual statuses inside the workbook, not emails or push notifications.
Best Practices
- Agree every KPI definition with the team before the first monthly review.
- Set the UTB or LTB direction deliberately whenever you replace a metric – it is the single easiest thing to get backwards.
- Keep the KPI names identical across the definition page and all three input sheets so the lookups keep matching.
- Archive the source report behind each monthly summary so any number can be audited later.
- Give readers view-only access and reserve edit rights for the people who own the inputs.
- Read the status column first, the trend second, and the underlying job data third.
- For lookup fundamentals in Google Sheets, see Google’s official VLOOKUP guidance.
Explore Relevant Templates
- Garage Door Service KPI Scorecard walkthrough – the 10-KPI scorecard for the same trade, so you can compare the two families before buying.
- Swimming Pool Service KPI Dashboard walkthrough – the same dashboard structure applied to a route-service business.
- Septic Tank Service KPI Dashboard walkthrough – another field-service dashboard in this family.
- Locksmith Business KPI Scorecard walkthrough – a published trade-service scorecard.
- Browse Google Sheets KPI Dashboards.
Frequently Asked Questions
Is this a KPI Dashboard or a KPI Scorecard?
A KPI Dashboard. It has 14 KPI rows plus separate Trend and Analysis pages and three monthly input sheets. The scorecard is a different product built from 10 KPI cards.
Do I need a paid Google Workspace account?
No. A free Google account can copy, edit, and share it.
Can I add my own KPIs?
Yes. You can replace the supplied names, definitions, units, written formulas, owners, priorities, frequencies, and directions. Keep matching names aligned across the tables.
Are the displayed results garage door industry benchmarks?
No. Every number in the workbook is sample data included to demonstrate the formulas and layouts.
Does it track individual jobs, vans, or technicians?
No. The grain is one company-level value per KPI per month. There is no job history, customer record, part number, or timesheet in the workbook.
Will it import my job data automatically?
No. You enter monthly summary values manually. There is no API, connector, or add-on.
How do I receive the template?
The download is a PDF containing the link used to make your own Google Sheets copy.
About the Author
Built by PK – Microsoft Certified Professional with 15+ years of Excel, Google Sheets, and Power BI experience. Founder of NextGenTemplates, reaching 300K+ subscribers across YouTube channels. Every template is hand-built and tested before release.
Conclusion
The most useful monthly dashboard is not the one with the most charts; it is the one a manager can define, update, read, and argue with consistently. This workbook fixes the review around 14 garage door service KPIs while keeping every input, threshold, and definition visible. If your current process is a pile of emailed totals and an ad hoc spreadsheet, the Garage Door Service KPI Dashboard in Google Sheets gives those numbers a repeatable home.
Get the Garage Door Service KPI Dashboard in Google Sheets for $8.99 – one-time payment, no subscription. For more walkthroughs, visit PK An Excel Expert on YouTube.