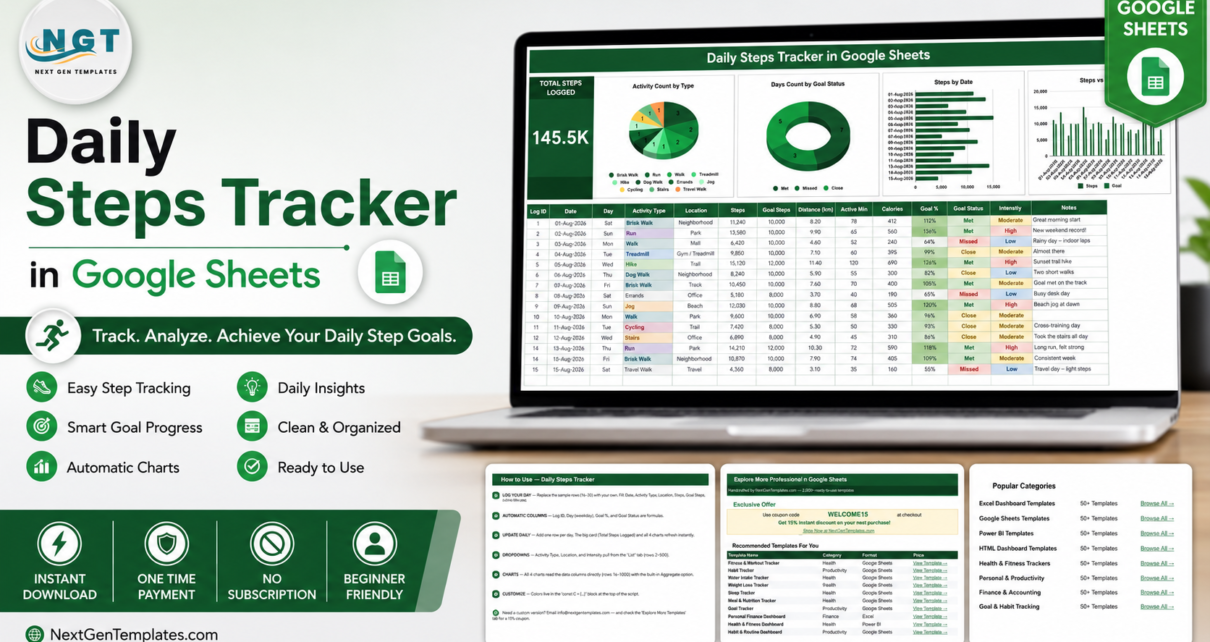
A walking habit dies in the gap between the number on your phone and any record of it. You glance at 9,600 steps, feel vaguely fine about it, and by Thursday you could not say whether this week beat last week. The Daily Steps Tracker in Google Sheets closes that gap with one row a day: eight values you type, four that calculate themselves, and a screen that redraws the moment you hit Enter.
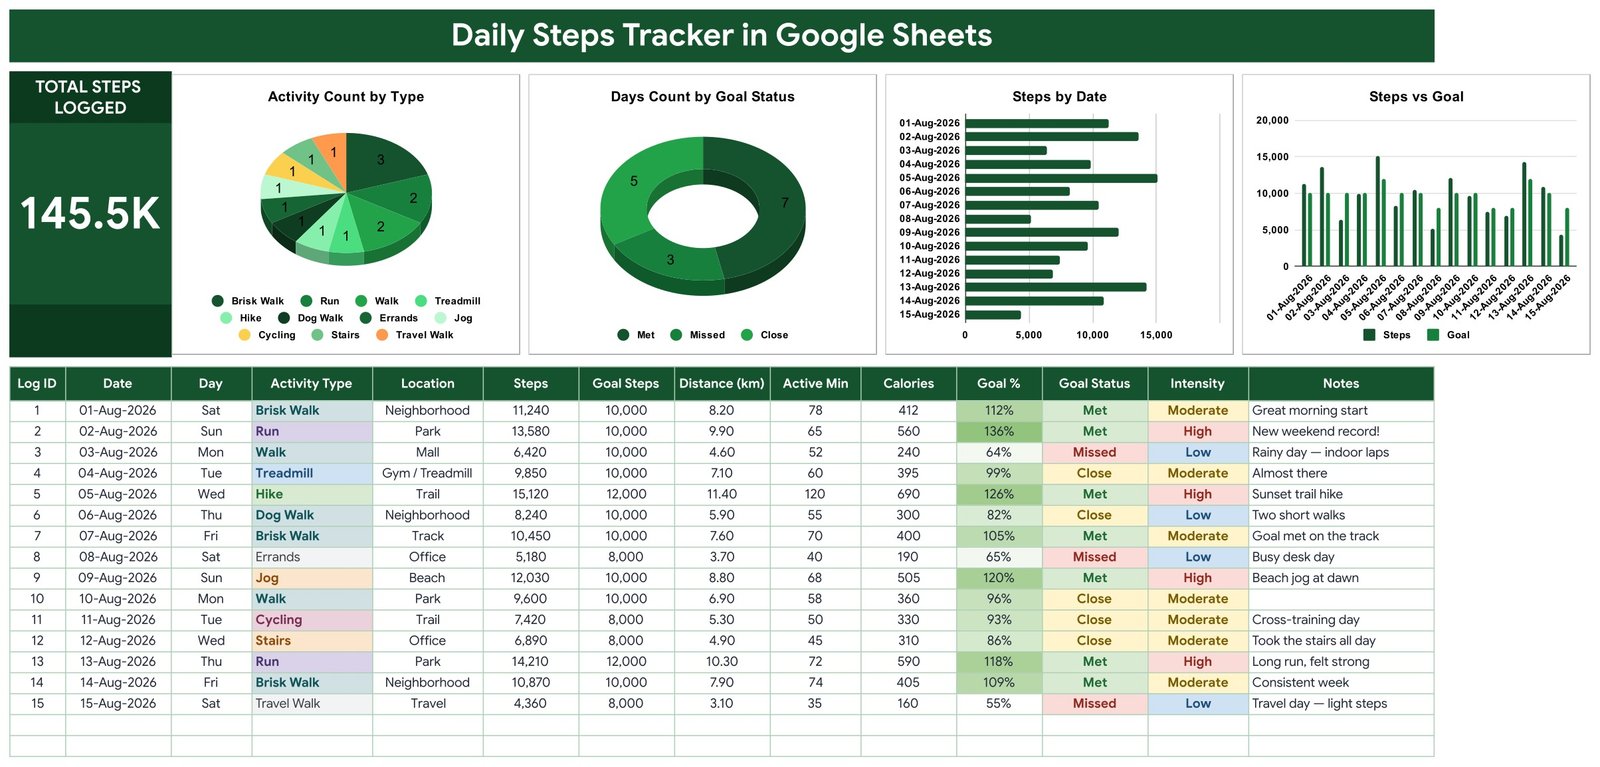
The sample file ships with 15 logged days, 145,500 total steps and 11 activity types – Brisk Walk, Run, Walk, Treadmill, Hike, Dog Walk, Errands, Jog, Cycling, Stairs and Travel Walk. Seven of those days landed on Met, five on Close and three on Missed, against goals ranging from 8,000 to 12,000 that the sample user set themselves. It is a full, working month you can read before you clear a single cell.
One thing to be clear about up front: this is a logging and charting template. It records numbers you type in. It is not medical advice, it does not assess anyone’s health, and it does not tell you what your step goal should be – you type that in yourself.
Get the Daily Steps Tracker in Google Sheets
Key Features of the Daily Steps Tracker in Google Sheets
- Fourteen columns, one row a day. Log ID, Date, Day, Activity Type, Location, Steps, Goal Steps, Distance (km), Active Min, Calories, Goal %, Goal Status, Intensity and Notes.
- Four automatic columns. Log ID numbers itself, Day resolves the weekday from your date, Goal % divides Steps by Goal Steps, and Goal Status turns that percentage into a word.
- Goal Status thresholds you can read. Met at 100% and above, Close from 80%, Missed below – each colour-coded green, amber or red so a month scans in two seconds.
- A single KPI card. Total Steps Logged, sitting left of the charts, reading 145.5K in the sample.
- Four charts fed directly by the table. No pivot tables, no helper columns, no hidden support sheet.
- Three dropdown vocabularies for Activity Type, Location and Intensity, each backed by a List tab with room for 500 values.
- Chip-style dropdowns – the coloured pills in the screenshots – enabled with a one-time 10-second setting.
- Room for roughly 2.5 years of daily entries before you touch a range.
Sheet-by-Sheet Explanation
The tracker sheet
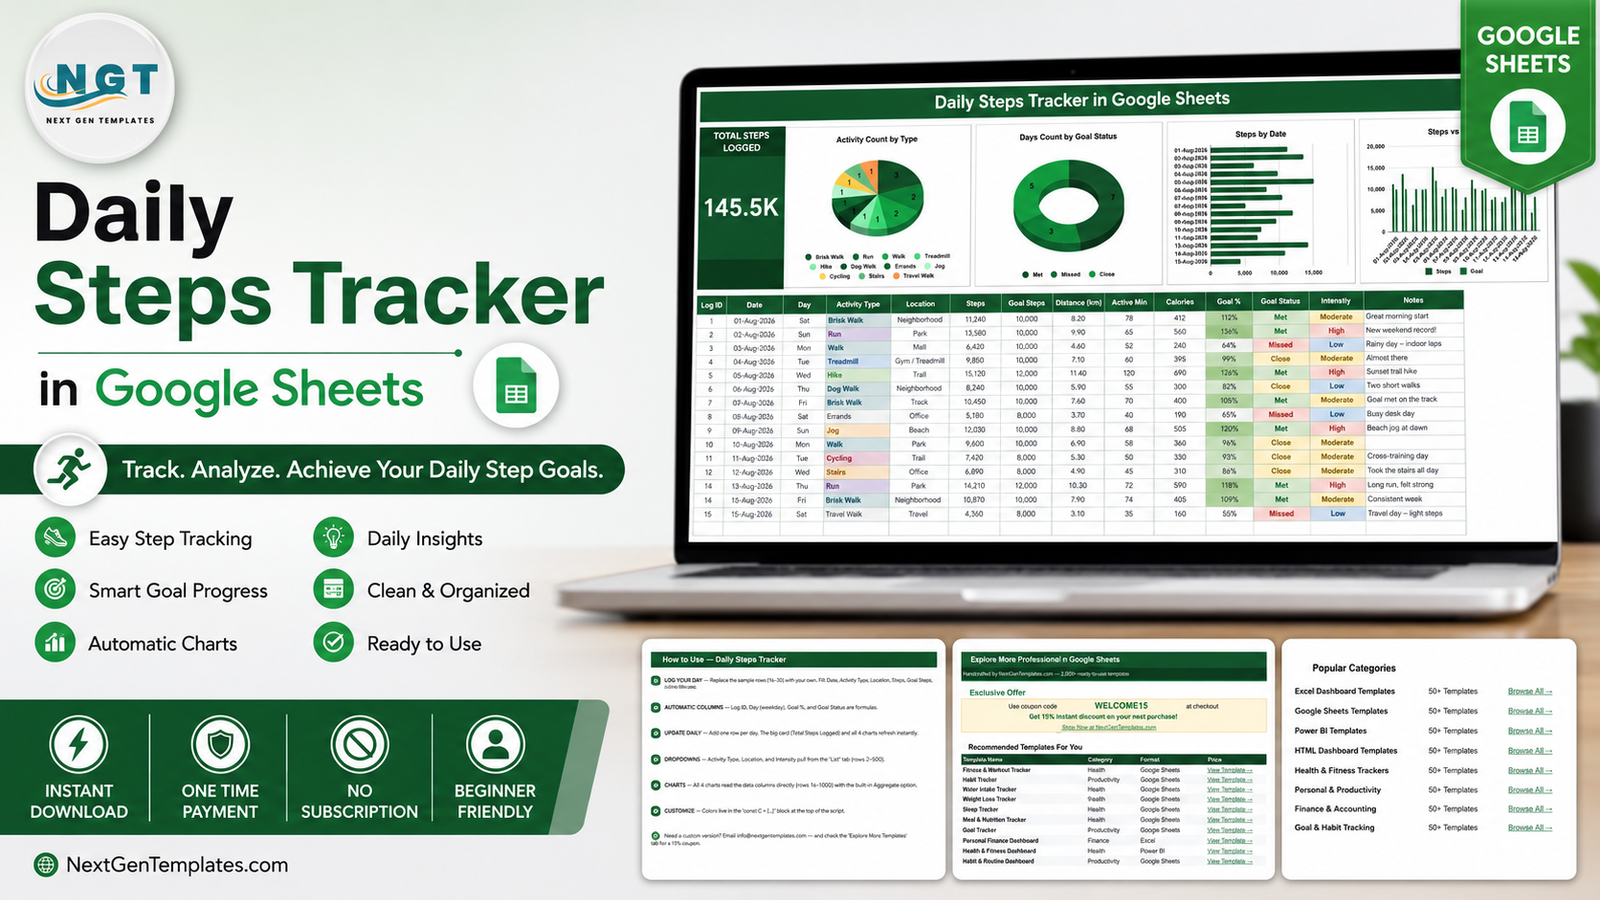
This is the product. A dark green banner across the top, the Total Steps Logged card at far left, four charts in a row beside it, and the log table starting at row 16 directly underneath. Everything is visible at once – no tab-hopping to find out how the month is going.
Activity Count by Type
A pie of how many logged days belong to each activity. The sample shows Brisk Walk on 3 days, Run and Walk on 2 each, and single days for Treadmill, Hike, Dog Walk, Errands, Jog, Cycling, Stairs and Travel Walk. It answers the question most step counters cannot: what kind of walking is this, actually?
Days Count by Goal Status
A donut splitting logged days three ways – 7 Met, 5 Close, 3 Missed in the sample. The Close slice is the interesting one, because it is the days that came within 20% of the goal you set and are the easiest to convert.
Steps by Date
One horizontal bar per calendar date, 01-Aug through 15-Aug in the sample. Dated rather than aggregated, which means an unlogged day shows up as a missing bar instead of quietly disappearing into an average.
Steps vs Goal
Paired columns: the steps you logged next to the goal you set for that exact day. The 15,120-step hike on 05-Aug towers over its 12,000 goal; the 4,360-step travel day on 15-Aug sits well under its 8,000. This is the chart that makes a pattern obvious.
The How to Use sheet
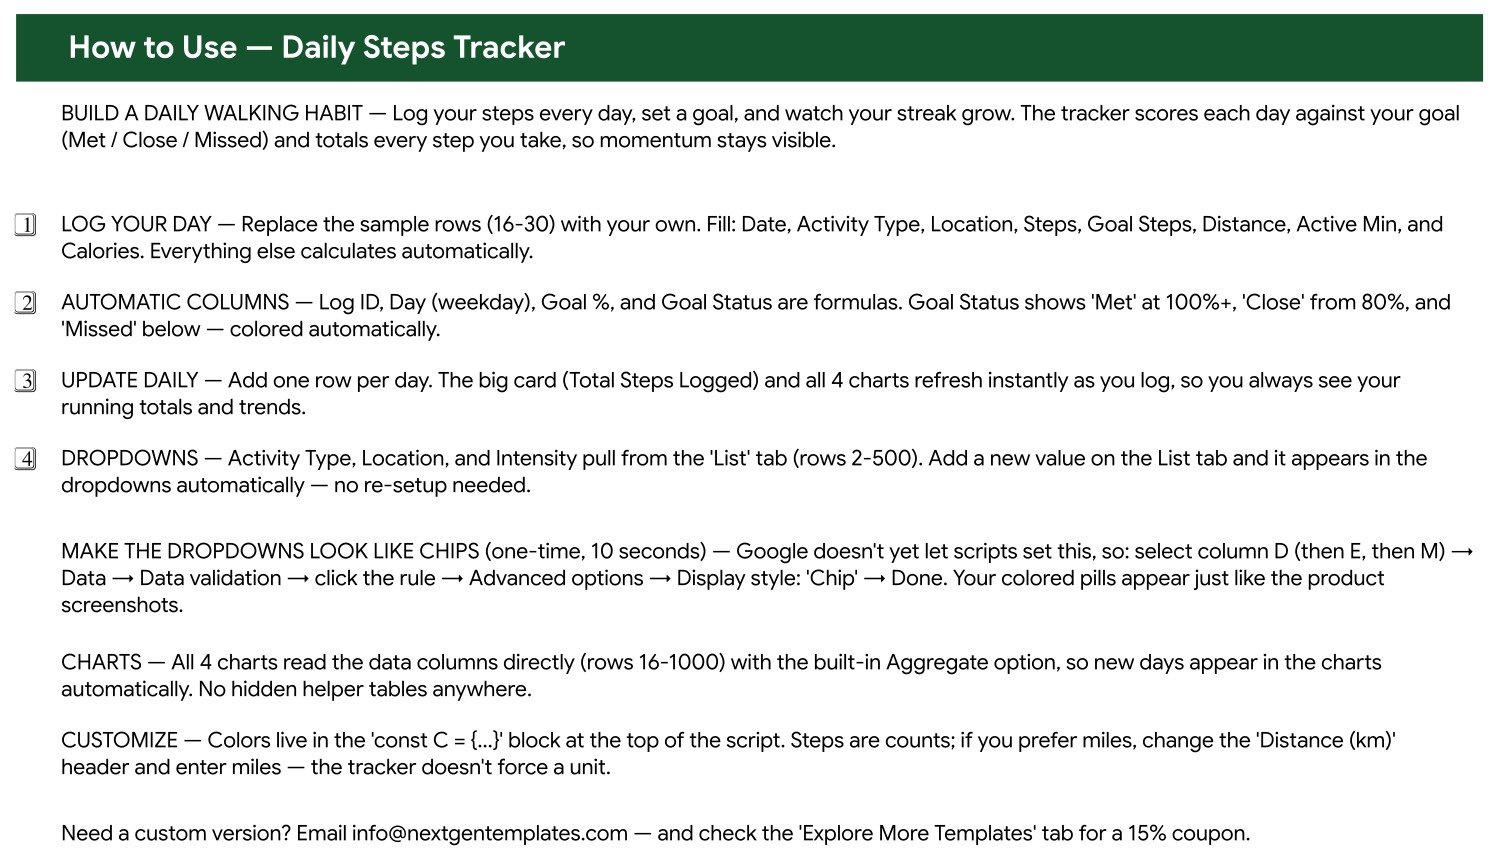
A plain-English guide built into the file. It covers which rows are sample data (16 to 30), which four columns are formulas, how the Met / Close / Missed thresholds work, how the List tab feeds the dropdowns, and the exact click path to switch dropdowns to chip display. It also notes that the charts read rows 16 to 1000 with the built-in Aggregate option, and that the colour palette lives in one const block.
The List sheet
Three columns of dropdown values – the sample ships Neighborhood, Park, Mall, Gym / Treadmill, Trail, Track, Office, Beach and Travel as Locations, and Low / Moderate / High as Intensity. Add a value here and it is in the dropdown immediately, because the validation rules read the whole 500-row range rather than a fixed list.
The Explore More Templates sheet
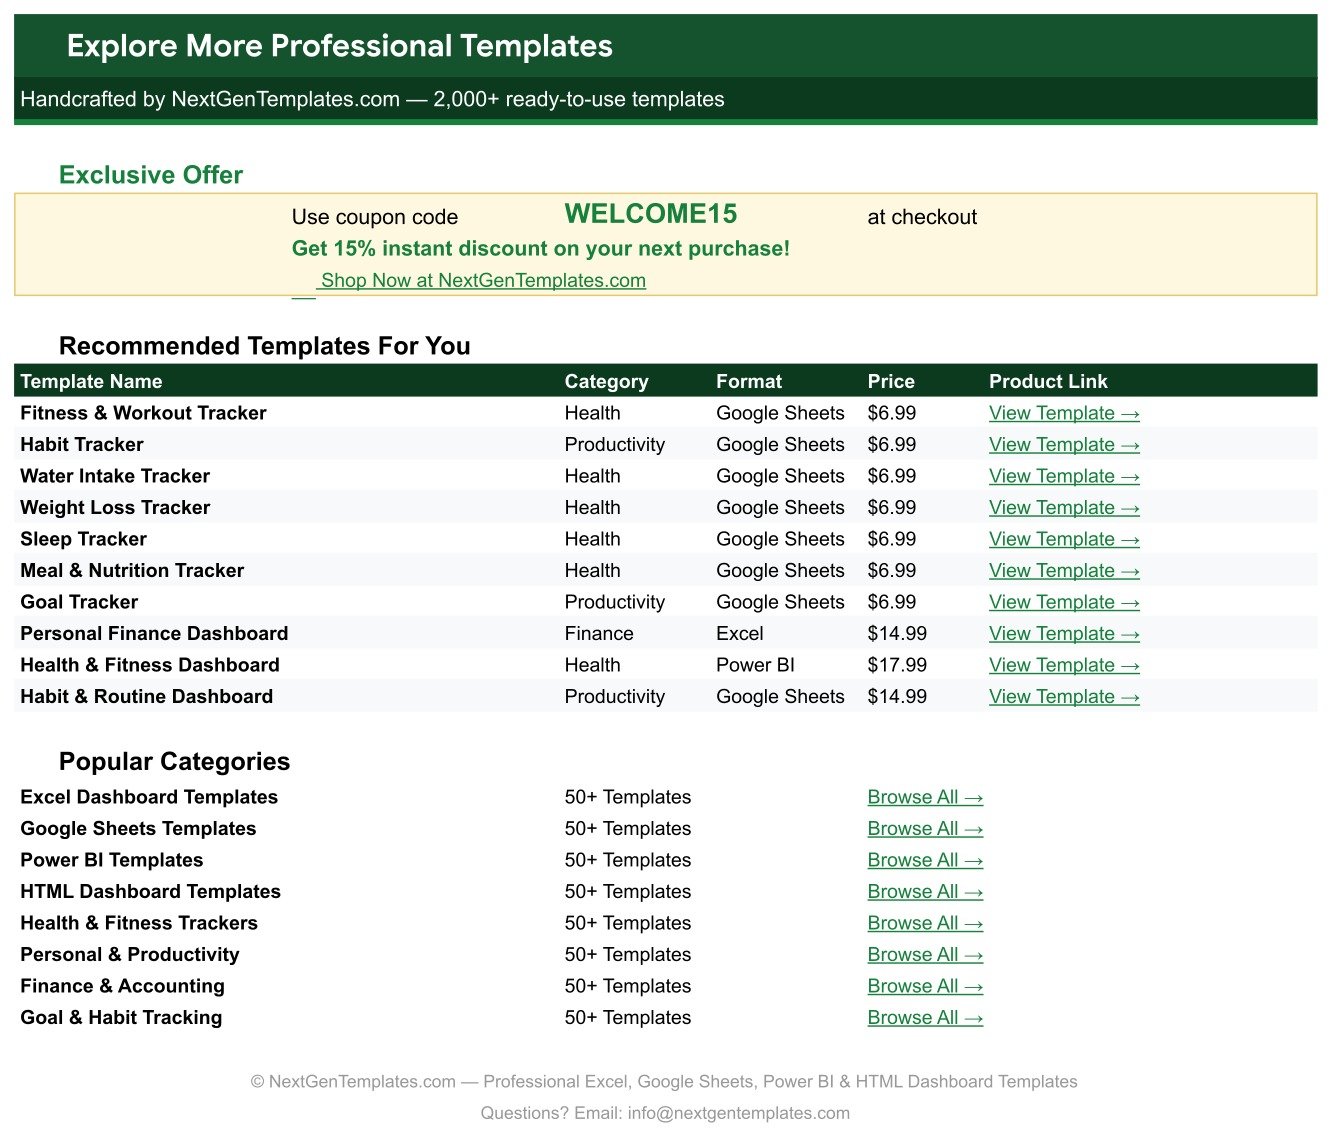
A closing tab with a WELCOME15 coupon code and links through to related NextGenTemplates trackers and dashboards.
Daily Steps Tracker in Google Sheets vs. Excel vs. a Paid Fitness App – Feature Comparison
| Consideration | This template (Google Sheets) | Excel step log | Paid fitness app |
|---|---|---|---|
| Cost | $6.99 once | $6.99-$14.99 once, plus an Office licence | $5-$15 per month |
| Platform | Browser, Android, iOS | Desktop Excel, limited mobile editing | Phone app |
| Setup time | Under 5 minutes | 10-20 minutes | Minutes, account required |
| Real-time collaboration | Yes, share a link | OneDrive co-authoring only | Usually a paid social tier |
| Customisable fields | Yes – columns, headers, dropdowns | Yes | No, fixed schema |
| You own the raw data | Yes, your Drive file | Yes, your file | No, their servers |
| Year-1 cost, 5 people | $6.99 (one shared file) | $6.99 plus licences | $300-$900 |
| Automatic step counting | No – you type it | No | Yes, from the device sensor |
| Free-text notes per day | Yes, a Notes column | Yes | Rarely, and rarely exportable |
The trade is plain. An app counts for you; a sheet remembers for you. If you already have a device doing the counting, the sheet is where the number goes to become a record you can keep, sort, annotate and export.
Who Should Use This Template
Anyone who already reads a step count off a phone or watch and wants a durable record of it. That covers people building a walking routine and wanting the month visible in one screen, households sharing a single file, anyone who prefers a spreadsheet to an app’s timeline, and people who want context – location, intensity, a note about why Tuesday went wrong – attached to the raw number.
It is the wrong tool if you want the count captured automatically. There is no device sync, no Google Fit connection, no wearable integration. It is also not built for clinical or supervised records, and it will not tell you what your goal ought to be.
Real-World Use Cases
Building a lunchtime walking habit. Maria logs one row each evening from her phone’s count, types her own Goal Steps for the day, and checks Days Count by Goal Status at the end of the week. Seven Met out of fifteen logged days is a number she can act on; “I walked a fair bit” is not.
A household on one file. Dev and Anita added a Person column, shared the link, and read Steps by Date to spot the days they walked together. One file, one $6.99 purchase, no per-seat pricing.
Mixed activity, one log. Tom’s week runs trail hikes, treadmill sessions, dog walks and office stairs. Activity Count by Type separates them at a glance, and the Intensity dropdown lets him distinguish a 15,120-step hike from a 6,890-step day of taking the stairs.
Advantages of the Daily Steps Tracker in Google Sheets
- Nothing to maintain. The charts read the data columns directly with Google Sheets’ built-in Aggregate option, so there is no support sheet to break when you insert a row.
- Extensible by design. The dropdown ranges run to row 500 and the chart ranges to row 1000, so growing the file needs no re-setup.
- Honest about units. Distance (km) is a header, not a constraint – rename it and log miles.
- Portable data. It is already a spreadsheet. Export, pivot, mail it, or feed it into something else whenever you want.
- Works on a phone. The Google Sheets mobile app makes logging a walk a 20-second job.
- One-time cost. No renewal, no tier, no lock-in.
Opportunities for Improvement
Being straight about the limits:
- No device sync. Every number is typed. If manual entry is the thing you will not keep up, this template will not fix that.
- The chip display is a manual step. Google Sheets does not yet let a script set the chip display style, so the coloured pills in the screenshots need a one-time 10-second click path (Data, Data validation, the rule, Advanced options, Display style, Chip) on columns D, E and M. The Google Docs Editors Help page on data validation covers the same setting if you want the official reference.
- Calories are whatever you type. The sheet does not estimate them from steps, weight or pace – it stores the figure your device gave you.
- One person per file by default. Multi-person tracking works, but you add the Person column yourself and the charts then total everyone together unless you filter.
- No weekly or monthly roll-up. Everything is per-day. A pivot table on the same range takes about two minutes if you want week-over-week totals.
Best Practices
- Log at the same time daily. The template rewards consistency far more than precision – a missing day is a hole in Steps by Date that no chart can fill.
- Set Goal Steps per row, not once. Travel days and desk days can carry a different figure. The sample does exactly this, running 8,000 on some days and 12,000 on others.
- Use the Notes column. “Rainy day – indoor laps” is the difference between a number and a reason, six months later.
- Trim the dropdowns to your life. Delete the activity types you never do. A three-item dropdown gets used; an eleven-item one gets skipped.
- Keep the sample month somewhere. Duplicate the sheet before clearing rows 16-30, so you always have a working reference of what a filled file looks like.
- Watch the Close slice. On the Days Count by Goal Status donut, Close is the band of days that nearly hit whatever target you set – the most informative segment in the file.
Explore Relevant Templates
- Sleep Tracker in Google Sheets – the same one-page treatment for the other half of the day.
- Running Log & Mileage Tracker in Google Sheets – pace and mileage instead of step counts.
- Cycling Training Log Tracker in Google Sheets – for the rides the Cycling dropdown value only hints at.
- 30-Day Fitness Challenge Tracker in Google Sheets – a fixed-length grid rather than an open log.
- Fitness and Wellness Dashboard in Google Sheets – a multi-page dashboard for when one sheet is no longer enough.
Curious how trackers like this are put together? The NextGenTemplates Academy learning paths take you through the spreadsheet skills behind them, with practice files.
Get the Daily Steps Tracker in Google Sheets
Frequently Asked Questions
Is this medical or fitness advice?
No. It is a spreadsheet that stores numbers you type and charts them. It makes no health assessment, sets no target, and offers no recommendation. Any goal in the file is one you entered yourself.
Does it count steps automatically?
No. There is no wearable, phone or Google Fit connection. You read the count from whatever device you already use and type it into the Steps column.
What do I actually download?
A PDF containing a Make a Copy link. Click it and the Google Sheet copies into your own Drive, fully editable and yours to keep.
Can I log miles instead of kilometres?
Yes. Rename the Distance (km) header and type miles. The sheet stores the number as given and converts nothing.
How many rows can it hold?
Charts are wired to rows 16 through 1000 – about two and a half years of daily logging. Dropdown lists hold 500 values each.
Will a new activity type break the charts?
No. Add it on the List tab, it appears in the dropdown at once, and Activity Count by Type picks it up on your next entry.
Can two people share one file?
Yes – share the Google Sheet as you would any other. Add a Person column if you want to separate the entries, and filter before reading the charts.
About the Author
Built by PK – Microsoft Certified Professional with 15+ years of Excel, Google Sheets, and Power BI experience. Founder of NextGenTemplates, reaching 300K+ subscribers across YouTube channels. Every template is hand-built and tested before release.
Conclusion
The Daily Steps Tracker in Google Sheets does one job and does it on one screen: it takes the step count you already have and turns it into a record with shape. Fourteen columns, four automatic ones, one KPI card and four charts that redraw as you type – and a Notes column for the part no app captures. It costs $6.99 once, arrives as a Make a Copy link, and stays yours.
Remember what it is: a logging and charting tool for data you enter, not medical advice and not a health assessment.
Get the Daily Steps Tracker in Google Sheets for $6.99, or browse the full Google Sheets Trackers collection.
For video walkthroughs of this and other Google Sheets templates, subscribe to NeoTechNavigators on YouTube.