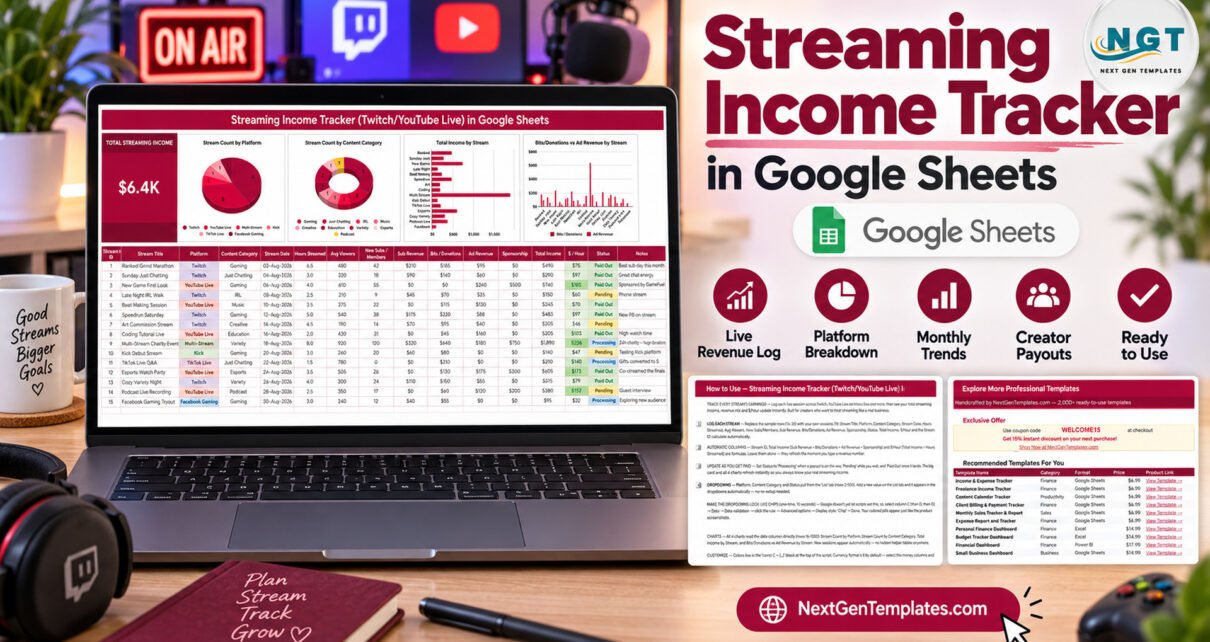
Most live streamers can tell you their follower count to the digit and have no idea what an hour on stream actually pays. The money arrives in at least four shapes — subscriptions, bits and donations, ad revenue and sponsorship fees — on at least two payout cycles, from at least two platforms, and none of those dashboards talk to each other. This streaming income tracker is a single Google Sheets page that puts all of it in one place: one Total Streaming Income card, four live charts, and a 16-column log that works out Total Income and $ / Hour for every session you run.
The template ships with 15 fully worked sample streams spanning six platforms and nine content categories, so you can see exactly how the maths behaves before replacing a single row with your own numbers. It runs in the browser, needs no macros and no add-ons, and you own your copy outright. Treat it as a Twitch income tracker, as a YouTube Live revenue tracker, or as one streaming income tracker in Google Sheets covering everywhere you go live — the sheet does not care which.
Get the Streaming Income Tracker
Key Features of the Streaming Income Tracker (Twitch/YouTube Live)
- One Total Streaming Income card. A single headline figure that adds Sub Revenue, Bits / Donations, Ad Revenue and Sponsorship across every logged session.
- Four charts wired straight to the data. Stream Count by Platform, Stream Count by Content Category, Total Income by Stream, and Bits/Donations vs Ad Revenue by Stream. They read the data columns directly, so there are no helper tables hiding off-screen.
- $ / Hour on every row. Total Income divided by Hours Streamed. This is the column that quietly changes people’s schedules.
- A three-stage payout pipeline. Pending, Processing and Paid Out, colour-coded so unpaid money is obvious at a glance.
- Six platforms in the sample data. Twitch, YouTube Live, Multi-Stream, Kick, TikTok Live and Facebook Gaming — and you can add more.
- Nine content categories. Gaming, Just Chatting, IRL, Music, Creative, Education, Variety, Esports and Podcast.
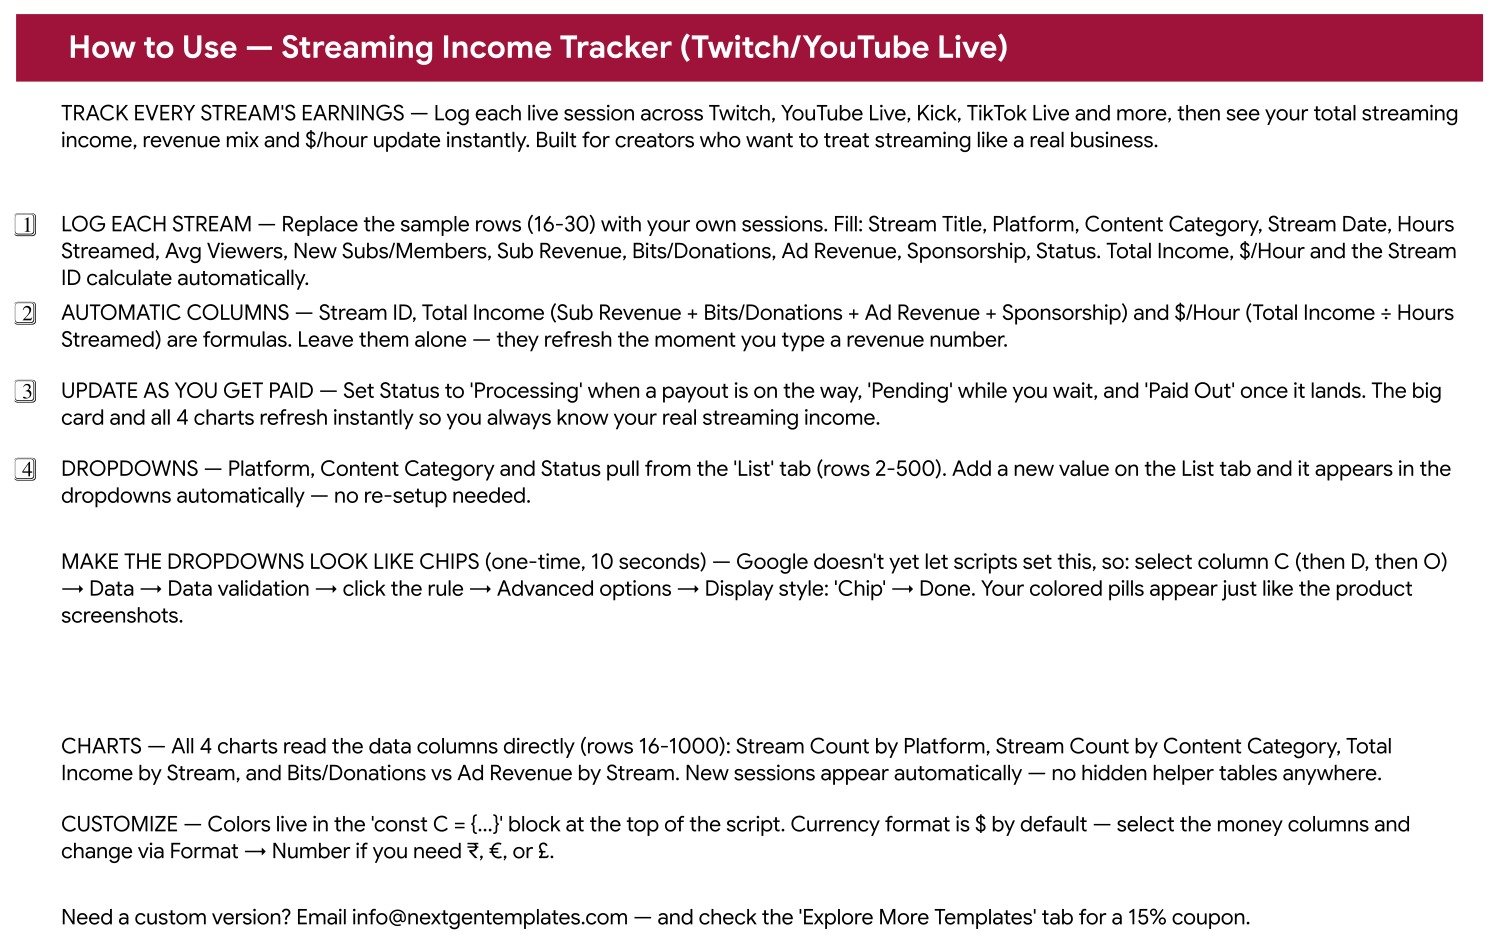
- Self-extending dropdowns. Platform, Content Category and Status are fed from the List sheet across rows 2–500; type a new value there and it appears in the dropdown immediately.
- No macros, no add-ons. Everything runs in Google Sheets in a browser, on desktop or phone, and the file can be shared with a manager or bookkeeper by link.
Inside the Streaming Income Tracker: the Page Explained
There is one working page in this Google Sheets tracker for streamers, and it is laid out top to bottom.
The KPI card
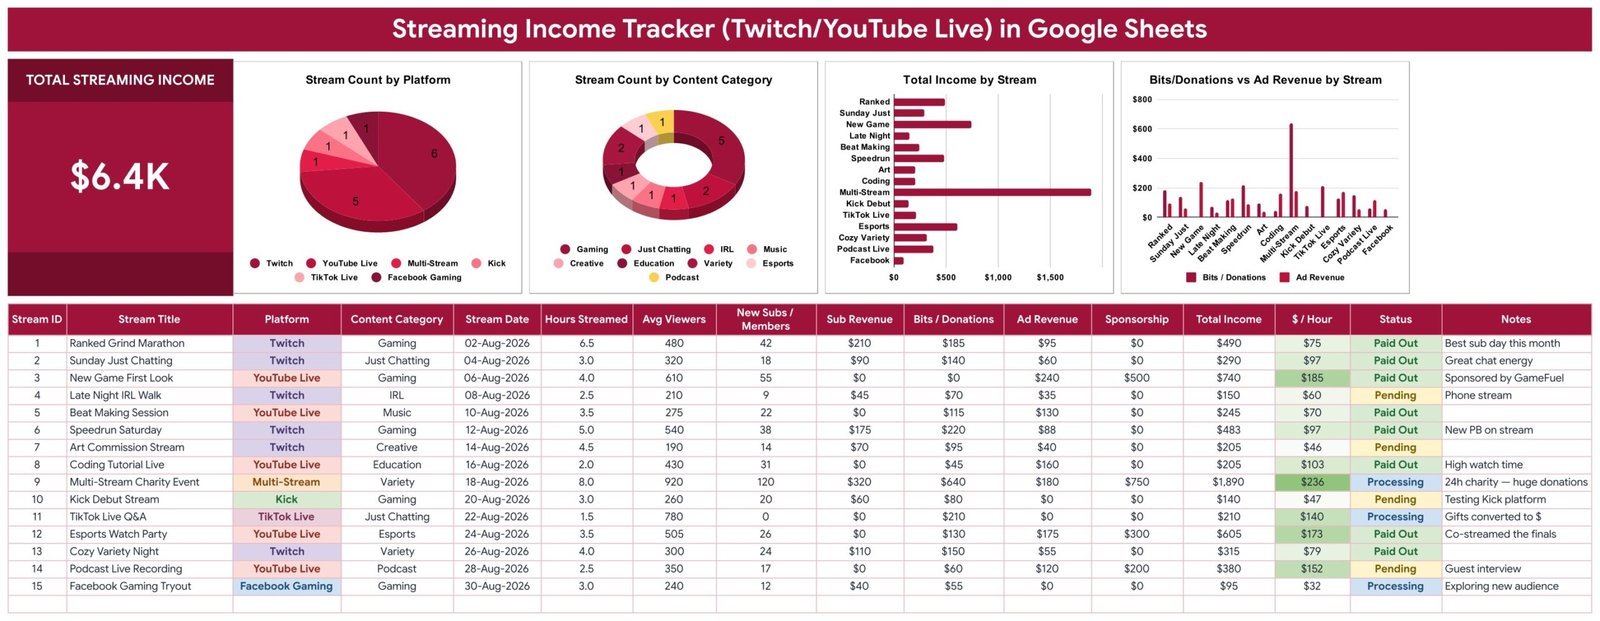
Total Streaming Income sits top-left in its own block. In the sample file it reads $6.4K. It is not a monthly figure — it is the total of everything currently in the log, so it grows as you add sessions and it drops the moment you delete a row.
The four charts
Stream Count by Platform is a pie showing how your sessions split across Twitch, YouTube Live, Multi-Stream, Kick, TikTok Live and Facebook Gaming. Stream Count by Content Category does the same as a donut across the nine categories. Total Income by Stream is a horizontal bar ranking every individual session by what it earned — in the sample, the 24-hour Multi-Stream Charity Event towers over everything else at $1,890. Bits/Donations vs Ad Revenue by Stream puts two series side by side so you can see when a night was carried by your chat rather than by advertisers.
The stream log
Sixteen columns: Stream ID, Stream Title, Platform, Content Category, Stream Date, Hours Streamed, Avg Viewers, New Subs / Members, Sub Revenue, Bits / Donations, Ad Revenue, Sponsorship, Total Income, $ / Hour, Status and Notes. Data rows run from row 16 to row 1000, with the 15 samples occupying rows 16–30. Three of those columns are formulas — Stream ID, Total Income and $ / Hour — and you never type into them.
The List sheet and the supporting pages
The List sheet holds the dropdown values. Alongside the tracker there is a How to Use page reproducing the setup steps inside the file, and an Explore More Templates page with a recommended list and a 15% coupon code.
Streaming Income Tracker vs. Excel vs. Paid Creator Analytics SaaS — Feature Comparison
| This Google Sheets tracker | A DIY Excel workbook | Paid creator analytics SaaS | |
|---|---|---|---|
| Cost | One-time, under $15 | Free if you build it yourself | $20–$99 per month |
| Platform | Google Sheets in any browser | Desktop Excel | Vendor web app |
| Setup time | About 5 minutes | Hours of formula and chart work | Account, billing and OAuth connections |
| Real-time team collaboration | Yes, native Google Sheets sharing | Only via OneDrive co-authoring | Yes, priced per seat |
| Mobile access | Yes, Google Sheets app | Limited | Yes |
| Customisable fields | Yes — add columns and dropdown values freely | Yes | Usually fixed |
| Share with link | Yes | No | Sometimes |
| Year-1 cost at 5 users | One purchase, shared by link | Your own time | $1,200–$5,900 |
| Automatic import of platform payouts | No — figures are entered or pasted | No | Yes, via API connections |
| Covers a platform launched last month | Yes — add it to the List sheet | Yes | Only if the vendor supports it |
The honest summary: a connected SaaS tool will pull your Twitch payout in without you lifting a finger, and this streaming income tracker will not. It does not connect to Twitch, YouTube, Kick or TikTok, has no API and imports nothing, and it is not affiliated with or endorsed by Twitch, YouTube or Google. You read the numbers off each platform’s own payout page and type or paste them in. What you get in return is coverage of every platform you actually use, including the ones no vendor has integrated yet, for a single payment instead of a subscription.
Who Should Use This Streaming Income Tracker
Use it if you stream on more than one platform, or expect to. If you are on a single platform today, it still earns its place — run it as a Twitch income tracker now, or as a YouTube Live revenue tracker, and add the rest to the List sheet the week you start simulcasting. Use it if your income comes from more than one source per stream — a sponsored segment on top of subs and bits is exactly the case the four revenue columns were built for. Use it if you have ever wondered whether your eight-hour marathons are worth it, because the $ / Hour column answers that in one sitting. And use it if a bookkeeper has ever asked you for a dated income record and you sent them screenshots.
Skip it if you want payouts pulled in automatically, if you need invoicing, or if you are looking for audience analytics — watch time, chat sentiment and concurrent viewers are not what this sheet records. It tracks money and hours.
Real-World Use Cases
The simulcaster. A variety streamer running Twitch and Kick in parallel could not tell which platform paid. Two months of logging showed Kick brought the viewers and Twitch brought the subs — useful, because she had been treating Kick debut nights as payday.
The part-timer. A YouTube Live creator logs a sponsored First Look, a two-hour coding tutorial and a late-night IRL walk in the same week. The $ / Hour column showed the tutorial beating a five-hour gaming session, which rewrote his schedule within a month.
The charity organiser. One 24-hour multi-stream a quarter, with sponsors who want a report afterwards. The Bits/Donations vs Ad Revenue by Stream chart separates the donation spike from the steady ad income, so the report goes out with real numbers instead of a dashboard screenshot.
Advantages of the Streaming Income Tracker
- Platform-agnostic by design. Because nothing is wired to an API, no platform change can break it and no new platform is locked out.
- Nothing hidden. Every chart reads the visible data columns. There are no helper tabs to repair when you insert a row.
- Fast to adopt. Copy the sheet, replace 15 sample rows, done. There is no onboarding and no account to create — the streaming income tracker is useful the same evening you buy it.
- Genuinely shareable. One link gets your manager or accountant read-only access; no seats, no invitations to a vendor’s app.
- Yours permanently. A one-time purchase, and the copy lives in your Drive whether or not you keep streaming.
Opportunities for Improvement
It is worth being straight about the limits. Manual entry is the big one: if you stream daily across four platforms, you will spend a few minutes a week copying payout figures across. The Total Streaming Income card is an all-time total rather than a month-to-date figure, so if you want a monthly view you will need to filter the log or add your own pivot. There is no currency conversion — the sheet is formatted in $ and expects one currency at a time, though you can switch it via Format → Number. And the coloured chip dropdowns are a one-time manual setting because Google Sheets does not let a script apply the Chip display style.
Best Practices for the Streaming Income Tracker
- Log the stream the night it happens, with $0 in the revenue columns, then fill the money in when the payout lands. Half-remembered hours are the main source of a wrong $ / Hour.
- Keep Hours Streamed honest. Include the time you were actually live, not the time the software was open, or every derived figure drifts.
- Use Status as a chase list. Anything sitting in Pending for more than a platform’s payout cycle is worth investigating.
- Extend the List sheet before you need it. Adding “Rumble” or “Charity” takes five seconds and keeps your categories consistent from the start.
- Use the Notes column. “Sponsored by GameFuel” or “24h charity” is what makes last quarter’s numbers readable next year.
- Review $ / Hour monthly, not weekly. One viral night will distort a short window.
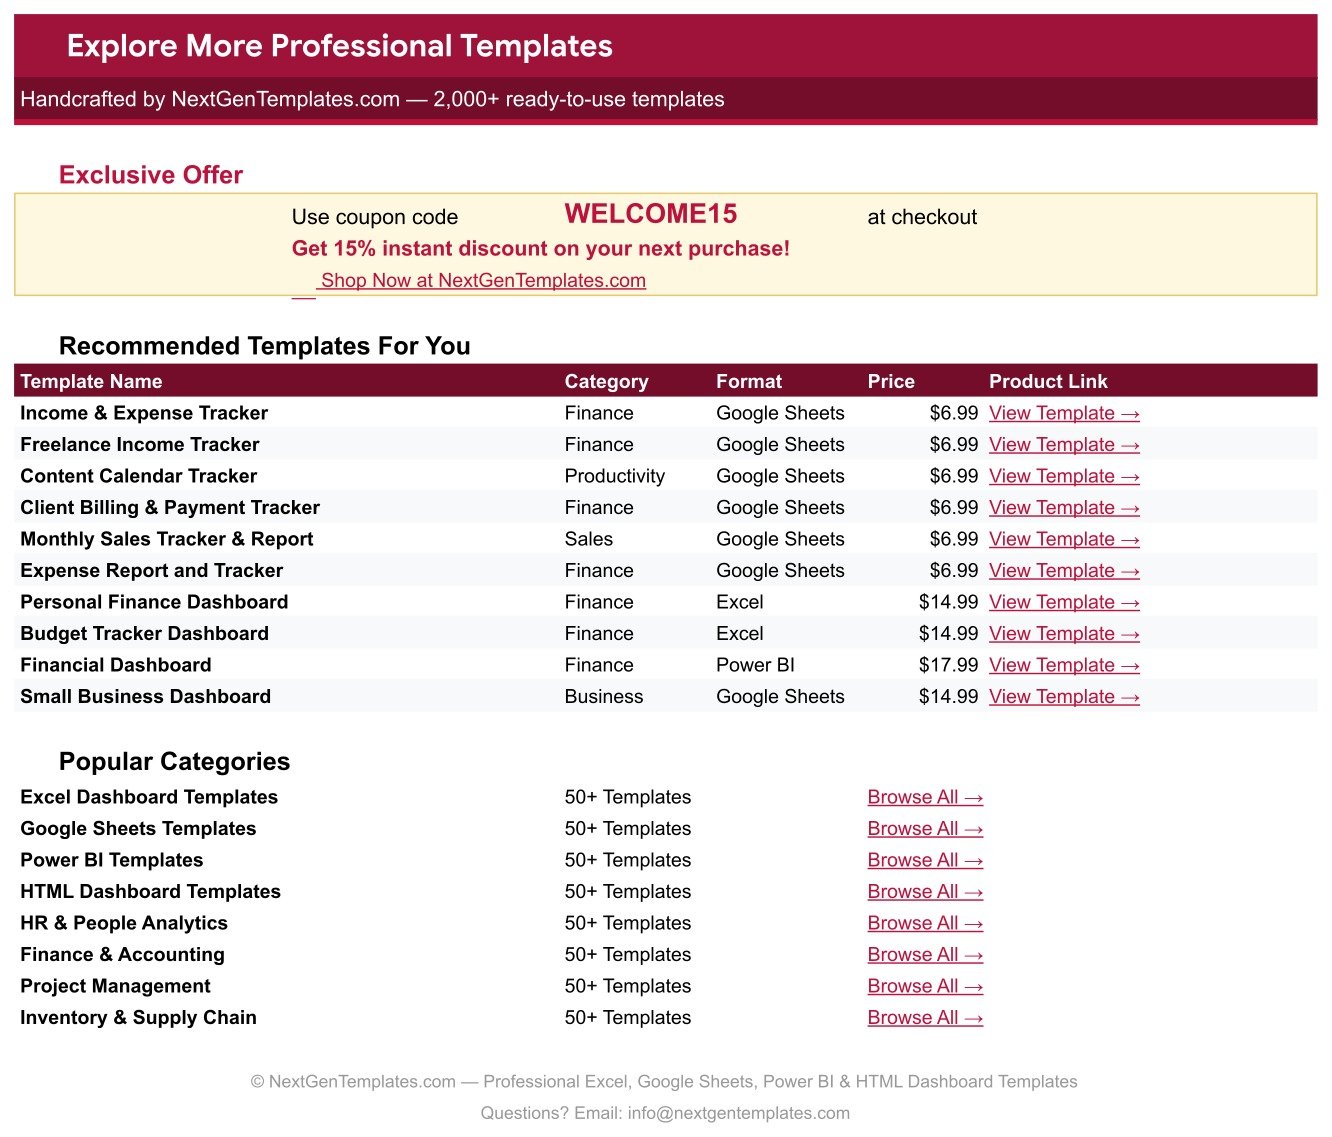
Explore Relevant Templates
If you are building a full creator-business stack, these pair well with the streaming income tracker:
- Sponsorship & Brand Deal Tracker in Google Sheets — the deal pipeline that feeds the Sponsorship column here.
- Short-Form Video Performance Tracker in Google Sheets — for the clips you cut out of last night’s stream.
- Content Creator Revenue Dashboard in Google Sheets — a wider revenue view once you sell more than streams.
- Online Course Sales & Student Tracker in Google Sheets — when the tutorials turn into a paid course.
- Affiliate Marketing Income Tracker in Google Sheets — for the link revenue your chat generates.
Want to build skills like this step by step? The NextGenTemplates Academy learning paths cover spreadsheet tracking with practice files.
Get the Streaming Income Tracker
Frequently Asked Questions
Does the streaming income tracker connect to Twitch or YouTube?
No. There is no API, no sign-in and no automatic payout import, and the template is not affiliated with or endorsed by Twitch, YouTube or Google. You copy the figures from each platform’s own payout page. That is precisely why it also handles Kick, TikTok Live, Facebook Gaming and anything you add later.
Do I need a Google account?
Yes. The download is a PDF containing a “Make a copy” link; the copy is created in your own Google Drive and everything runs in the browser. No macros, nothing to install.
How many sessions can I log?
The card and the charts read rows 16 to 1000, so just under a thousand streams — several years for most creators.
Can I add a platform that isn’t listed?
Yes. Add it on the List sheet anywhere in rows 2–500 and it appears in the Platform dropdown straight away. The same applies to Content Category and Status.
Why are my dropdowns plain text instead of coloured pills?
Google Sheets does not allow a script to set the Chip display style. Select the column, open Data → Data validation → the rule → Advanced options and choose Display style: Chip. Ten seconds per column, and it then matches the screenshots.
Can I use it for tax records?
It gives an accountant a clean, dated income log per session and per platform, which is a solid starting point. It is a record-keeping sheet, not tax advice — in the US, the IRS Self-Employed Individuals Tax Center covers what you actually owe.
Can I change the colours?
Yes. The palette lives in the const C = {...} block at the top of the script, and ordinary Google Sheets formatting works everywhere else.
About the Author
Built by PK – Microsoft Certified Professional with 15+ years of Excel, Google Sheets, and Power BI experience. Founder of NextGenTemplates, reaching 300K+ subscribers across YouTube channels. Every template is hand-built and tested before release.
Conclusion
Streaming pays in fragments, and fragments are easy to lose track of. A streaming income tracker that takes two minutes a session and gives you a real $ / Hour figure is worth more than a dashboard you never open. This one is small on purpose: one page, four charts, sixteen columns, three formulas doing the arithmetic, and dropdowns that grow when your channel does.
Worth reading alongside it: Twitch Creator Camp on building a sustainable channel, the YouTube monetization policies, and the Google Sheets function list if you want to extend the formulas yourself.
Get the template here: Streaming Income Tracker (Twitch/YouTube Live) in Google Sheets on NextGenTemplates.
For video walkthroughs of this and every other template we build, subscribe on YouTube at @PKAnExcelExpert.