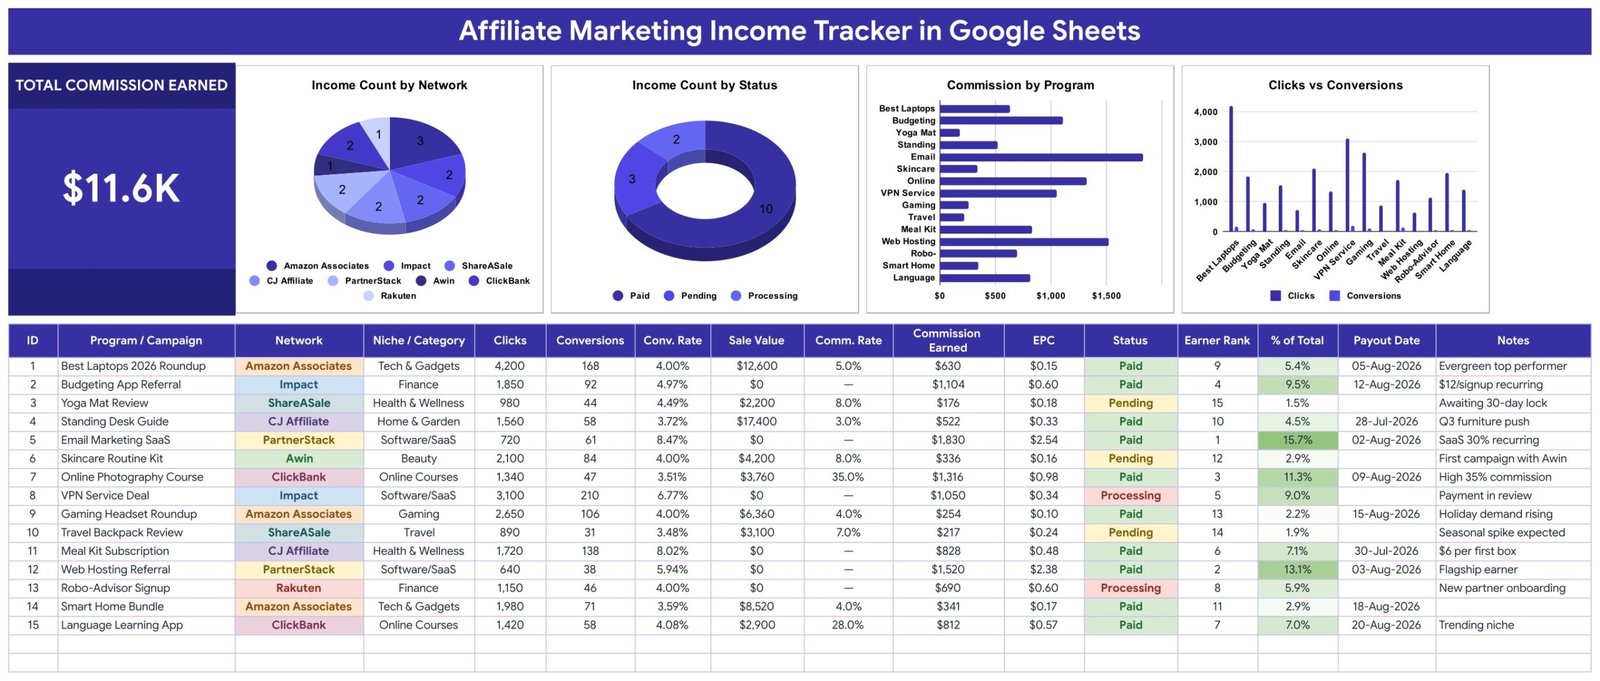
The Affiliate Marketing Income Tracker in Google Sheets is a one-page affiliate marketing income tracker with 16 columns per campaign, a Total Commission Earned card and 4 live charts. Its sample log holds 15 fictional campaigns across 8 networks and 9 niches, adding up to 26,300 clicks, 1,252 conversions, $61,040 in referred sales and $11,626 in commission, of which $9,157 is marked Paid.
Most affiliates read their numbers one dashboard at a time: Amazon Associates in one tab, Impact in another, a ClickBank report somewhere else. That makes the simple questions hard. Which program earns the most per click? How much commission is still waiting to be confirmed? This template puts every program in one log, calculates the rates for you and ranks your earners automatically. You type the totals, and Google Sheets does the rest.
Get the Affiliate Marketing Income Tracker in Google Sheets

Key Features of the Affiliate Marketing Income Tracker
- Total Commission Earned card: adds the Commission Earned column for every row logged. The sample data reads $11.6K, which is $11,626.
- Six automatic columns: ID, Conv. Rate (Conversions ÷ Clicks), Comm. Rate (Commission ÷ Sale Value), EPC (Commission ÷ Clicks), Earner Rank and % of Total are formulas, so you never calculate a rate by hand.
- Flat-fee friendly: when Sale Value is 0, as it is for pay-per-lead signups and recurring referrals, Comm. Rate shows a dash rather than an error.
- Earner Rank with a colour scale: every program is ranked by commission and % of Total is shaded green, so the top earners stand out. In the sample, Email Marketing SaaS leads with $1,830 (15.7%).
- Four charts linked straight to the data: Income Count by Network, Income Count by Status, Commission by Program and Clicks and Conversions by Program read rows 16-1000 with no hidden helper tables.
- Colour-coded chips: each network has its own colour, and Status is green for Paid, amber for Pending and red for Processing.
- Dropdowns that grow: Network, Niche / Category and Status come from the List tab (rows 2-500), so a new network appears in the dropdown the moment you add it.
Tracker Structure
Tab 1: Affiliate Income Tracker
The main page opens with the title banner and the Total Commission Earned card, followed by Income Count by Network, Income Count by Status, Commission by Program and Clicks and Conversions by Program. Below the charts sits the income log: ID, Program / Campaign, Network, Niche / Category, Clicks, Conversions, Conv. Rate, Sale Value, Comm. Rate, Commission Earned, EPC, Status, Earner Rank, % of Total, Payout Date and Notes.
Tab 2: Instructions
The instructions tab explains which columns you fill, which ones calculate, when to change a row from Pending to Paid, how the List tab feeds the dropdowns, how to turn dropdowns into coloured chips and how to change the currency from $ to ₹, € or £.
Tab 3: List
The dropdown source. It ships with 11 networks (Amazon Associates, ShareASale, CJ Affiliate, Impact, ClickBank, Awin, Rakuten, PartnerStack, FlexOffers, Direct / In-house and Other), 11 niches from Tech & Gadgets to Online Courses, and the three statuses.
Tab 4: Explore More Templates
A page of recommended templates and popular template categories from NextGenTemplates.
Affiliate Marketing Income Tracker vs. Excel Dashboard vs. Paid Click-Tracking Tools — Feature Comparison
| Feature | Affiliate Income Tracker (Google Sheets) | Microsoft Excel dashboard | Paid click-tracking tools (Voluum / ClickMagick) |
|---|---|---|---|
| Cost | ✅ $6.99 one-time | Excel licence plus a template or build time | Recurring monthly plan |
| Platform | ✅ Google Sheets in any browser | Excel desktop or Microsoft 365 | The vendor’s web app |
| Setup time | ✅ Make a copy, replace 15 sample rows | Build or adapt a workbook | Account setup, tracking links and domains |
| Real-time team collaboration | ✅ Google Sheets sharing | Co-authoring through OneDrive or SharePoint | ✅ Seats depend on the plan |
| Mobile access | ✅ Google Sheets app | ✅ Excel mobile app | ✅ Web dashboard |
| Customizable fields | ✅ Edit columns and the List tab | ✅ Yes | Limited to the vendor’s report fields |
| Share with link | ✅ Yes, view-only or edit | ✅ Through OneDrive | Report exports or extra seats |
| Year-1 cost at 5 users | ✅ $6.99 total | Microsoft 365 licence per user | A year of plan fees |
| Every network’s commission in one log | ✅ Yes | Depends on the build | Clicks yes, payouts often not |
| Pulls clicks and commission automatically | ❌ Manual entry | ❌ Manual unless you build a connector | ✅ Clicks and conversions via tracking links |
For bloggers and creators who want one honest record of what each program actually pays, without another monthly tool, this Google Sheets tracker sits in the sweet spot.
Who Should Use This Template
Perfect for:
- Bloggers and niche-site owners promoting products through two or more affiliate networks
- YouTubers, podcasters and newsletter writers who want EPC and conversion rate for each offer they mention
- Creators with flat-fee or recurring SaaS offers alongside percentage-of-sale programs
- Small content teams and agencies sharing affiliate results with a client in a Google Sheet
Not a fit if:
- You need clicks and commissions imported automatically from Amazon Associates, ShareASale, Impact or any other network; every figure is typed in
- You run your own affiliate program and need partner management, payouts, invoicing, bookkeeping or tax calculations
Real-World Use Cases
Jordan runs a tech review blog. Every roundup and review gets its own row. After a quarter, sorting by EPC shows him that an older laptop guide earns more per click than a newer smart home bundle, even though the bundle gets more traffic. He refreshes the laptop guide first and trims the bundle page.
Aisha makes personal finance videos. Most of her offers pay a flat fee per signup, so she leaves Sale Value at 0 and focuses on conversions, EPC and payout dates. Rows stay Pending until each network’s review period clears, and the Income Count by Status chart shows her at a glance how much of the month is still unconfirmed.
Marco manages affiliate content for two niche sites. He keeps one copy of the tracker per site, tags rows by niche, and uses the Notes column to record cookie windows and rate changes, so a sudden drop in commission has an explanation right next to it.
Advantages of the Affiliate Marketing Income Tracker
- Earnings per click, not just totals: EPC and conversion rate show which content earns, which is what decides where your next hour of writing goes.
- Less spreadsheet work: six formula columns and four linked charts mean a new campaign takes one row of typing.
- Low cost: a one-time $6.99 purchase, with no seat or subscription fee for sharing it with a partner or client.
- Network-agnostic: totals from any affiliate network sit in the same log, so leaving a program does not erase your history.
- Easy to adapt: the List tab lets you rename networks and niches to match the programs you actually promote.
Opportunities for Improvement
- Manual entry only. There is no API connection or auto-import from any affiliate network, so figures must be copied from each network’s report.
- The card counts every status. Total Commission Earned includes Pending and Processing rows. In the sample, $2,469 of the $11,626 is not yet paid, so filter or clear unconfirmed rows for a paid-only figure.
- No period filter. The card and charts cover the whole log. To review one month, make a copy per period or filter the table yourself.
- Two charts count rows, not dollars. Income Count by Network and Income Count by Status show how many campaigns sit in each group; use Commission by Program for money.
- Short chart labels. Commission by Program and the clicks chart show only the start of long program names, so keep names distinctive in their first word or two.
- No reversals column. Refunded or reversed commissions need a manual edit to the Commission Earned figure.
- Chip-style dropdowns are a manual step. Google Sheets does not let a script set the chip display, so it takes a one-time change in Data validation.
Best Practices
- Log each network’s figures on the same day every week or month, so rows are comparable.
- Keep a commission as Pending until the network confirms it, then switch it to Paid and add the payout date.
- Use one row per program or piece of content rather than per network, so EPC points at something you can improve.
- Write cookie windows, recurring terms and rate changes in Notes, since those explain odd rows months later.
- Disclose affiliate links clearly to your audience. That is your responsibility, not the tracker’s; the FTC’s Endorsement Guides FAQ explains the US rules.
To add your own networks or niches, Google’s guide to creating an in-cell dropdown list covers the Data validation settings, and its help page on adding and editing charts shows how to restyle the four charts.
Explore Relevant Templates
Set up each program properly with the Affiliate Marketing Checklist in Google Sheets guide, then log its results here.
If affiliate commission is one stream among several, the Side Hustle Income Tracker and the Multiple Income Streams Tracker show the bigger picture, and the Content Creator Revenue Dashboard adds analysis pages across revenue sources.
Creators who promote products in videos or episodes can pair this tracker with the YouTube Video Ideas & Upload Tracker or the Podcast Episode Planning Tracker. Browse all Google Sheets trackers on NextGenTemplates.
Prefer to learn the spreadsheet skills behind trackers like this in order? The NextGenTemplates Academy learning paths give you a guided route, with practice files to work through.
Get the Affiliate Marketing Income Tracker in Google Sheets
Frequently Asked Questions
What does the Affiliate Marketing Income Tracker measure?
It records clicks, conversions, sale value, commission, status and payout date for each program, then calculates conversion rate, commission rate, EPC, earner rank and share of total. A headline card totals commission earned, and four charts break campaigns down by network, status and program.
Does it connect to Amazon Associates, ShareASale or Impact?
No. The tracker is manual entry only. You copy totals from each network’s report into a row, and there is no API connection or auto-import. Network names are trademarks of their owners, and NextGenTemplates is not affiliated with them.
How long does setup take?
Around ten minutes. Open the PDF, make your copy, adjust the List tab if your networks or niches differ, and replace the 15 sample rows with your own campaigns. The formulas, colour rules and charts are already in place.
How is EPC calculated?
EPC, or earnings per click, is Commission Earned divided by Clicks. Conv. Rate is Conversions divided by Clicks, and Comm. Rate is Commission divided by Sale Value, which shows a dash when Sale Value is 0 for flat-fee or recurring offers.
How does it compare with paid click-tracking tools?
Click trackers record clicks automatically on a monthly plan. This Google Sheets tracker costs $6.99 once, records what each network actually paid, and keeps every program in one shareable sheet. The trade-off is that every figure is typed in by you.
Is it accounting or tax software?
No. It is a performance log for affiliate campaigns, not a bookkeeping, invoicing or tax tool, and it offers no tax or income advice. The campaigns and figures that ship with the file are fictional sample data.
About the Author
Built by PK — Microsoft Certified Professional with 15+ years of Excel, Google Sheets and Power BI experience. Founder of NextGenTemplates, reaching 300K+ subscribers across YouTube channels. Every template is hand-built and tested before release.
Conclusion
Affiliate income is easier to grow when you can see which programs pay per click and which commissions have really landed. An affiliate marketing income tracker in Google Sheets puts every network, rate and payout in one log, with the maths and charts already done.
✅ Instant download · One-time payment · No subscription
Last updated: September 2026