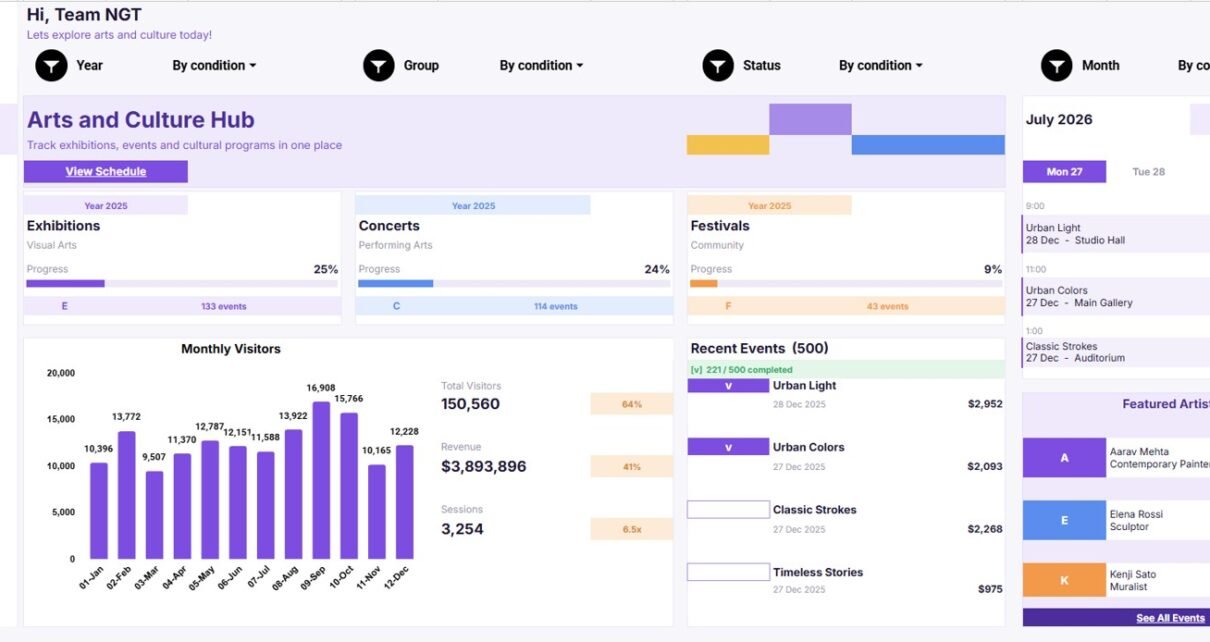
Explore how the Arts and Culture Dashboard in Google Sheets tracks exhibitions, concerts, festivals, visitors, artists, venues, programs, revenue, costs, and source data in one editable template.
Online Tutorial for Data Analysis and Automation
Explore how the Arts and Culture Dashboard in Google Sheets tracks exhibitions, concerts, festivals, visitors, artists, venues, programs, revenue, costs, and source data in one editable template.
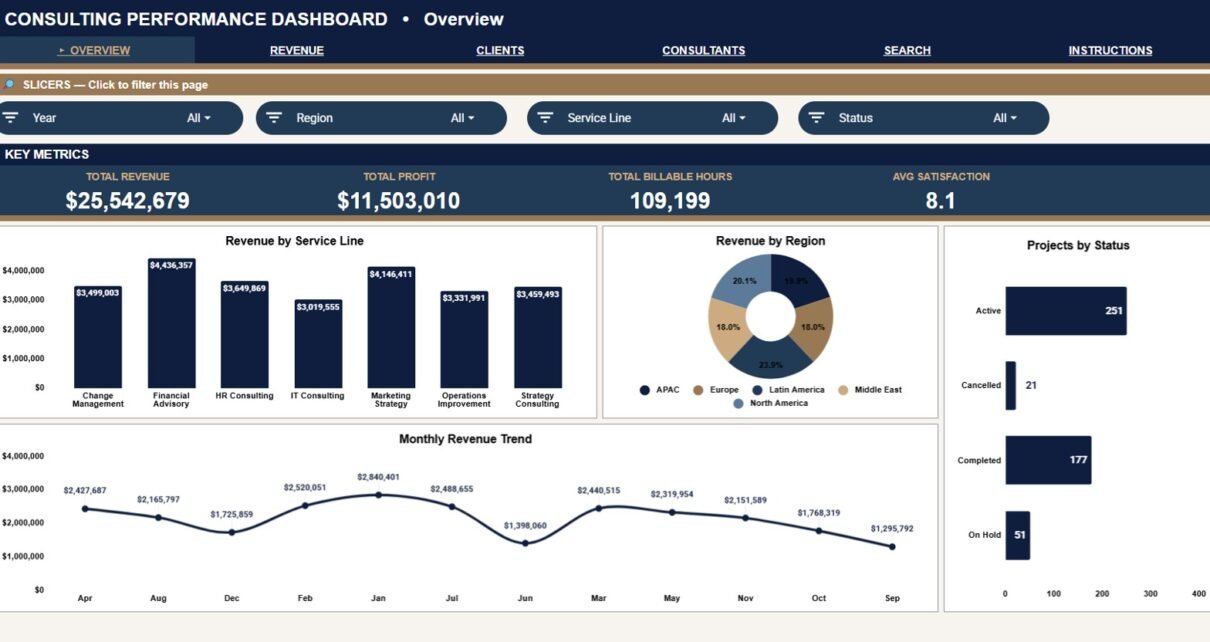
Review the Consulting Performance Dashboard in Google Sheets for revenue, profit, billable hours, client analysis, consultant performance, Project ID lookup, and data sheet reporting.
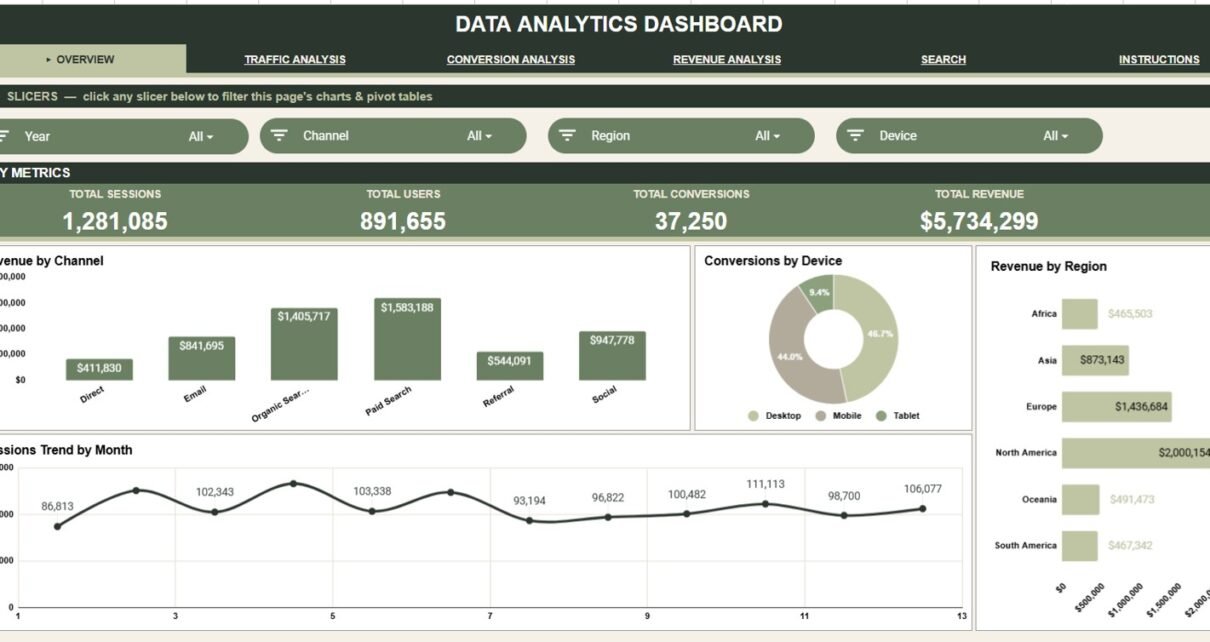
An editable Data Analytics Dashboard in Google Sheets with 6 tabs, 16 charts, slicers and a Record ID lookup for tracking sessions, conversions, revenue, cost and ROAS.
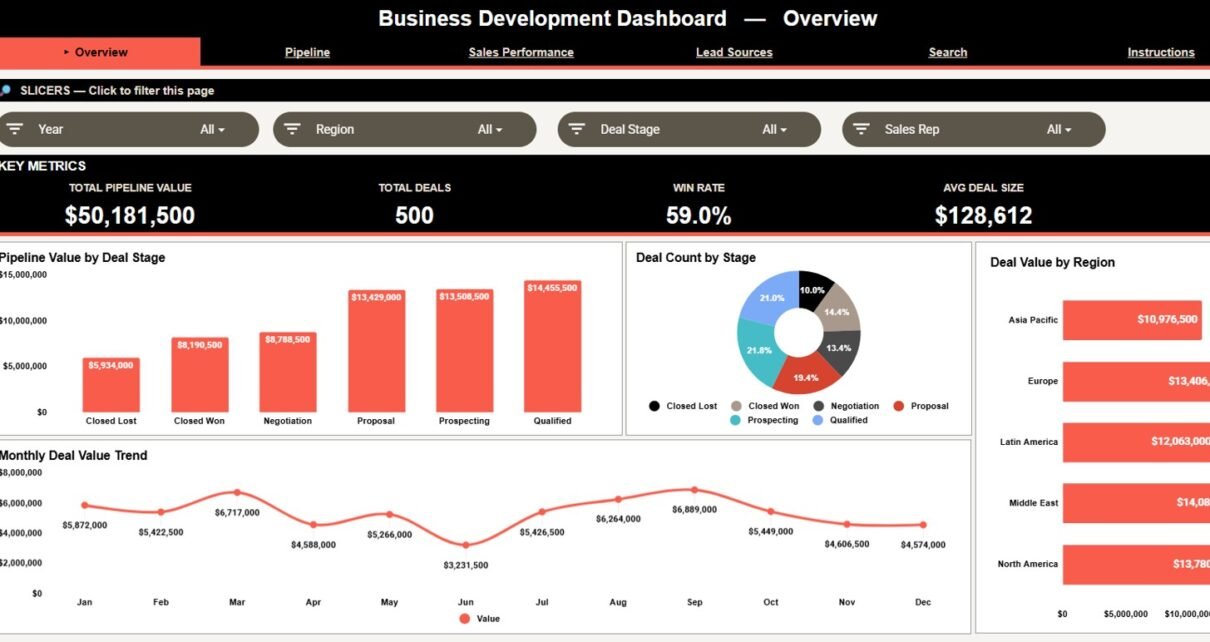
Track pipeline value, deal stages, win rate, sales reps, lead sources and regions with the Business Development Performance Dashboard in Google Sheets, including a Deal ID lookup.
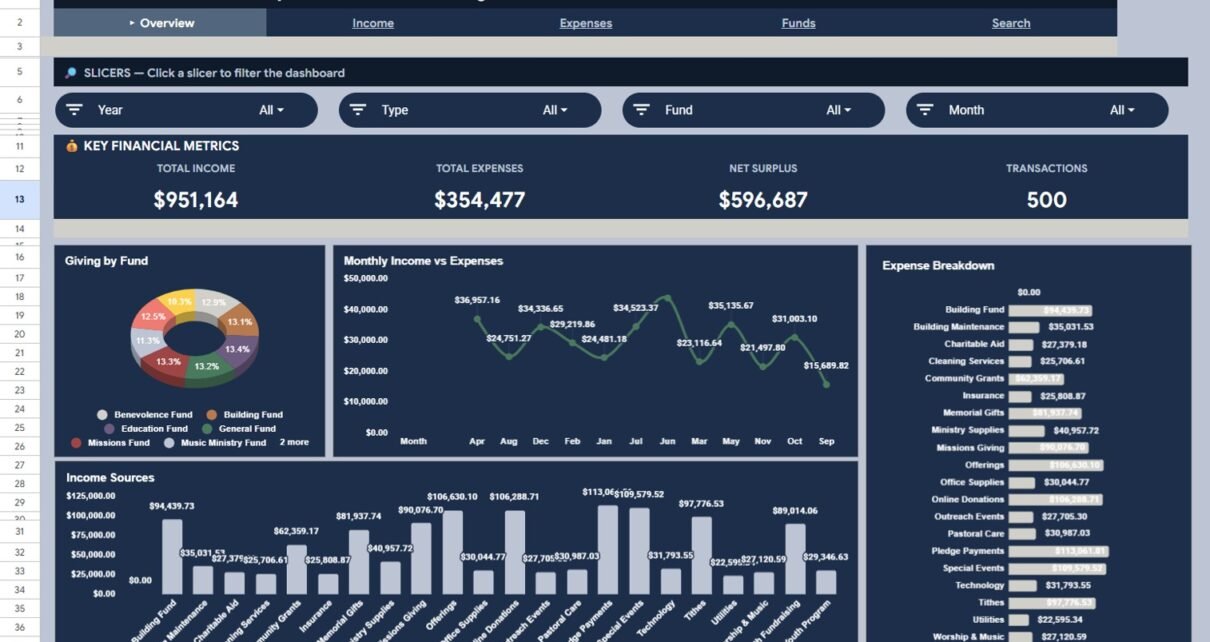
Review church income, expenses, funds, payment methods and individual transactions in one Google Sheets dashboard with KPI cards, slicers, a Transaction ID search and a User Guide.
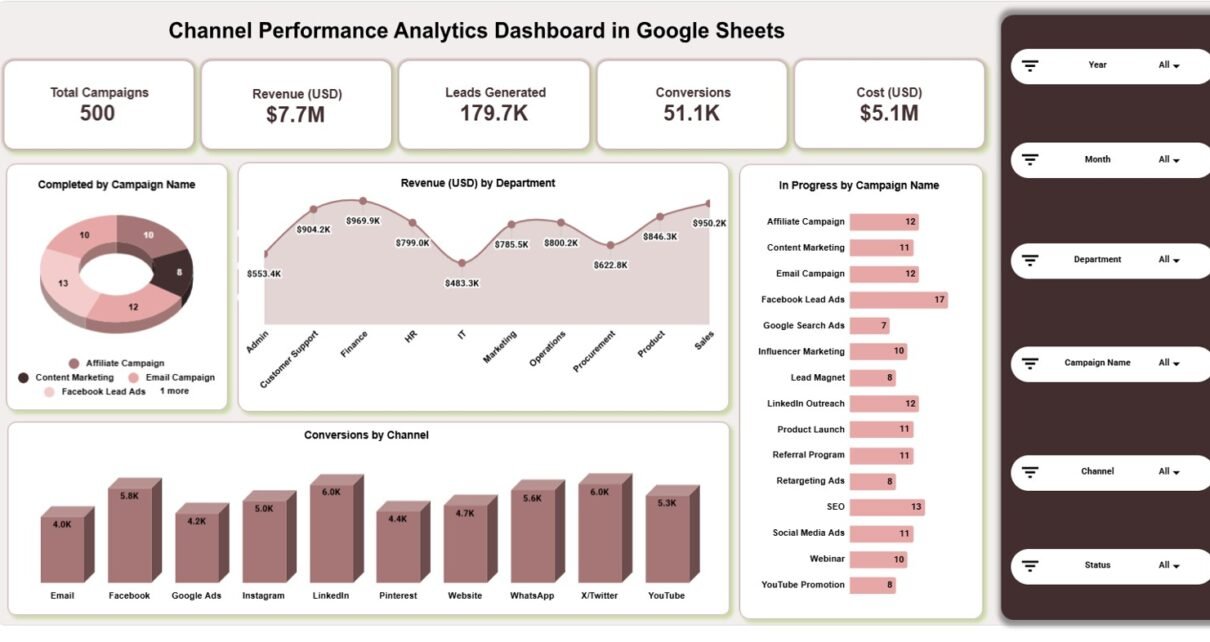
Track campaigns, channels, revenue, leads, conversions, cost, departments, and monthly trends with this Google Sheets performance analytics dashboard template.
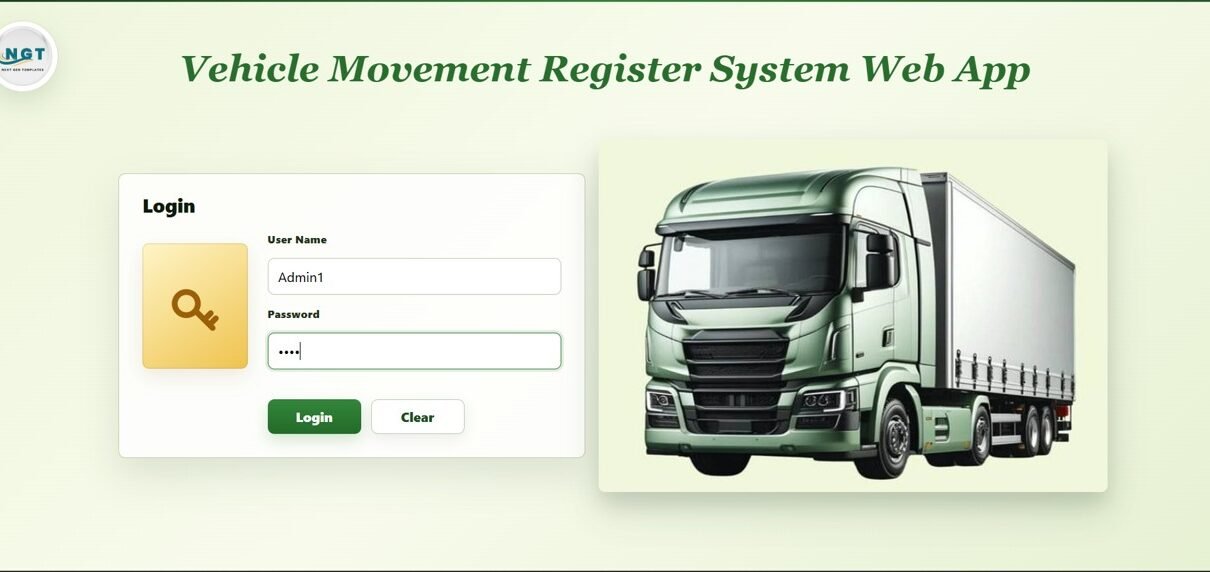
A multi-user Google Apps Script web app for fleet teams: trip register, vehicle and driver masters, fuel and maintenance logs, document expiry alerts and WhatsApp driver messaging, for a one-time $39.99.
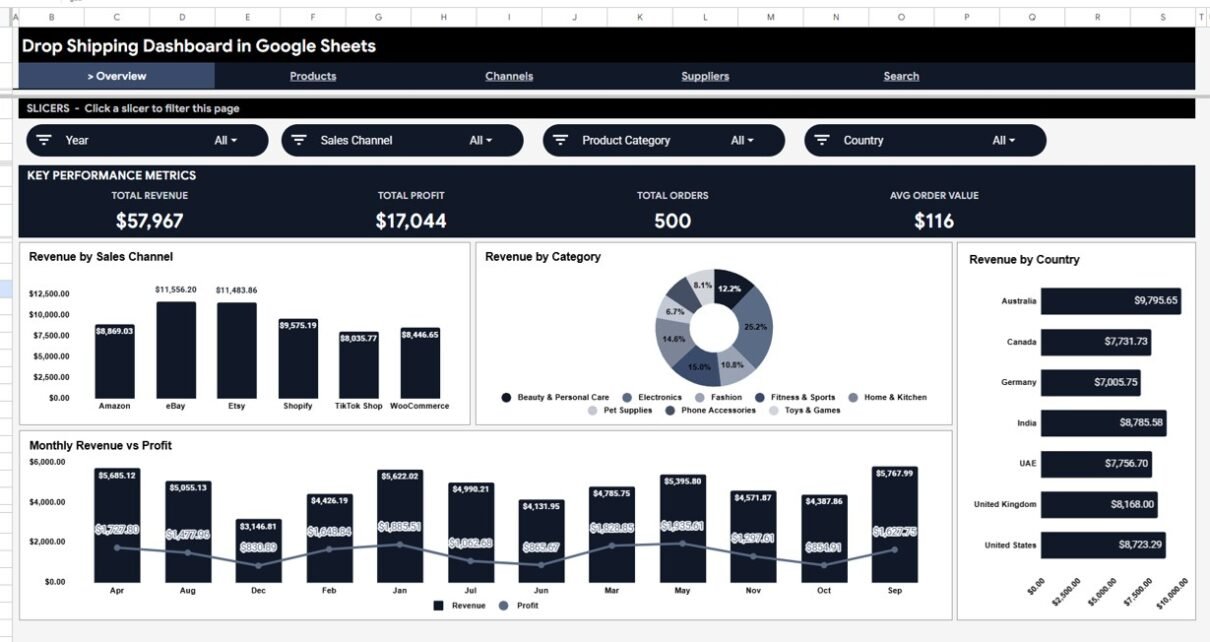
Track drop shipping revenue, profit, channels, suppliers and orders in one Google Sheets file. Overview, Products, Channels and Suppliers pages with slicers, 13 charts and an Order Search sheet.
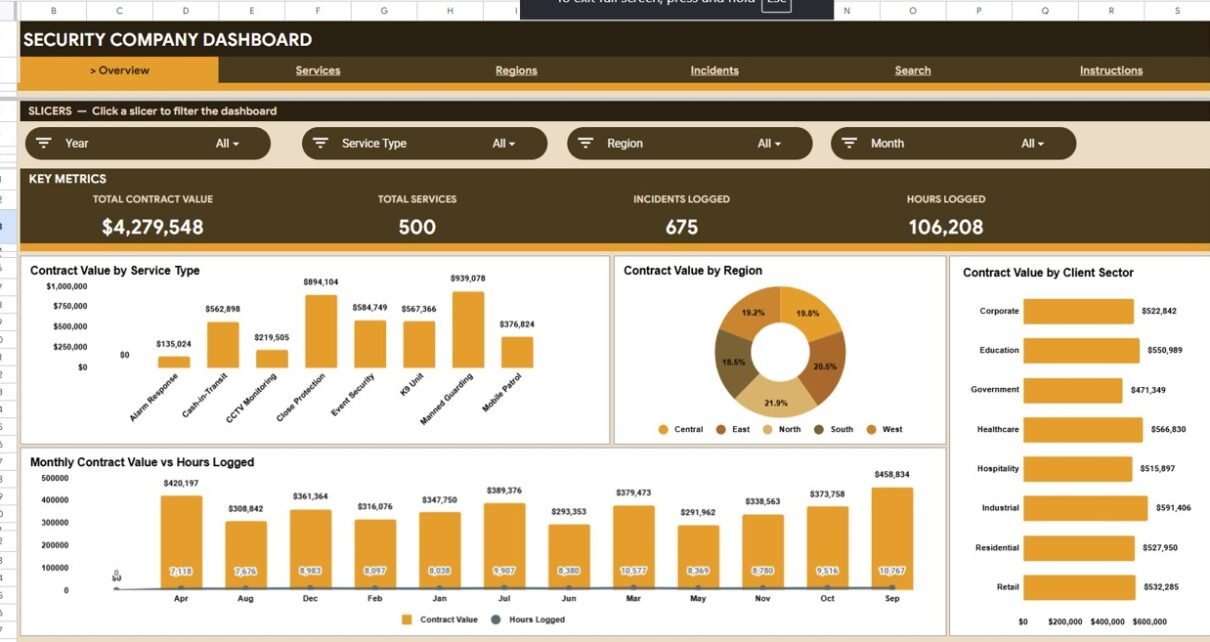
A ready-to-use Security Company Dashboard in Google Sheets that tracks contract value, services, hours logged, and incidents across 4 KPI cards, 15 charts, and 6 sheet tabs — with native slicers and a Service ID search.
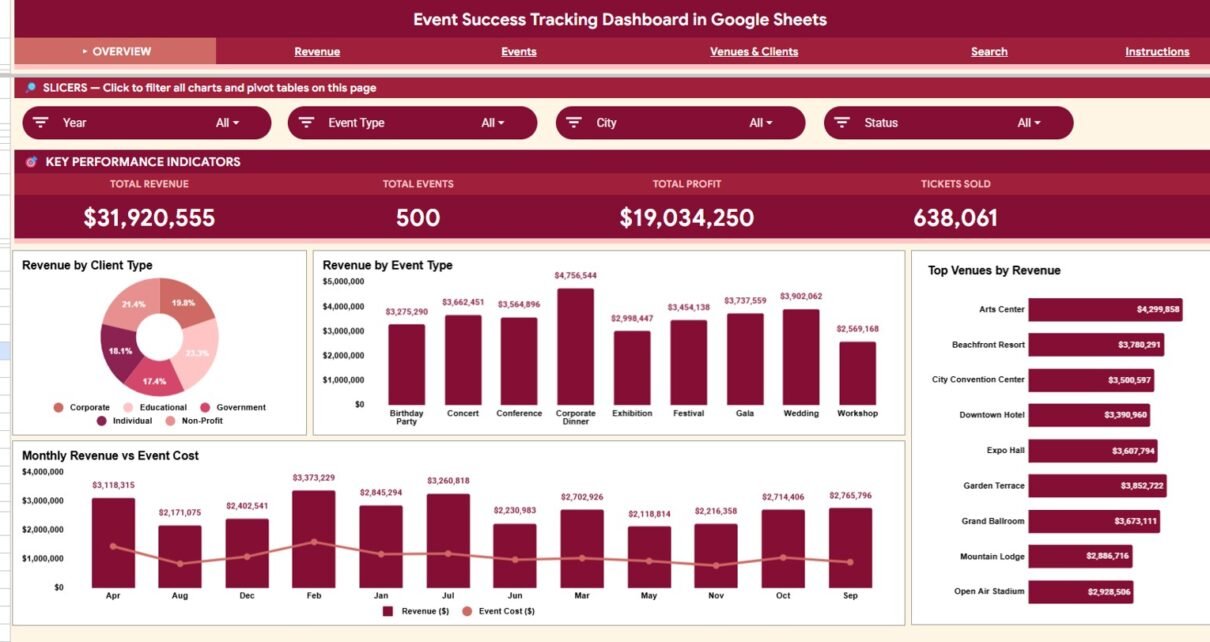
Walk through the Event Success Tracking Dashboard in Google Sheets: 6 tabs, 4 KPI cards, 16 charts, slicers, Search sheet, and Data sheet for event revenue, profit, venue, client, and ticket tracking.