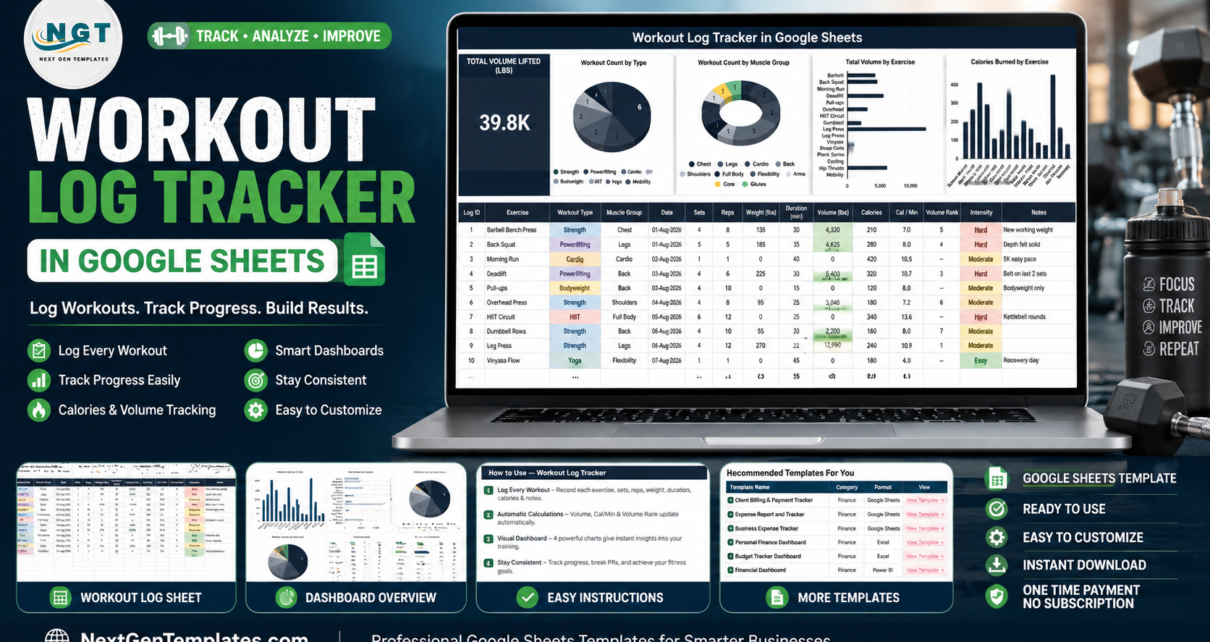
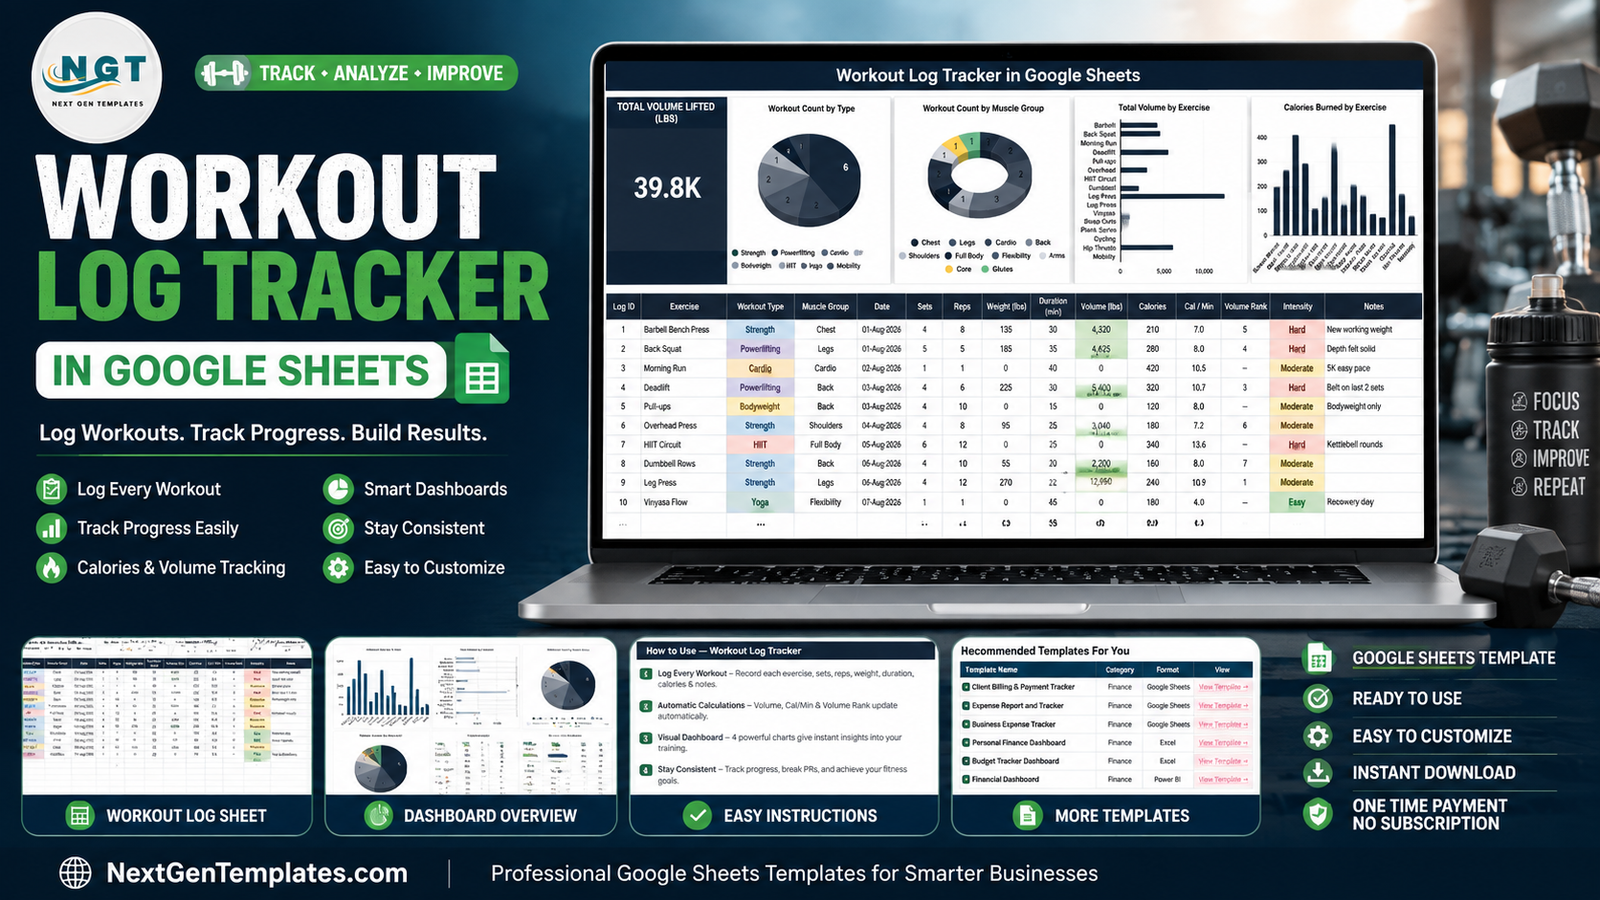
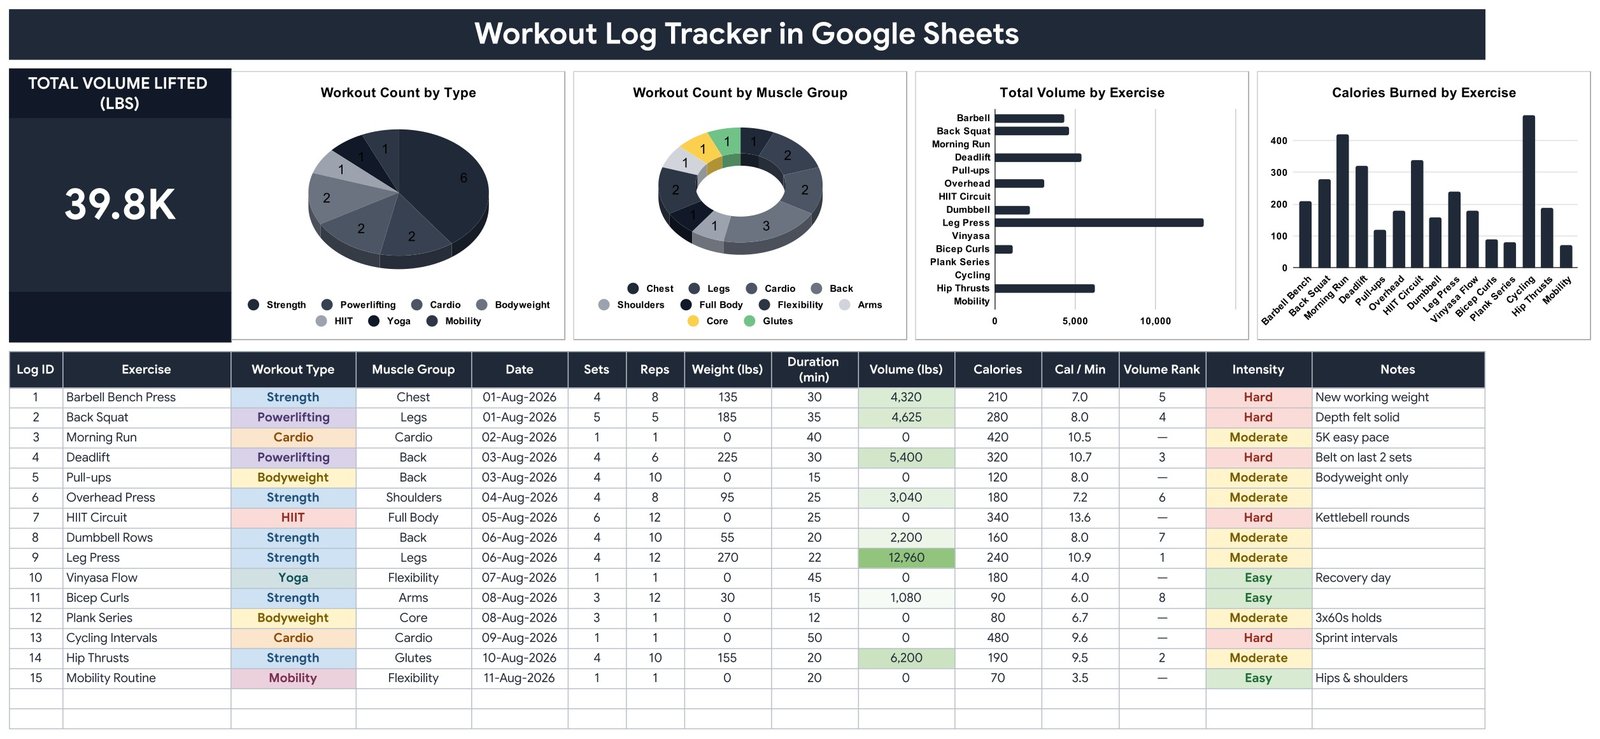
Most training records die in a notebook. You write “bench 4×8 @135” on Monday and by the following month you have no idea whether the load went up, whether you skipped legs for three weeks, or how much total weight you actually moved. The Workout Log Tracker in Google Sheets fixes that with one screen: a Total Volume Lifted KPI card, four charts that redraw as you type, and a 15-column table with room for roughly 985 logged sessions. The sample file ships with 15 workouts across 7 workout types, 10 muscle groups and 39.8K lbs of recorded volume, so the formulas are visibly working before you change a thing.
Get the Workout Log Tracker in Google Sheets
This walkthrough covers what is on each page, how the calculated columns behave, how it compares to an Excel log or a paid fitness app, and the honest limits of a hand-typed spreadsheet.
Key Features of the Workout Log Tracker in Google Sheets
- Total Volume Lifted (lbs) KPI card. One large figure on the left of the page, summing Sets x Reps x Weight across every strength row. In the sample data it reads 39.8K.
- Four charts, no helper tables. Workout Count by Type, Workout Count by Muscle Group, Total Volume by Exercise and Calories Burned by Exercise all read the data columns directly using the native Aggregate option over rows 16-1000.
- Fifteen tracked fields per session. Log ID, Exercise, Workout Type, Muscle Group, Date, Sets, Reps, Weight (lbs), Duration (min), Volume (lbs), Calories, Cal / Min, Volume Rank, Intensity and Notes.
- Three columns that calculate themselves. Volume (lbs), Cal / Min and Volume Rank are formulas. You never type them.
- Dropdowns backed by a List tab. Workout Type, Muscle Group and Intensity read rows 2-500 of a separate List sheet, so adding a value there extends the dropdown with no re-setup.
- Conditional formatting that earns its place. The Volume column carries a green gradient, and Easy / Moderate / Hard each get their own fill in the Intensity column.
- lbs or kg. The header says lbs; relabel it, enter kg, and the multiplication still holds.
Workout Log Tracker Pages Explained
Page 1 – Tracker
This is the whole product, really. A dark title banner runs across the top. Under it, the Total Volume Lifted card sits on the left and the four charts run across to the right.
Workout Count by Type is a pie chart that counts sessions by category – in the sample, Strength dominates with 6, then Powerlifting, Cardio and Bodyweight with 2 each, and single sessions of HIIT, Yoga and Mobility. Workout Count by Muscle Group is a donut covering Chest, Back, Legs, Shoulders, Arms, Core, Glutes, Full Body, Cardio and Flexibility, which is the chart that exposes a neglected body part fastest. Total Volume by Exercise is a horizontal bar chart, and it is brutally honest: Leg Press at 12,960 lbs towers over Bicep Curls at 1,080, and every cardio or bodyweight row sits at zero. Calories Burned by Exercise is a column chart driven by the calorie value you record per session.
Below the charts is the log table. Rows 16-30 hold the 15 sample workouts. The calculated columns are worth understanding: Volume is Sets x Reps x Weight, so a 4×8 bench at 135 lbs reads 4,320. Cal / Min is Calories divided by Duration, which is how a 25-minute HIIT Circuit at 340 calories scores 13.6 while a 45-minute Vinyasa Flow scores 4.0. Volume Rank numbers your heaviest sessions 1, 2, 3 and prints a dash on any row with no external load – that dash is intended behaviour, not a broken formula.
Page 2 – How to Use
A printed instruction sheet inside the file. It covers replacing the sample rows, which columns are formulas, adding values to the List tab, and one setup step Google will not let a script do for you: turning the dropdowns into coloured chips. Select column C, then D, then N, then Data – Data validation – click the rule – Advanced options – Display style: Chip. Ten seconds, and the pills in the screenshots appear. Google documents the underlying feature in its Create a drop-down list help page.
Page 3 – List
The source lists for the three dropdowns, editable down to row 500. Add “Kettlebell” or “Calisthenics” as a workout type here and it is immediately selectable in the log.
Page 4 – Explore More Templates
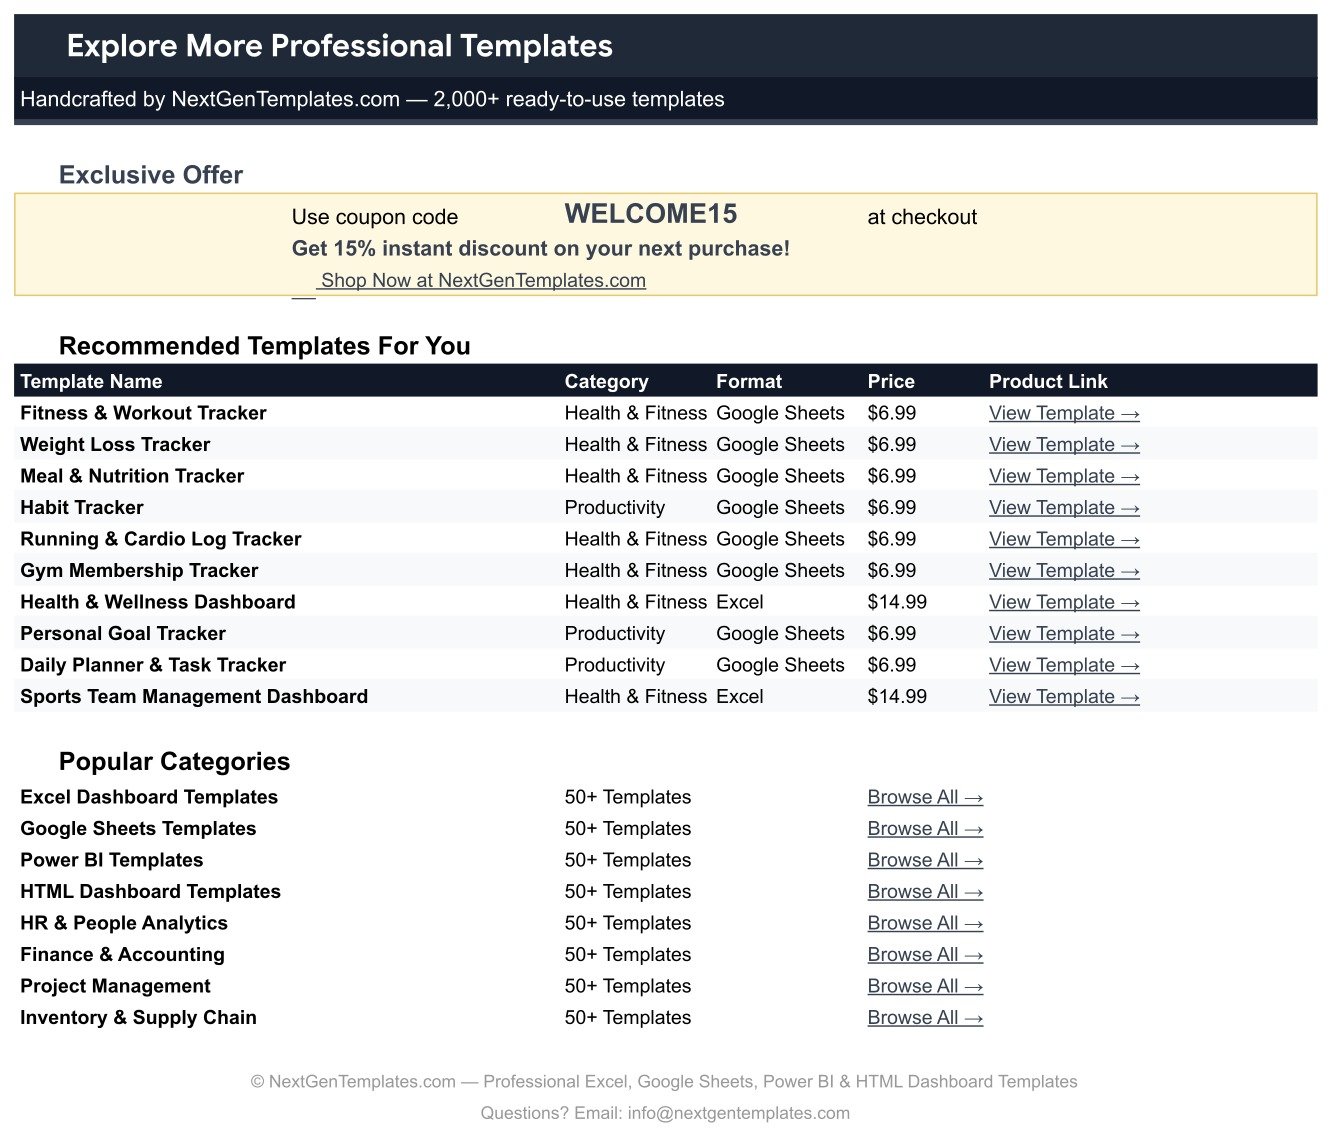
The catalogue page with a WELCOME15 coupon code and links back to the wider template library.
Workout Log Tracker in Google Sheets vs. an Excel Workout Log vs. a Paid Fitness App – Feature Comparison
| What matters | This Google Sheets tracker | Excel workout log | Paid fitness app subscription |
|---|---|---|---|
| Cost | $6.99 once | Free file, but needs an Office licence | Typically $5-$10 per user per month |
| Platform | Google Sheets, any browser | Desktop Excel | Vendor app, phone first |
| Setup time | Under 5 minutes | You build the charts and formulas | Account creation plus onboarding |
| Real-time collaboration | Yes, native sharing | Only via OneDrive co-authoring | Usually a paid coach or team tier |
| Mobile access | Free Google Sheets app | Excel mobile, limited charting | Yes, the app is the product |
| Customisable fields | Every column, dropdown and colour | Yes, if you build it | Limited to what the vendor exposes |
| Share with a link | Yes | File attachment or cloud link | Invite-only inside the app |
| Year-1 cost at 5 users | $6.99 total | Office licences plus build time | Roughly $300-$600 |
| Auto-calculated training volume | Built in, with a rank column | You write the formula | Sometimes, varies by app |
| You own the raw history | Yes, export any time | Yes | Locked to the vendor’s export tools |
Who Should Use This Template
Lifters who want a written record. If your training is structured enough that load and reps matter, this is the cheapest way to keep the numbers somewhere you can chart them.
Hybrid trainers. Anyone whose week mixes barbell work, running, HIIT and mobility, and who wants all of it in one table rather than three apps.
Personal trainers with a handful of clients. One copy of the sheet per client, shared by link. Opening the Workout Count by Muscle Group donut before a session is faster than scrolling a chat history.
Google Drive households. If your budget, meal plan and holiday list are already in Sheets, this drops into the same folder and shares the same permissions model.
It is not for people who want a watch or gym machine to fill the sheet automatically – every row is typed by hand. It also records one row per exercise per session, so per-set logging needs a layout change.
Real-World Use Cases
Marcus, five sessions a week. He logs each exercise as its own row and treats Volume Rank as his monthly scoreboard. When his Deadlift row stops appearing in the top three, he knows the block has stalled without needing to remember what he did in April.
Priya, personal trainer, six clients. Every client gets a copy. She checks the muscle-group donut before writing the next week, and the Notes column – “belt on last 2 sets”, “depth felt solid” – carries the context a number cannot.
Dan, hybrid athlete. Powerlifting on Monday, cycling intervals on Wednesday, Vinyasa on Sunday. The Workout Count by Type pie is the only view that shows him the actual balance of his week rather than the one he imagines.
Advantages of the Workout Log Tracker in Google Sheets
- Nothing to maintain. No hidden helper tables, no pivot caches to refresh. The charts read the columns directly.
- Adding a row is the entire workflow. The KPI card, the ranks and all four charts update the moment the row lands.
- It scales without editing. Formulas and chart ranges already cover rows 16-1000.
- The data is yours. Export to CSV, pull it into Looker Studio, or hand it to a coach. No vendor export queue.
- Free to run. Google Sheets costs nothing, works in any browser, and syncs to the mobile app automatically.
- Genuinely editable. The colour palette lives in a single const block, and the dropdown lists are yours to rewrite.
Opportunities for Improvement
Being straight about the gaps: there is no date filter. The KPI card and the charts read the whole log, so at 200 sessions you are looking at lifetime totals rather than this month’s. Adding a helper column for month and a slicer is a reasonable weekend upgrade.
Per-set logging is not supported out of the box. One row covers one exercise in one session, so a top set and back-off sets get averaged into a single weight. Lifters running heavy singles will want to split rows.
Calories are typed, not calculated. The sheet records the figure you supply – from a watch, a machine readout, or an estimate – and does no physiology of its own.
The chip display step is manual. Google Apps Script cannot set the chip display style yet, so the ten-second Data validation step on page 2 is unavoidable on a fresh copy.
Best Practices
- Log the same day. A row typed on the drive home is accurate; one reconstructed on Friday is fiction.
- Keep the workout types short. Seven categories chart well. Twenty-five turn the pie into confetti.
- Use Notes for context, not numbers. Numbers belong in columns so the charts can see them.
- Do the chip step once, immediately. It takes ten seconds on a fresh copy and makes the log far quicker to scan.
- Duplicate the tab yearly. Keep 2026 and 2027 as separate tabs if you want the KPI card to mean “this year”.
- Add values to the List tab, never to the cell. Typing straight into a dropdown cell breaks the validation; adding to the List tab keeps it clean. Google explains chart ranges in its Add and edit a chart guide if you extend past row 1000.
Explore Relevant Templates
- Gym Personal Records (PR) Tracker in Google Sheets – the natural companion, for one-rep maxes and lift milestones.
- Weight Loss Tracker in Google Sheets – body weight and measurements alongside the training log.
- Gym Membership Tracker in Google Sheets – for running the gym rather than training in it.
- Fitness and Wellness Dashboard in Google Sheets – a multi-page dashboard when one page stops being enough.
- Sports and Recreation Dashboard in Google Sheets – club and facility level reporting.
Want to build skills like this step by step? The NextGenTemplates Academy learning paths cover the spreadsheet fundamentals behind trackers like this, with practice files.
Get the Workout Log Tracker in Google Sheets
Frequently Asked Questions
What exactly do I download?
A PDF containing a Make a copy link. Clicking it places an editable Google Sheet in your own Drive. You need a Google account; Google Sheets itself is free.
How many sessions can I record?
Formulas and chart ranges cover rows 16-1000, roughly 985 sessions. Beyond that, copy the formulas down and widen the chart ranges.
Can I work in kilograms?
Yes. Relabel the Weight (lbs) header and enter kg values. Volume is a plain multiplication, so every figure stays correct – just read the KPI card as kg.
Why is Volume Rank blank on my cardio rows?
Because there is no external load, volume is 0 and the rank is deliberately replaced with a dash. Pull-ups, plank series and runs all behave this way.
Do the charts really update on their own?
Yes. They read the data columns with the built-in Aggregate option across rows 16-1000, so a new row shows up immediately. No refresh, no re-linking.
Can I share it with a coach?
Yes – it is a standard Google Sheet. Use Share and grant view or edit access by link.
Does it give training or nutrition advice?
No. It is a record-keeping tool. It stores and charts the numbers you enter and makes no recommendations about how you should train or eat.
About the Author
Built by PK – Microsoft Certified Professional with 15+ years of Excel, Google Sheets, and Power BI experience. Founder of NextGenTemplates, reaching 300K+ subscribers across YouTube channels. Every template is hand-built and tested before release.
Conclusion
The Workout Log Tracker in Google Sheets is deliberately small: one page, one KPI, four charts and a table you actually type into. That constraint is the point – there is nothing to configure, nothing to break, and no monthly fee attached to your own training history. Log the sessions, and the volume totals, muscle-group balance and calorie comparisons build themselves.
Get the Workout Log Tracker in Google Sheets for $6.99 (regular $12.99) – instant download, one-time payment, yours to edit forever.
For video walkthroughs of Google Sheets templates like this one, subscribe at youtube.com/@NeoTechNavigators.