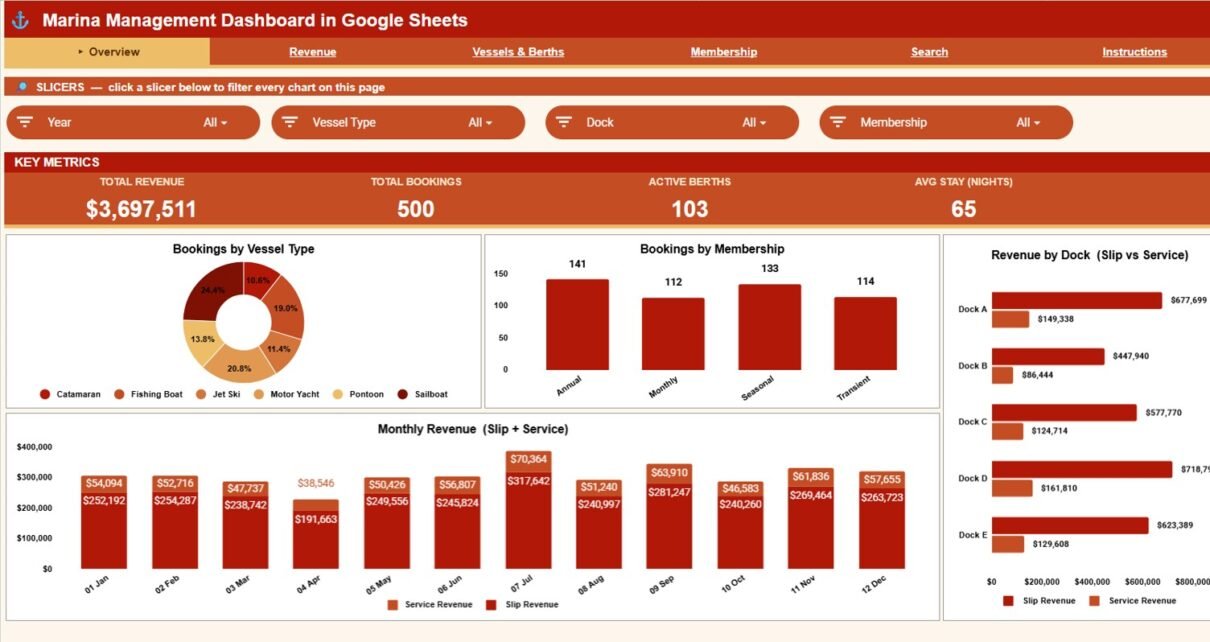
A full walkthrough of the Marina Management Dashboard in Google Sheets — 4 KPIs, 16 charts, a Search tab, and a single Data tab to track slip bookings, berth occupancy, and revenue without marina SaaS.
Online Tutorial for Data Analysis and Automation
Google-Sheets-Dashboard
A full walkthrough of the Marina Management Dashboard in Google Sheets — 4 KPIs, 16 charts, a Search tab, and a single Data tab to track slip bookings, berth occupancy, and revenue without marina SaaS.
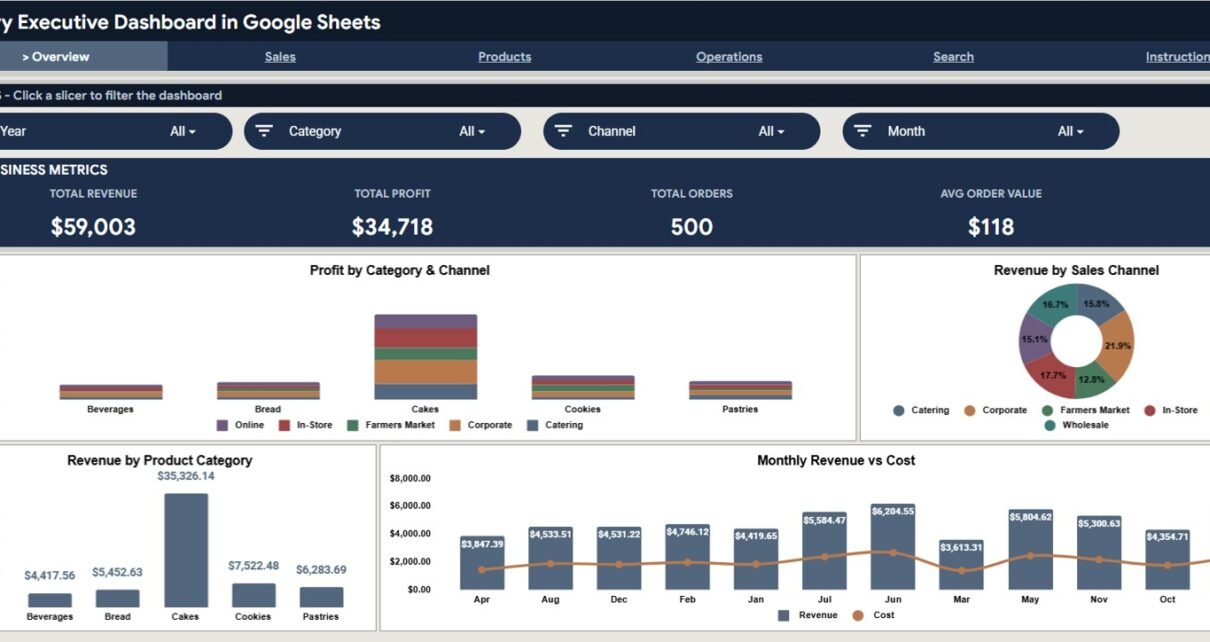
A Google Sheets bakery dashboard that tracks revenue, profit, orders and average order value across 4 interactive pages with 16 charts, slicers and an order Search tab.
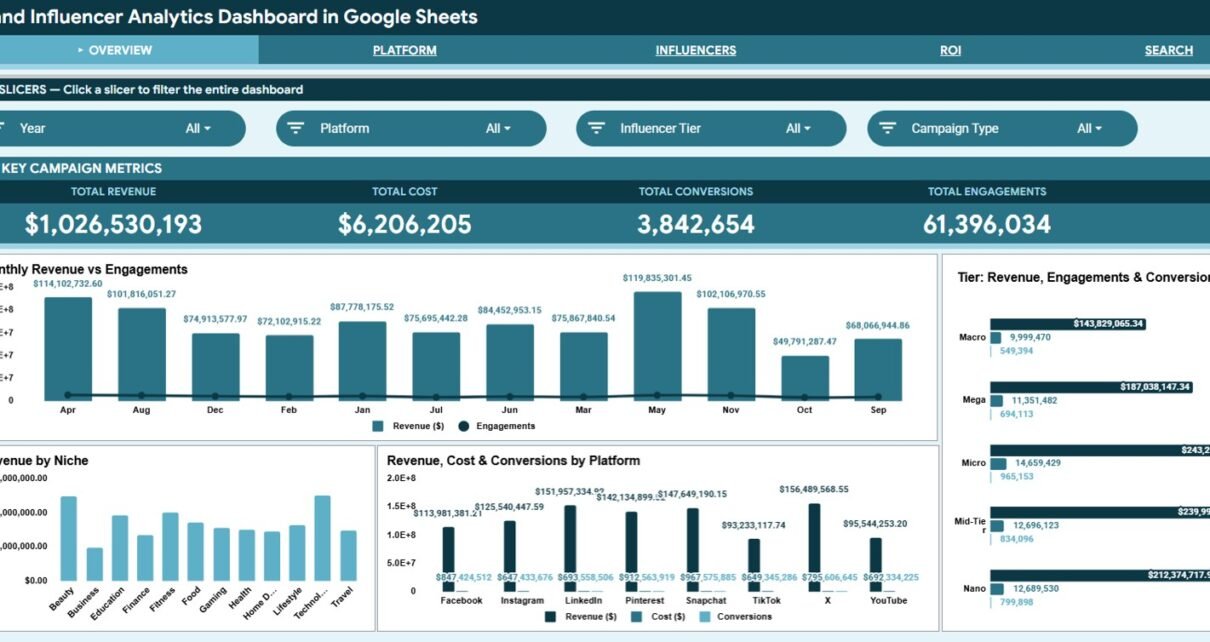
Track influencer campaign revenue, cost, conversions and engagements in Google Sheets with 4 KPI cards, 14 charts, slicers and a campaign lookup.
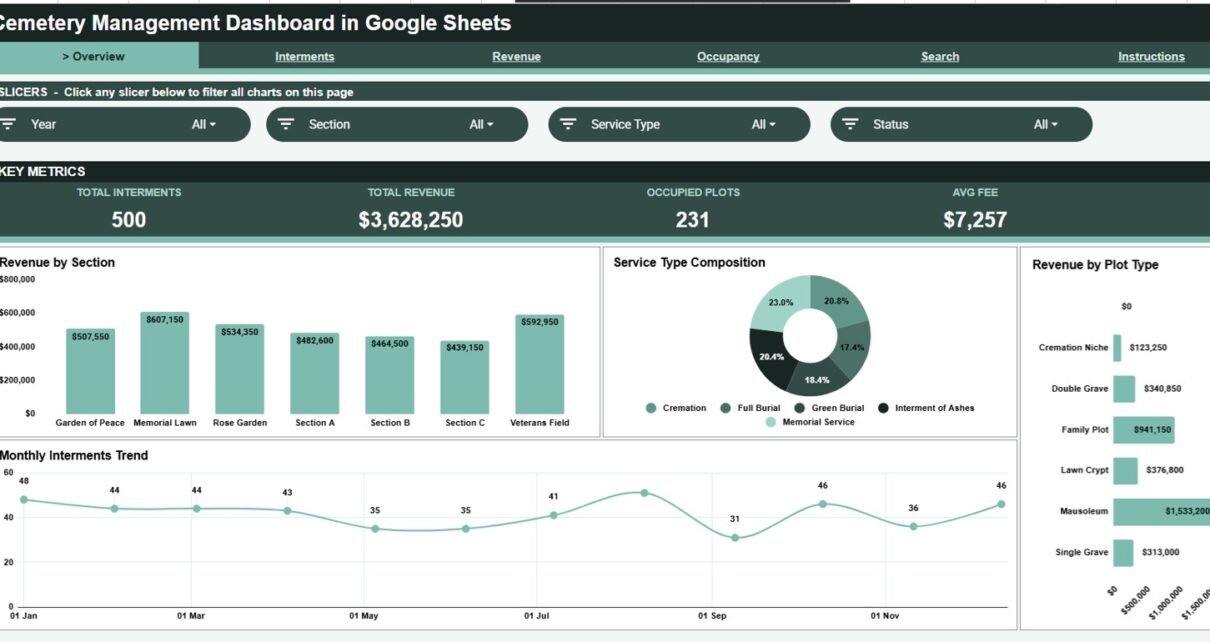
Cemetery Management Dashboard in Google Sheets — track interments, revenue, and plot occupancy with 4 KPIs and 16 charts across 5 interactive pages, a Data sheet, and a Search tab. One-time $9.99, runs in any browser.
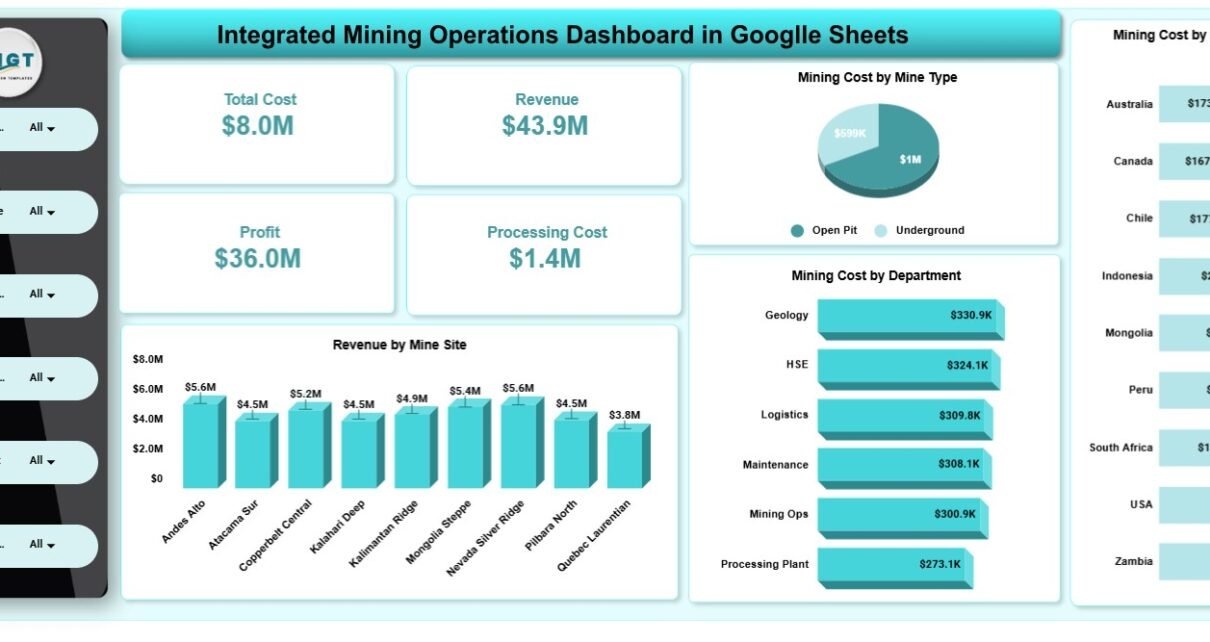
A connected Google Sheets dashboard with 4 KPI cards, 20 charts and 5 slicer-driven pages covering mining production, downtime, safety, ESG and profitability.
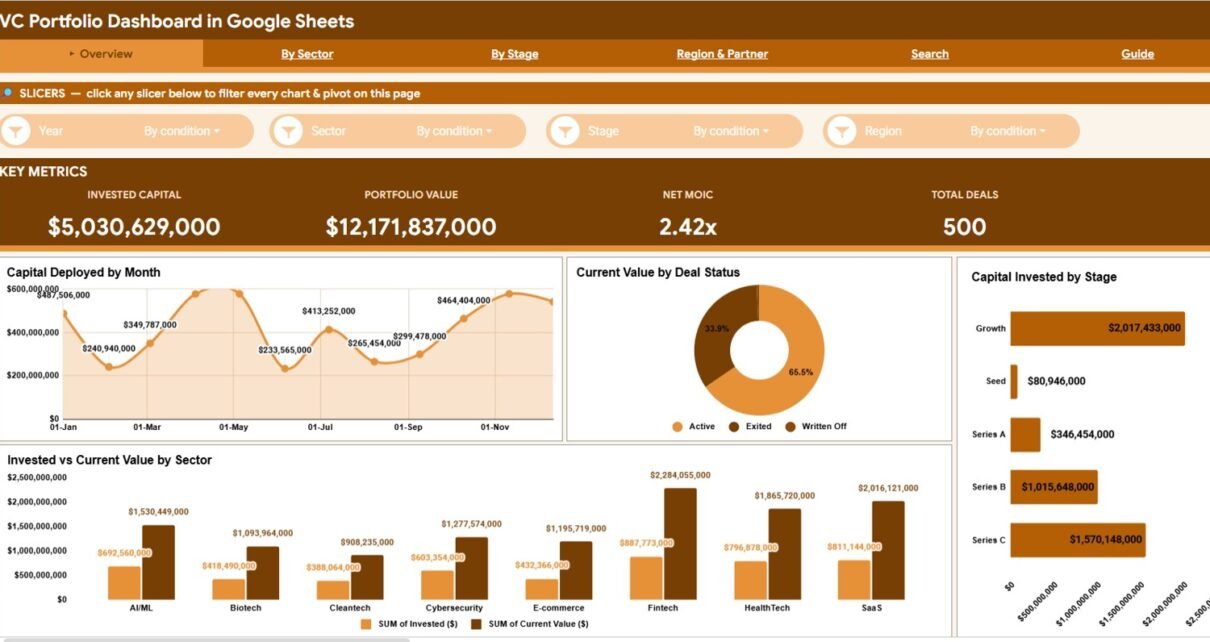
A VC Portfolio Dashboard in Google Sheets that tracks Invested Capital, Portfolio Value, Net MOIC and Total Deals across 6 connected tabs and 16 charts — a one-time alternative to per-seat fund software.
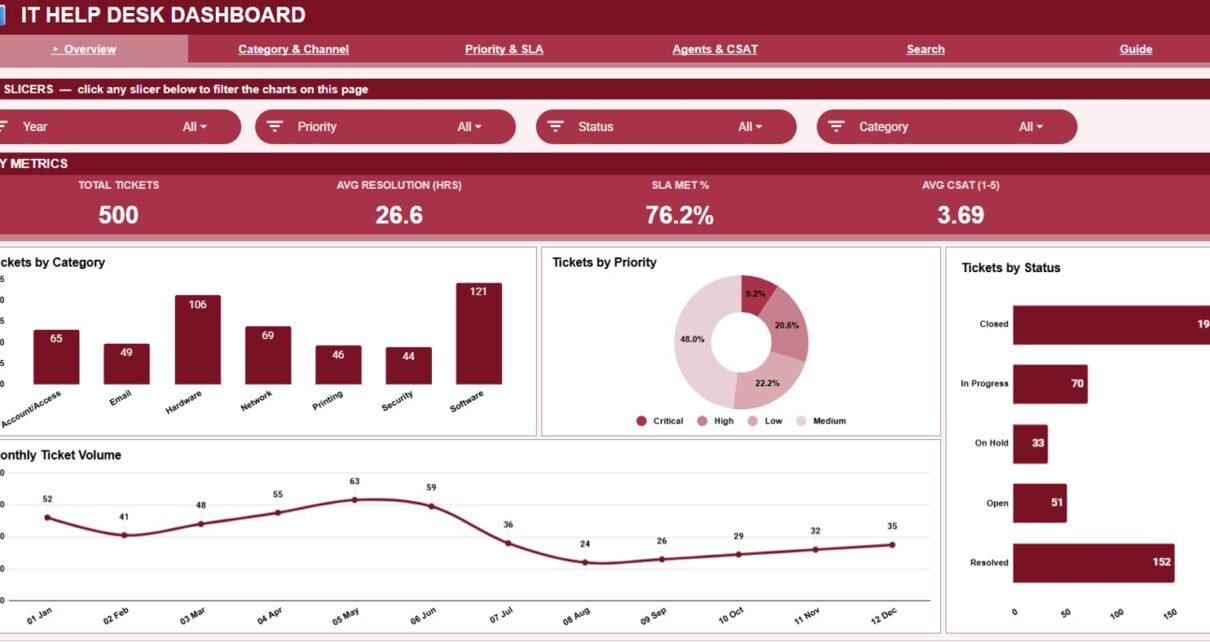
A Google Sheets IT help-desk dashboard with 4 KPIs, 16 charts, SLA % and CSAT across 6 tabs — filter with slicers and search any ticket. One-time $9.99.
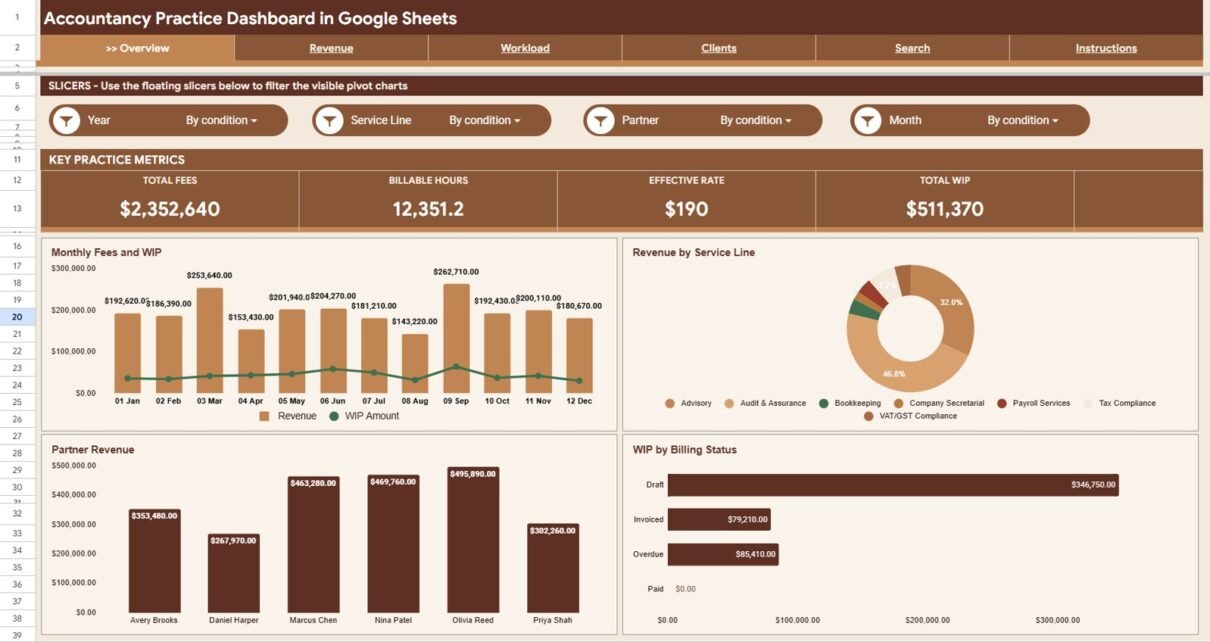
Track Total Fees, Billable Hours, Effective Rate, and Total WIP across 5 analysis pages with slicer filtering, Engagement ID lookup, and a structured data sheet. Built for accounting firms, CPA practices, and professional services teams. $9.99 one-time, no subscription.
Track church income, expenses, funds, vendors, payment methods, and transaction lookup in a Google Sheets dashboard with slicers for finance reviews.
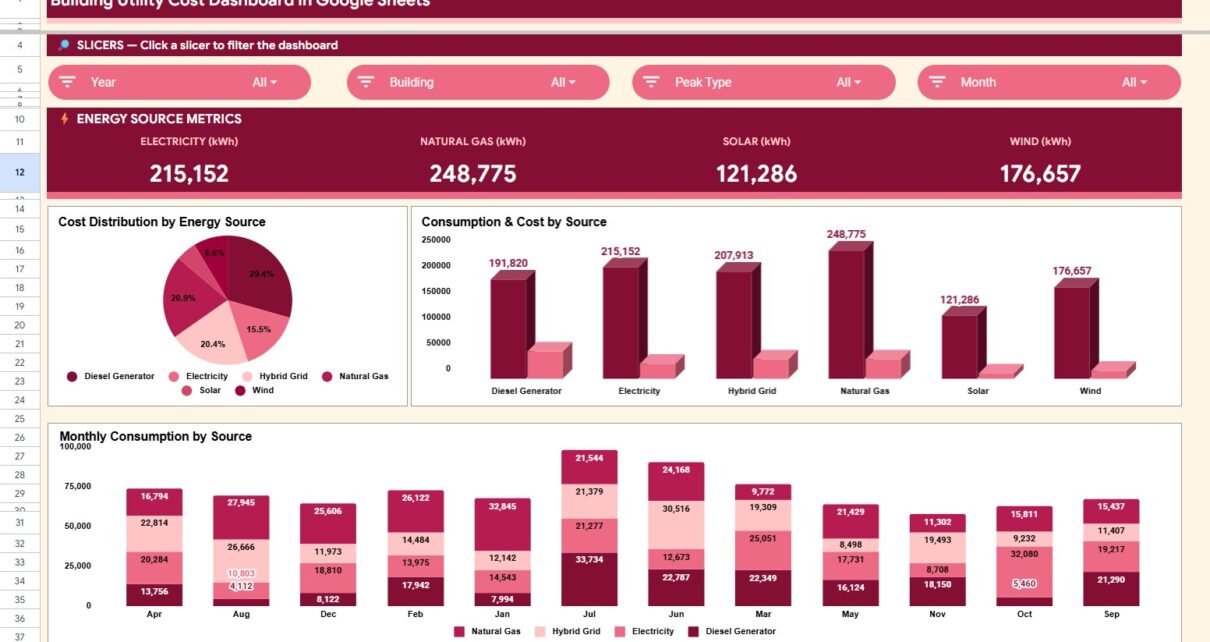
Track building utility costs in Google Sheets with Overview, Building Energy, Energy Source, Monthly Trends, Search Sheet, and Data Sheet tabs.