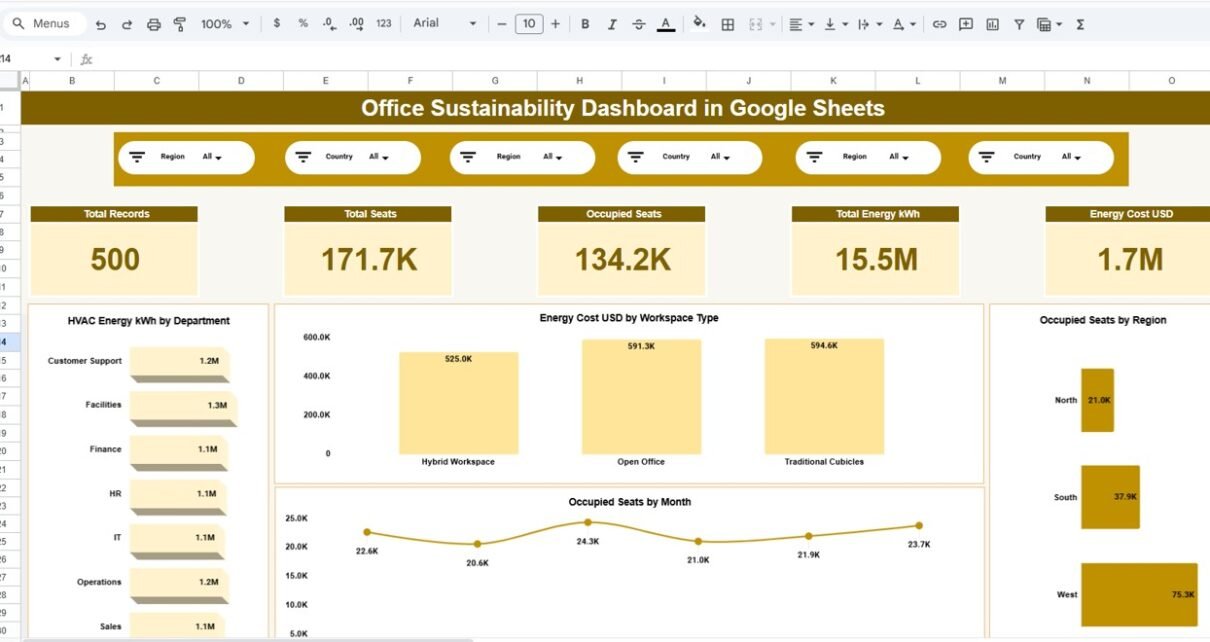
Organizations today face increasing pressure to reduce operational costs, optimize workspace utilization, and meet sustainability goals. However, sustainability data often remains scattered across spreadsheets, utility bills, and manual reports. As a result, tracking energy usage, water consumption, occupancy, and environmental impact becomes time-consuming and ineffective. That is exactly why the Office Sustainability Dashboard in Google […]
Google Sheets
Electric Vehicle KPI Dashboard in Google Sheets
The electric vehicle (EV) industry is growing rapidly. As governments push for sustainability and businesses shift toward clean mobility, tracking electric vehicle performance has become more important than ever. However, managing EV data across multiple spreadsheets often leads to confusion, delays, and poor decisions. That is why an Electric Vehicle KPI Dashboard in Google Sheets […]
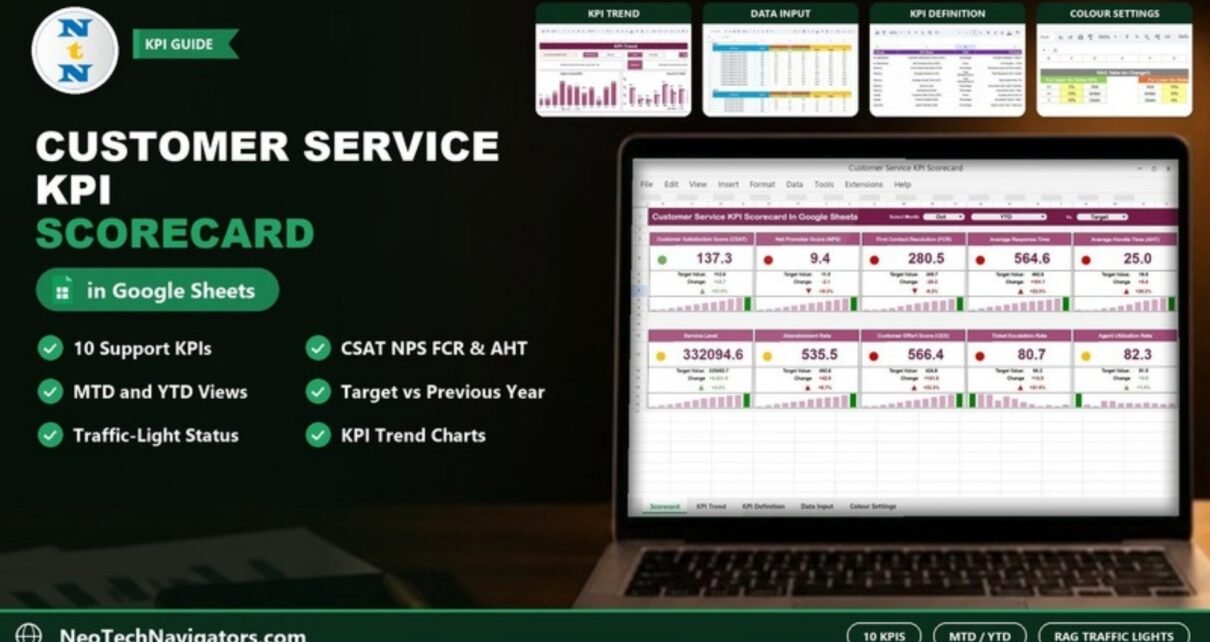
Customer Service KPI Scorecard in Google Sheets
A Customer Service KPI Scorecard in Google Sheets with 10 KPIs such as CSAT, NPS, FCR and AHT, MTD/YTD views, traffic lights against target and a KPI trend sheet.
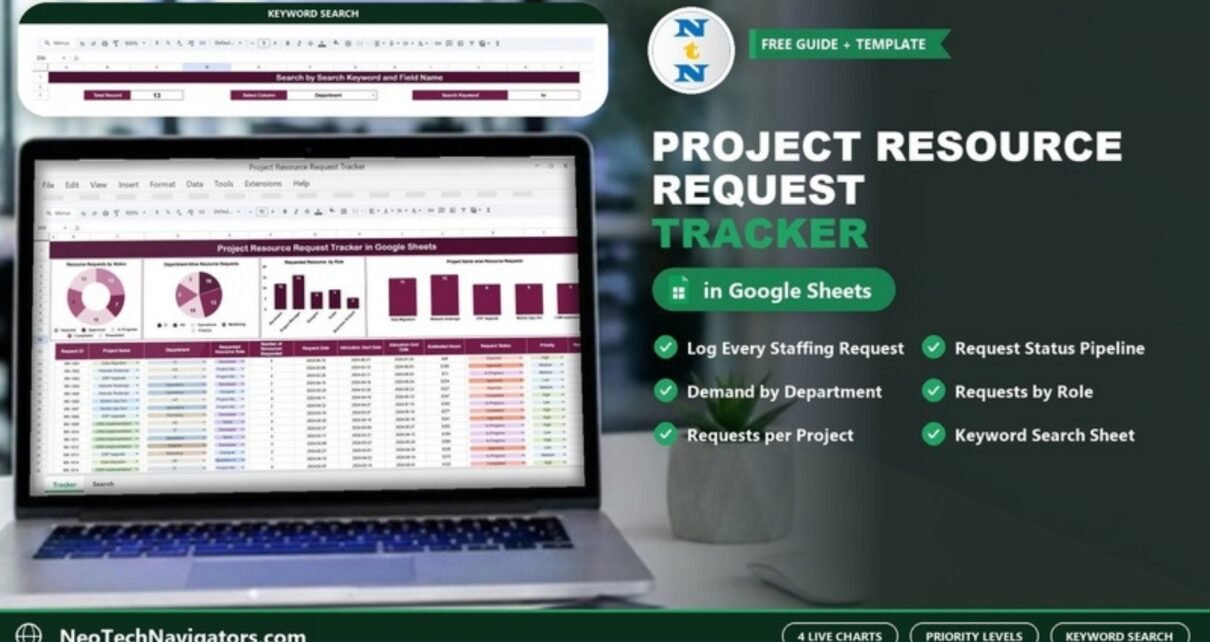
Project Resource Request Tracker in Google Sheets
Log project resource requests by project, department, role, dates, hours and priority in Google Sheets, with charts for status, department, role and project demand.
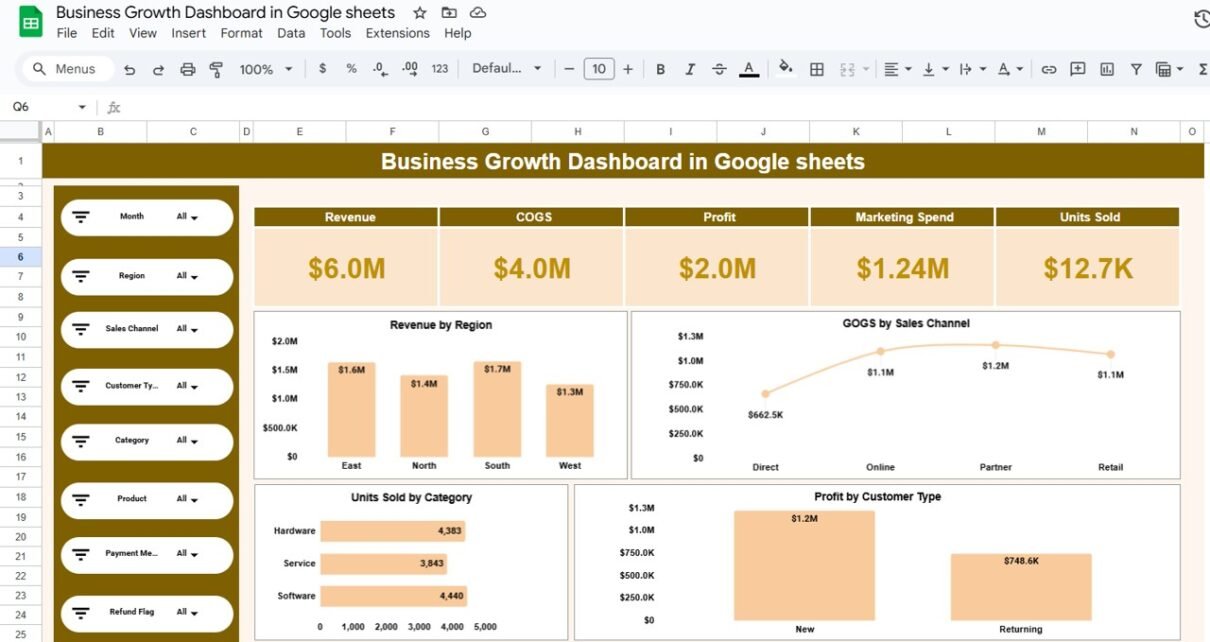
Business Growth Dashboard in Google sheets
Business growth does not happen by chance. It requires clear visibility into revenue, costs, profit, sales channels, and customer behavior. However, many businesses still rely on scattered spreadsheets and manual reports. As a result, decision-making becomes slow and reactive. Therefore, a Business Growth Dashboard in Google Sheets becomes an essential solution. It transforms raw business […]
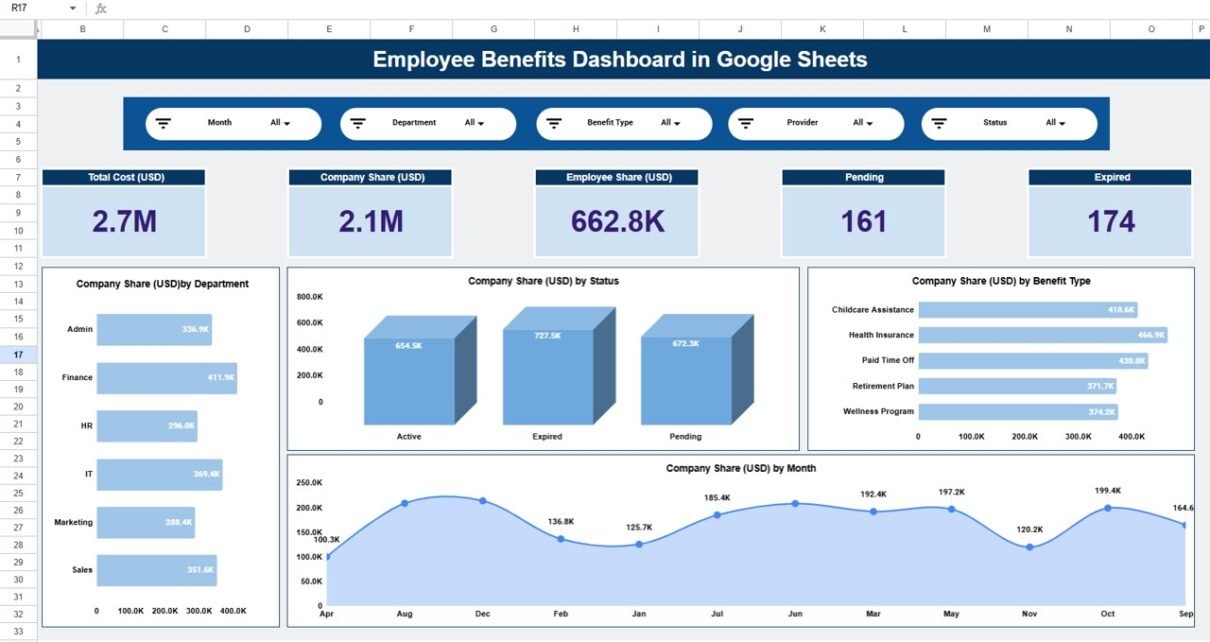
Employee Benefits Dashboard in Google Sheets
Employee benefits play a critical role in attracting, retaining, and motivating talent. However, managing benefits data across departments, providers, benefit types, and months can quickly become complex. Therefore, organizations need a centralized, visual, and easy-to-use system to monitor benefits cost, participation, and trends. The Employee Benefits Dashboard in Google Sheets is a ready-to-use HR analytics […]
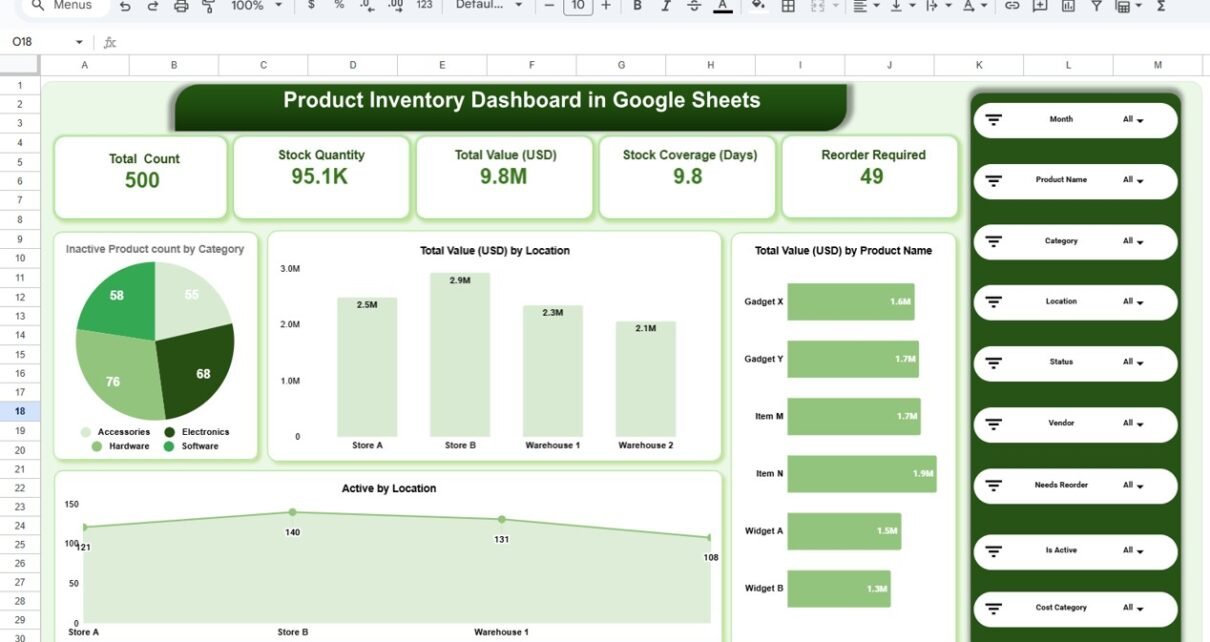
Product Inventory Dashboard in Google Sheets
Managing inventory without clear visibility leads to stockouts, overstocking, and cash flow issues. Therefore, businesses need a simple, visual, and data-driven system to monitor inventory performance. The Product Inventory Dashboard in Google Sheets is a ready-to-use solution that helps you track stock levels, inventory value, reorder requirements, and trends across categories, locations, vendors, and time. […]
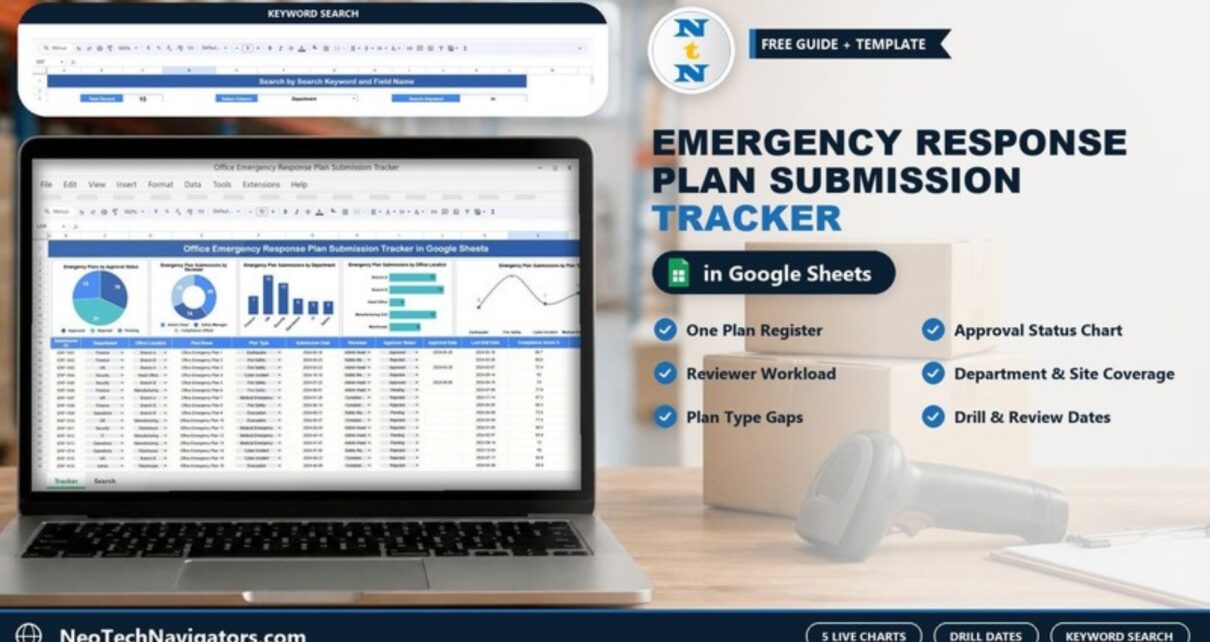
Office Emergency Response Plan Submission Tracker in Google Sheets
Track emergency response plan submissions, reviews, approvals, drill dates and review due dates across departments and sites in one Google Sheets register with five charts.
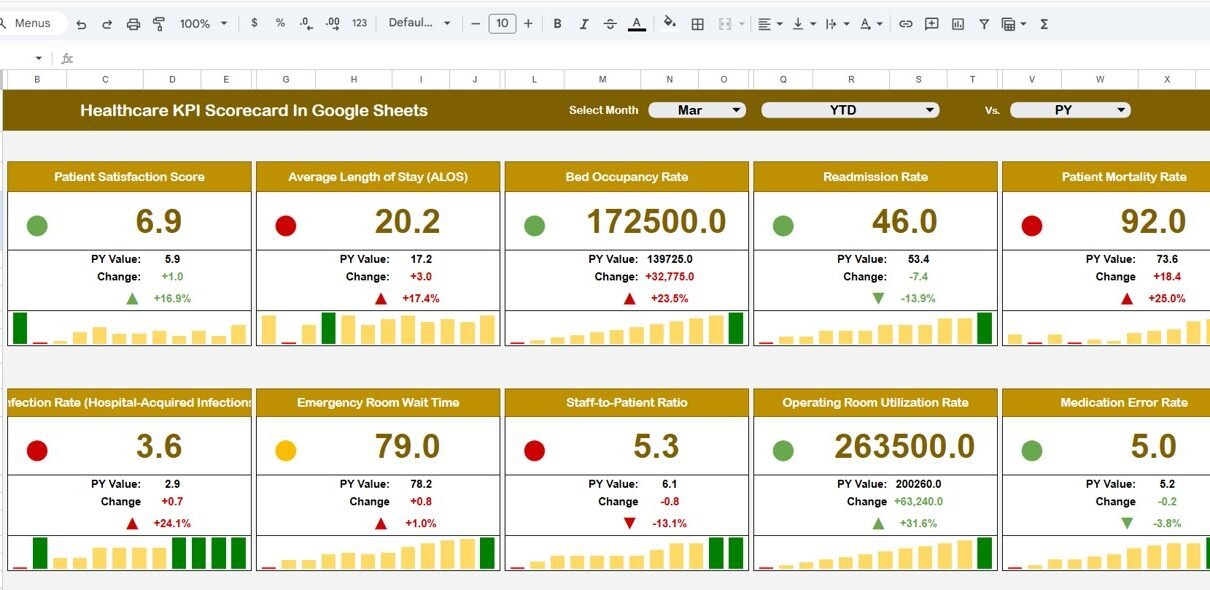
Healthcare KPI Scorecard In Google Sheets
Healthcare organizations operate in a highly complex environment where quality of care, operational efficiency, and cost control must work together. However, tracking performance across departments, services, and time periods often becomes difficult when data is scattered across multiple files. To solve this challenge, the Healthcare KPI Scorecard in Google Sheets provides a ready-to-use, centralized, and […]
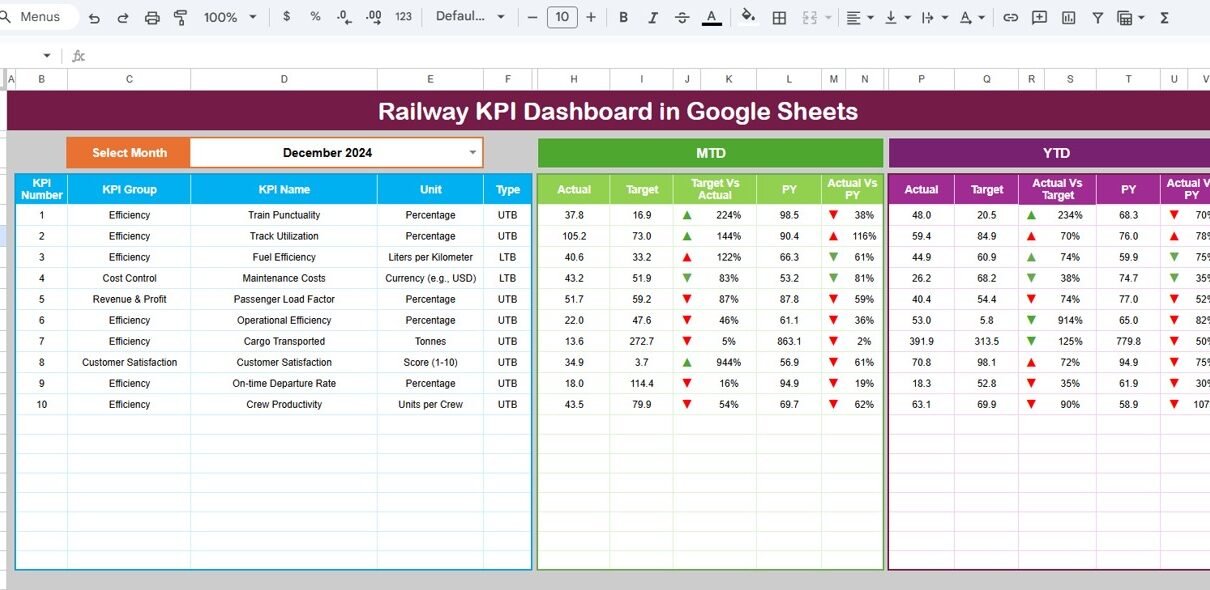
Railway KPI Dashboard in Google Sheets
Railway operations involve complex processes such as train punctuality, safety, asset utilization, passenger services, and operational efficiency. Managing these activities without a structured KPI system often leads to delays, cost overruns, and reduced service quality. That is exactly why a Railway KPI Dashboard in Google Sheets becomes a powerful performance monitoring solution. Get the Railway […]