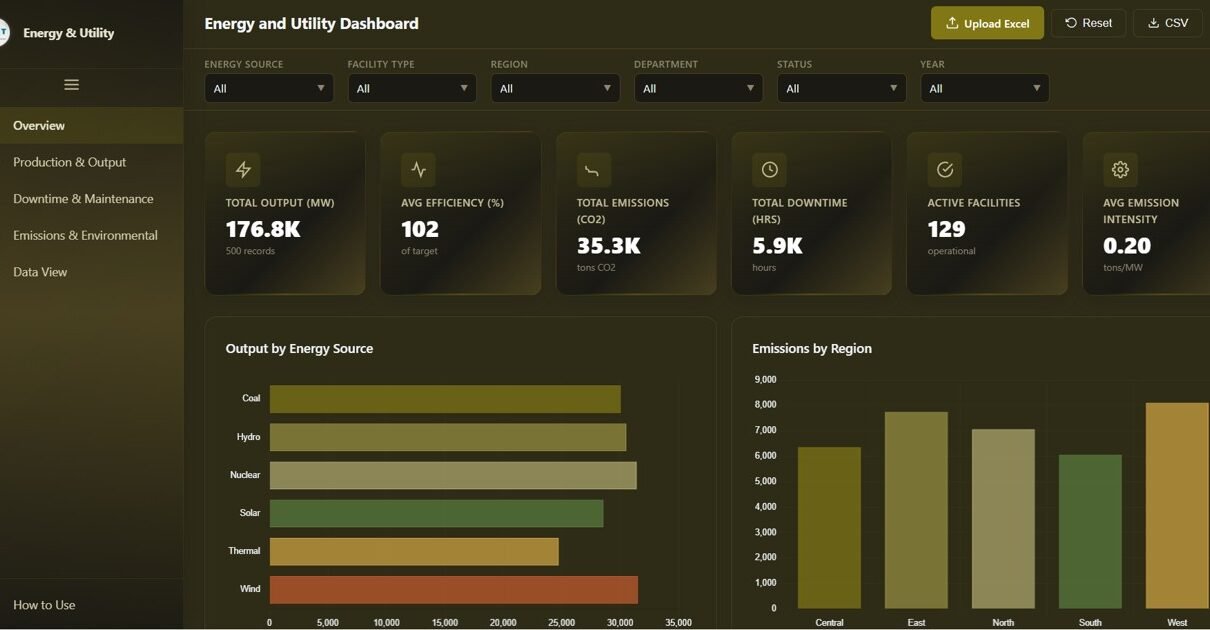
Track energy output, emissions, efficiency, and facility downtime with this interactive Energy and Utility Dashboard in HTML. Features five analysis pages with dynamic KPI cards, filters, charts, and CSV export.
Online Tutorial for Data Analysis and Automation
HTML Dashboard
Track energy output, emissions, efficiency, and facility downtime with this interactive Energy and Utility Dashboard in HTML. Features five analysis pages with dynamic KPI cards, filters, charts, and CSV export.
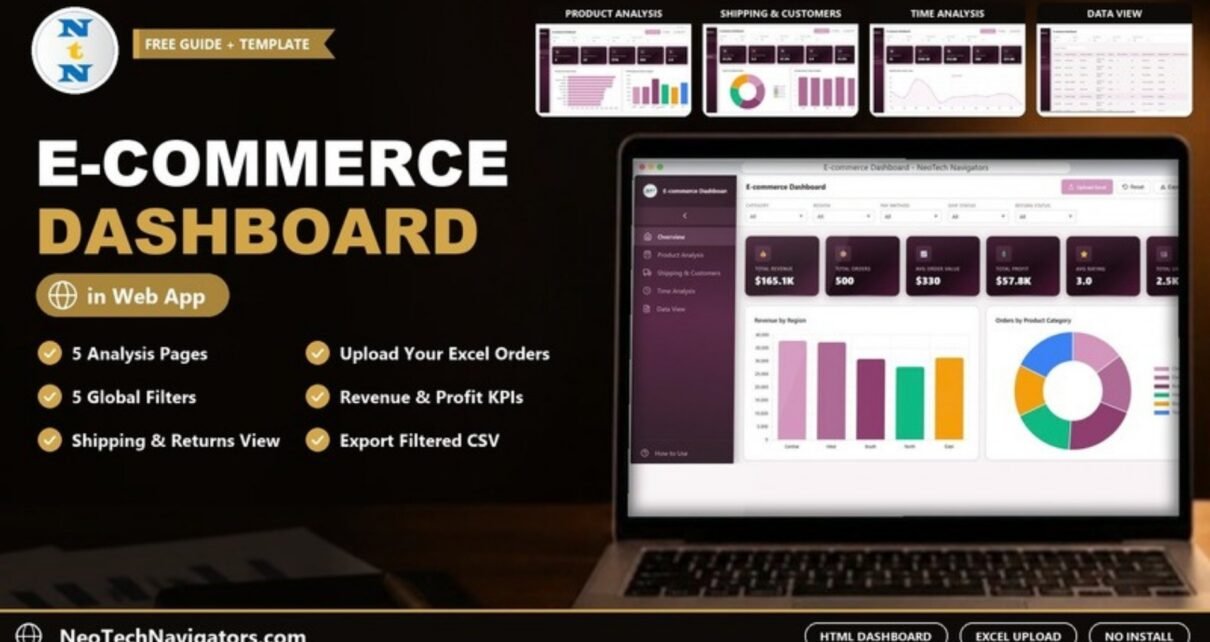
A browser-based E-commerce Dashboard in HTML with five pages, global filters, Excel upload and CSV export to track revenue, products, shipping, returns and monthly trends.
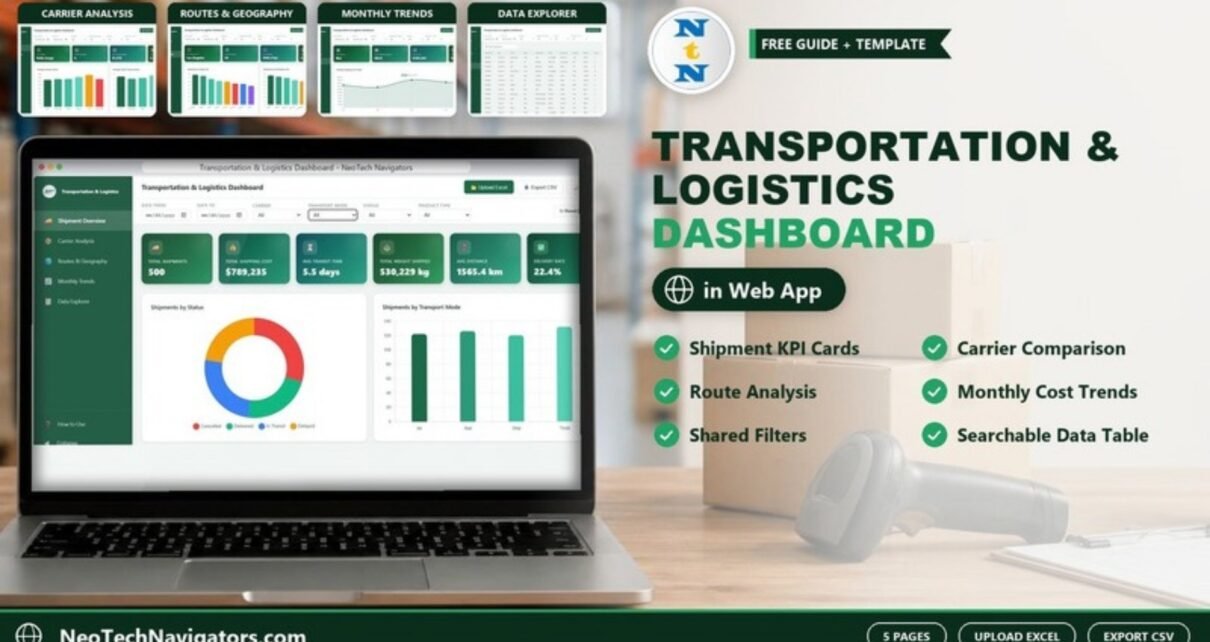
A browser-based Transportation and Logistics Dashboard in HTML with five pages for shipments, carriers, routes, monthly trends and a searchable data table. Upload your Excel shipment data, filter by carrier, mode, status or product type, and export to CSV.
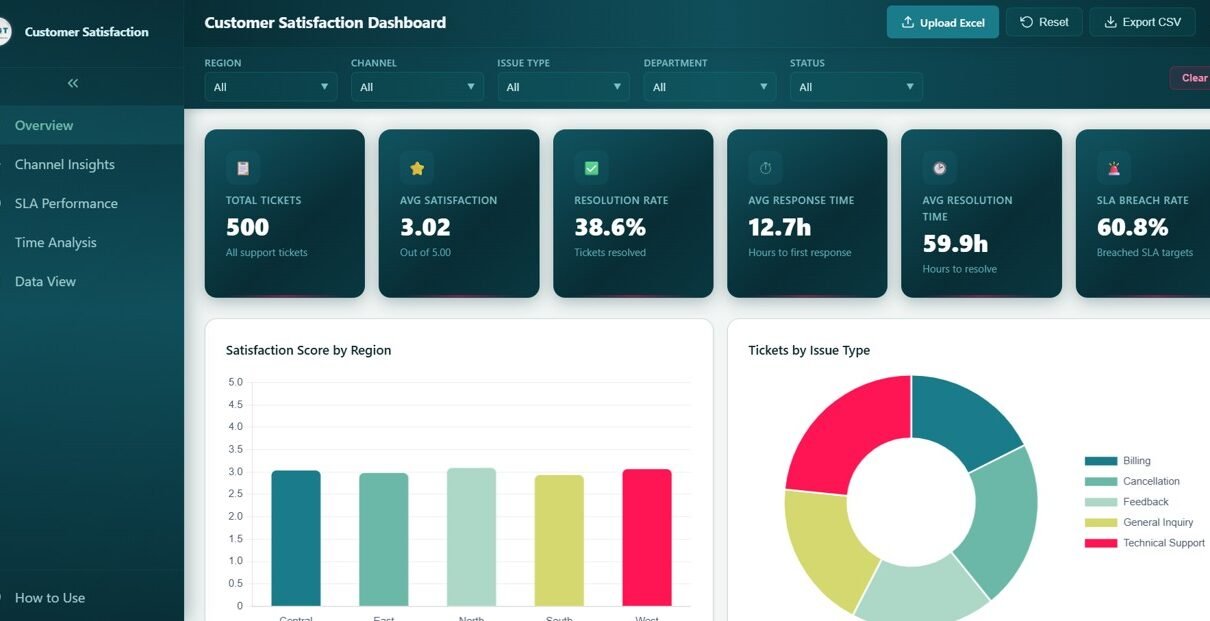
Customer Satisfaction Dashboard in HTML is an interactive, browser-based analytics template to track CSAT scores, NPS, resolution times, and feedback trends with dynamic charts and smart filters.
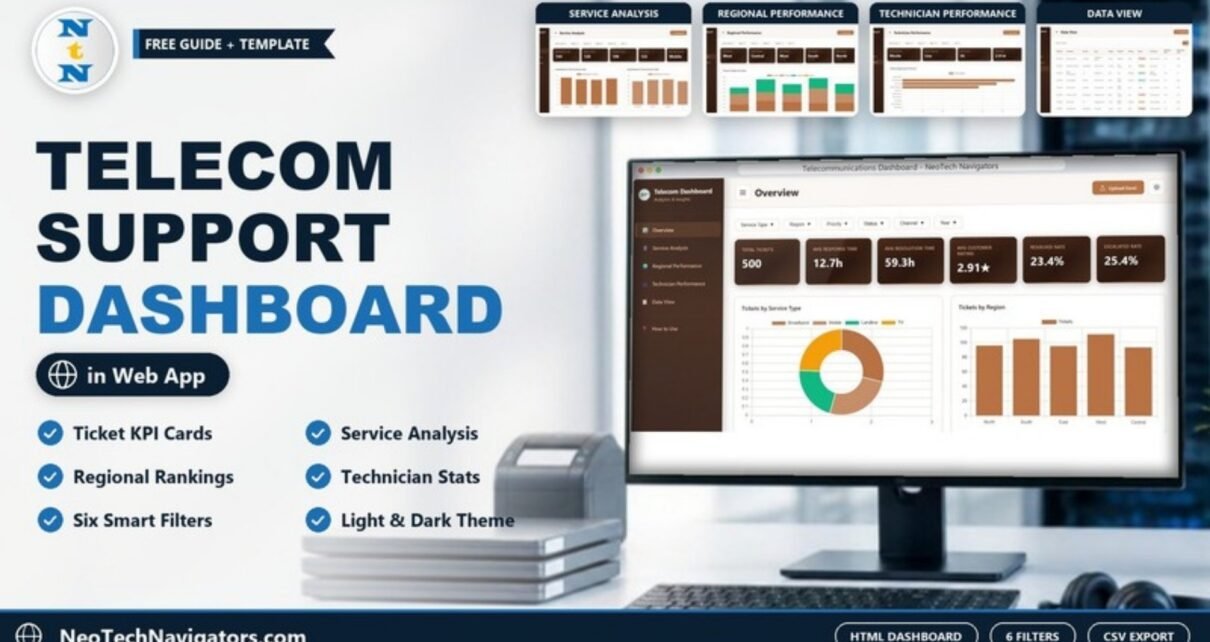
A browser-based telecom support dashboard with KPI cards, service, regional and technician analysis, six filters and a searchable ticket table with CSV export.
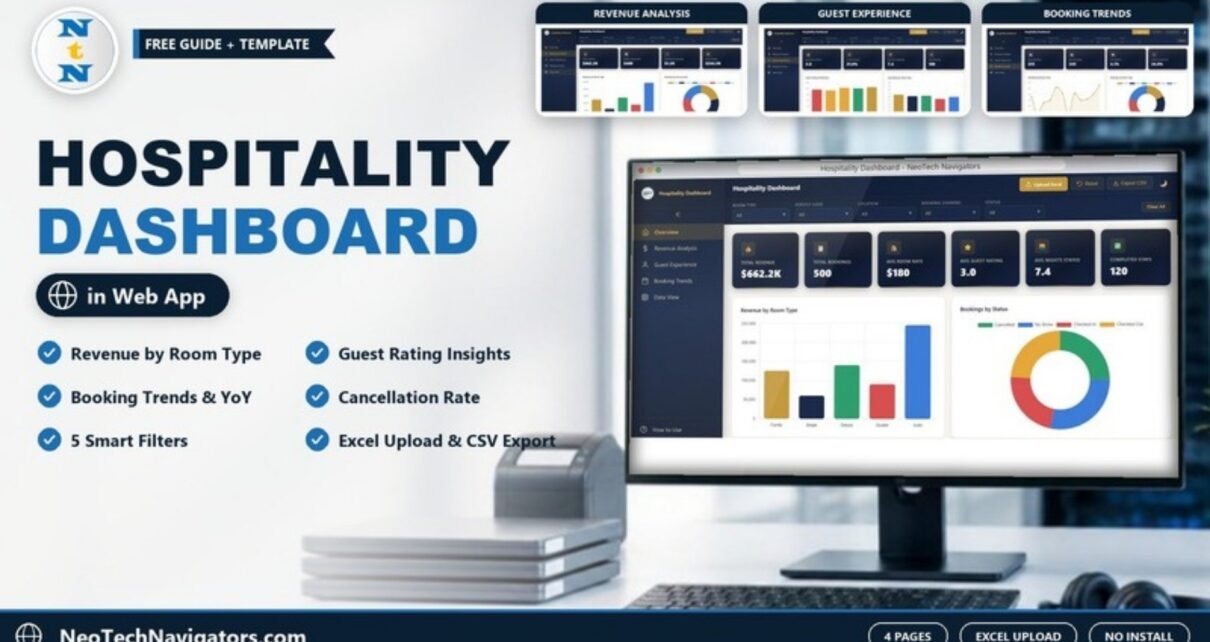
A browser-based hospitality dashboard with Overview, Revenue Analysis, Guest Experience, Booking Trends and Data View pages, five filters, Excel upload and CSV export, built for hotel and resort teams.
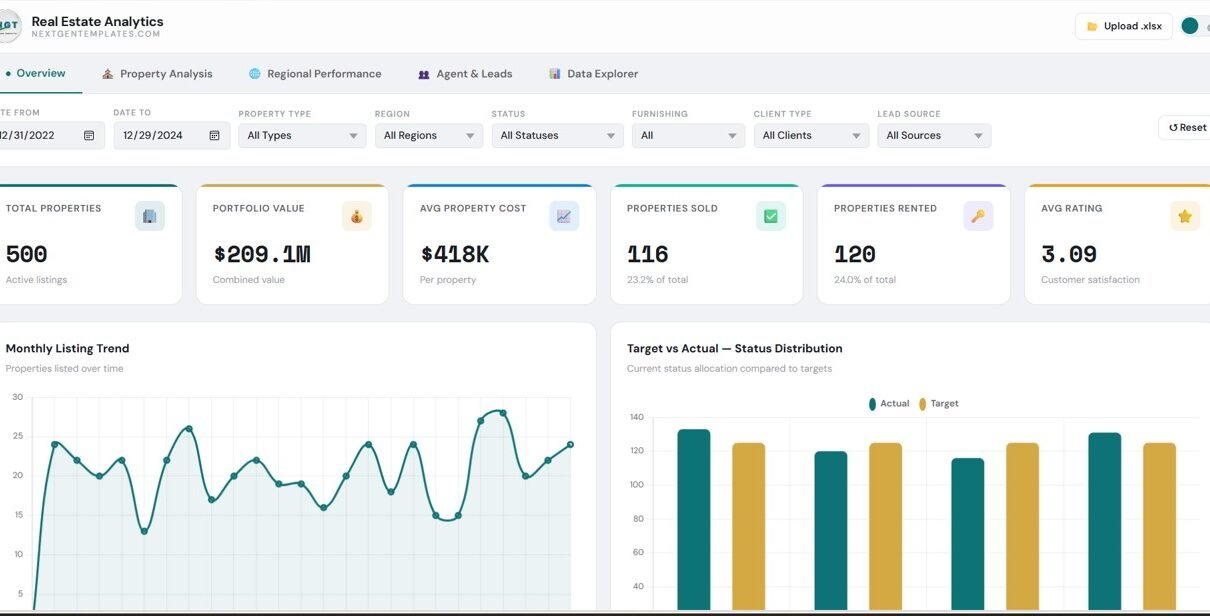
In today’s fast-paced real estate industry, data plays a critical role in decision-making. From tracking property listings and analyzing regional performance to managing agents and monitoring leads, businesses handle large volumes of data daily. However, when this data stays scattered across spreadsheets, it becomes difficult to analyze and act quickly. So, how can real estate […]
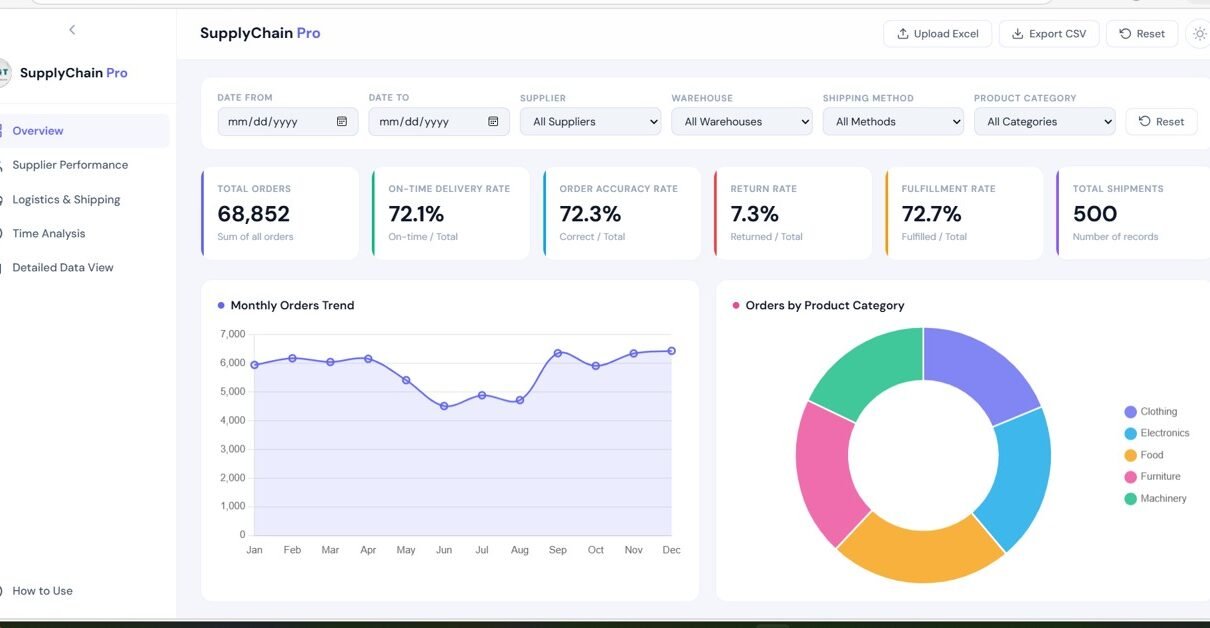
In today’s fast-paced business environment, managing supply chain operations efficiently is more important than ever. Companies deal with multiple suppliers, warehouses, shipping methods, and product categories. However, when this data is scattered across spreadsheets, it becomes difficult to gain meaningful insights. That’s exactly where the Supply Chain Analytics Dashboard in HTML comes in. This powerful, […]
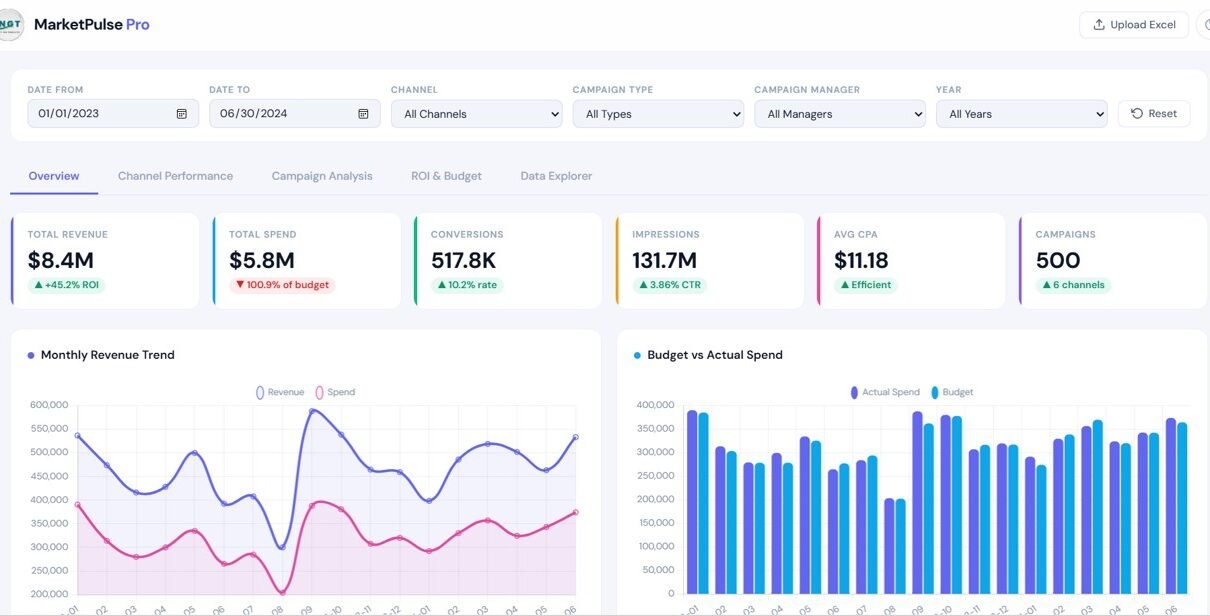
Managing digital marketing performance across multiple channels can become difficult when data is spread across spreadsheets, ads platforms, analytics tools, and campaign reports. As a result, marketing teams often struggle to track revenue, spend, conversions, impressions, and campaign performance in one place. Therefore, businesses now prefer interactive dashboards that turn marketing data into clear and […]
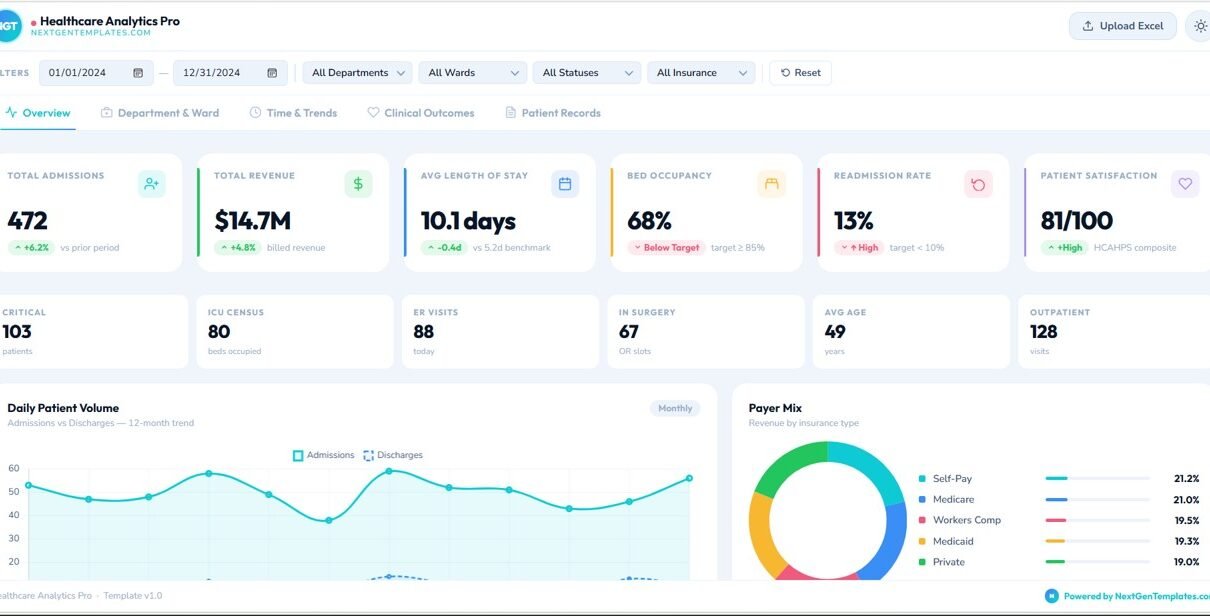
Healthcare organizations generate massive amounts of operational, financial, and patient data every day. Hospitals track admissions, discharges, patient outcomes, department performance, insurance billing, patient satisfaction, and many more metrics. However, when this information stays scattered across systems and spreadsheets, decision-makers struggle to analyze it quickly. Therefore, healthcare institutions increasingly rely on analytics dashboards to transform […]