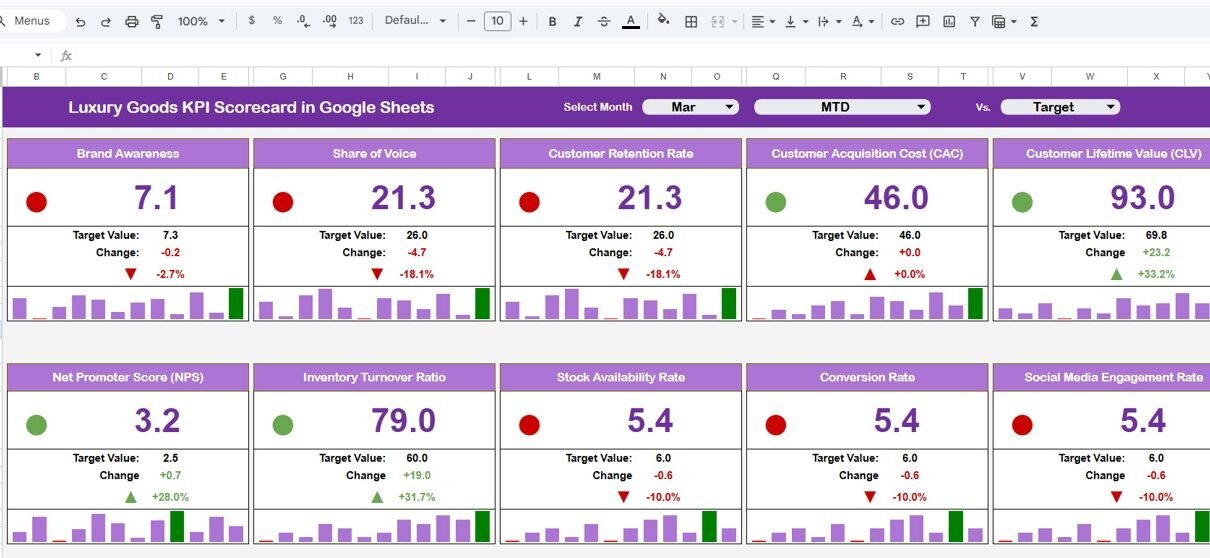
Track luxury brand KPIs in Google Sheets with MTD/YTD analysis, trend charts, and conditional formatting. This ready-to-use scorecard covers sales, marketing, customer experience, and operations metrics across 4 interactive worksheets.
Online Tutorial for Data Analysis and Automation
Track luxury brand KPIs in Google Sheets with MTD/YTD analysis, trend charts, and conditional formatting. This ready-to-use scorecard covers sales, marketing, customer experience, and operations metrics across 4 interactive worksheets.
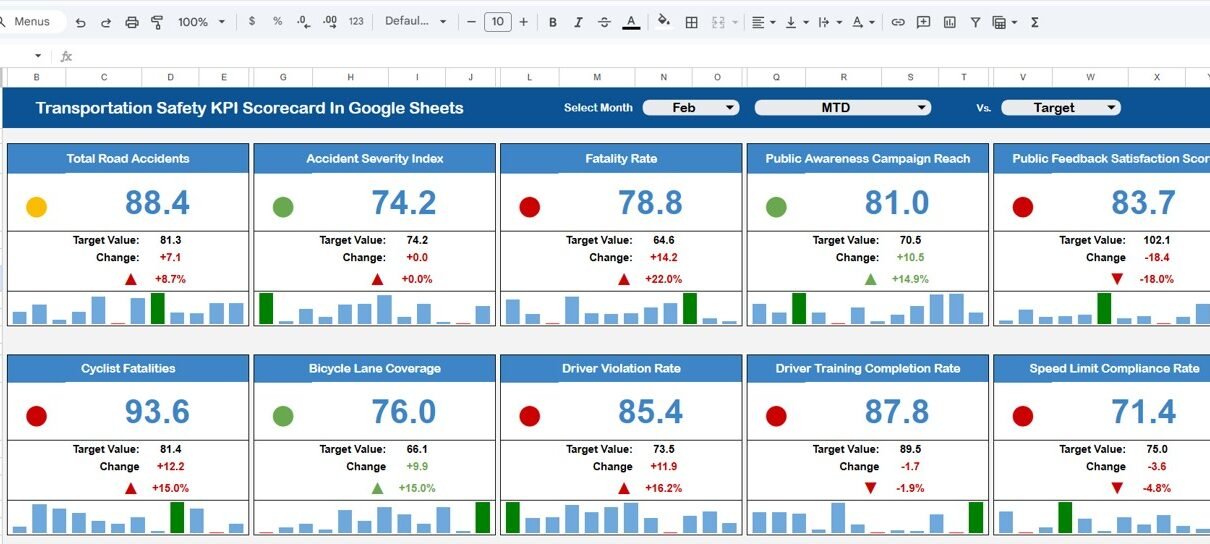
Track 10 transportation safety KPIs with automated MTD/YTD calculations, traffic light indicators, and trend analysis charts using this ready-to-use Google Sheets scorecard template.
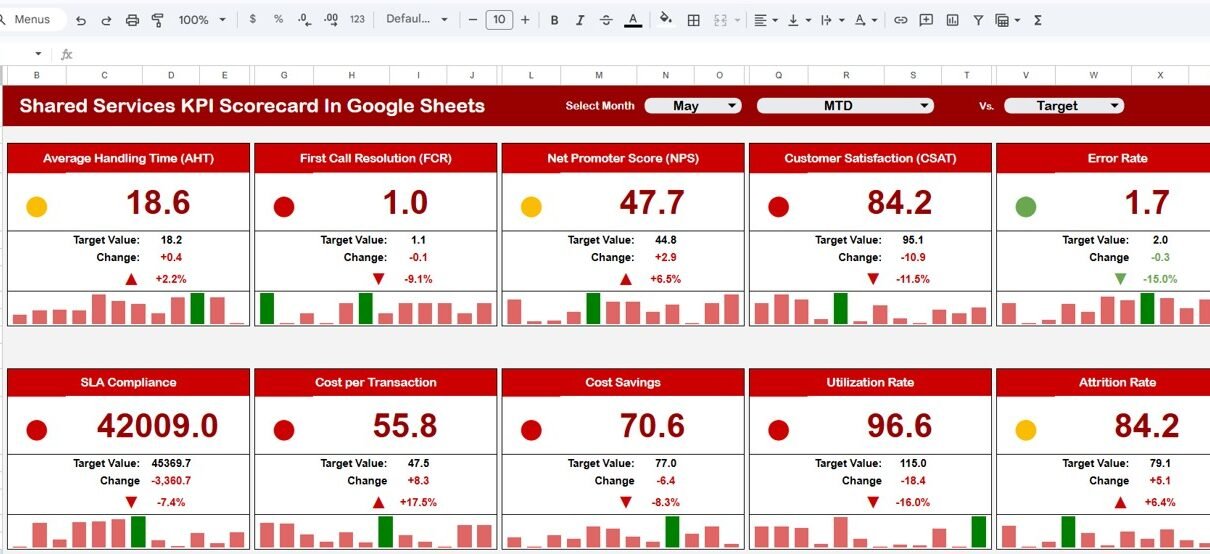
Track shared services KPIs with this ready-to-use Google Sheets scorecard. MTD/YTD comparisons, trend charts, color-coded indicators, and customizable KPI definitions. Instant download from NextGenTemplates.
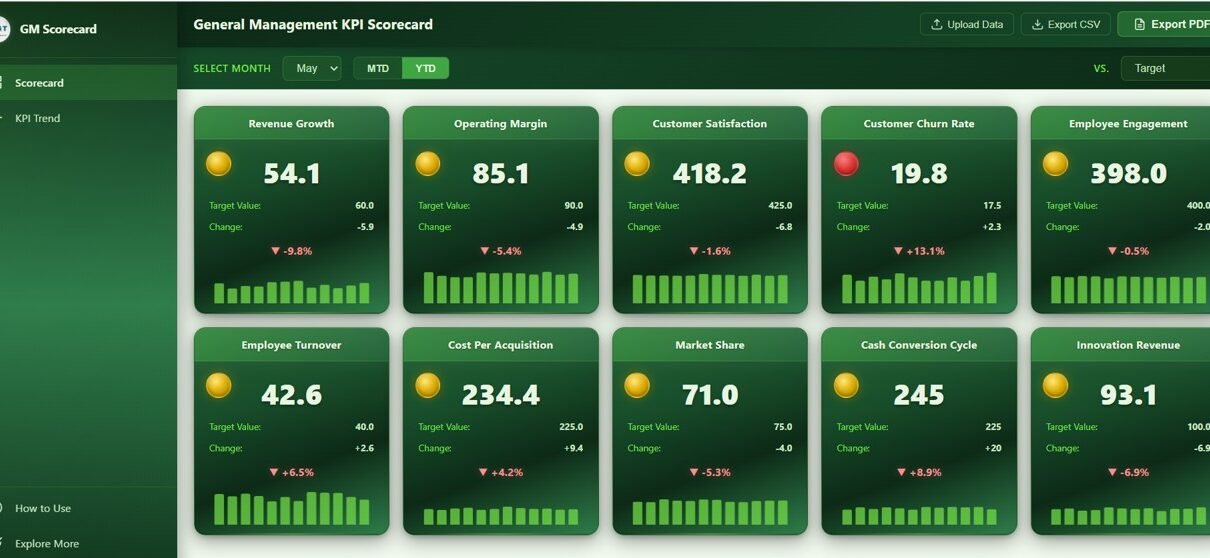
General Management KPI Scorecard in HTML — a premium browser-based executive scorecard template tracking 10 cross-functional management KPIs with traffic light indicators, sparkline trends, MTD/YTD toggle, and trend analysis charts for CEOs, general managers, and senior leaders.
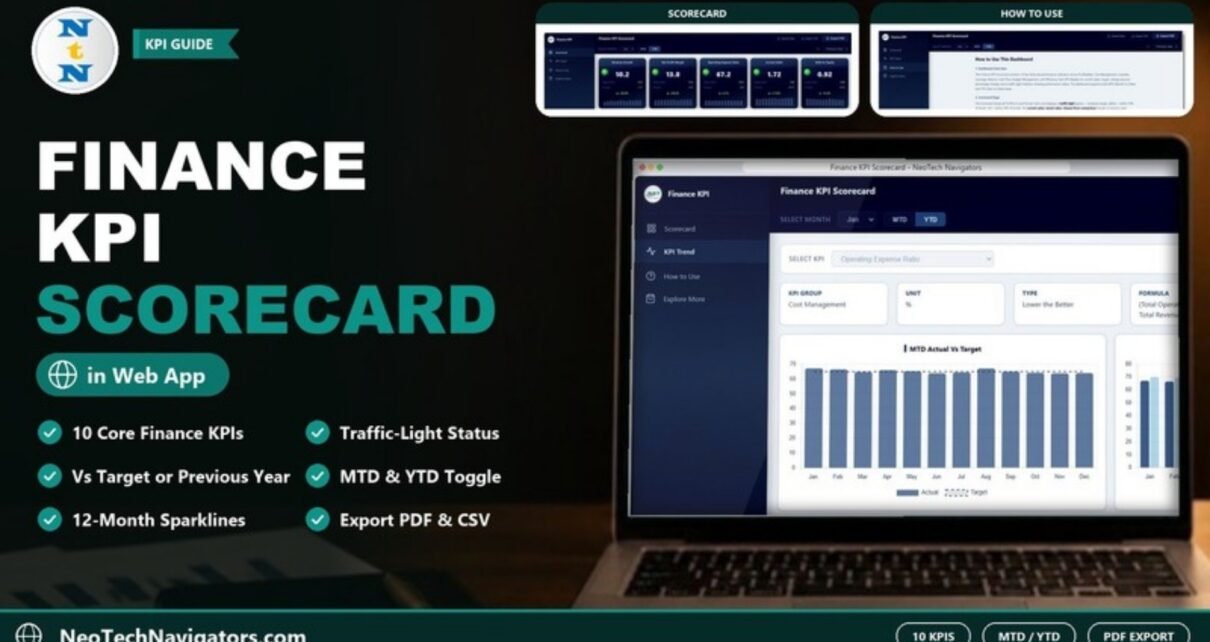
A browser-based Finance KPI Scorecard in HTML that shows ten financial KPIs with traffic lights, targets, prior-year changes, sparklines and four trend charts, with PDF and CSV export.
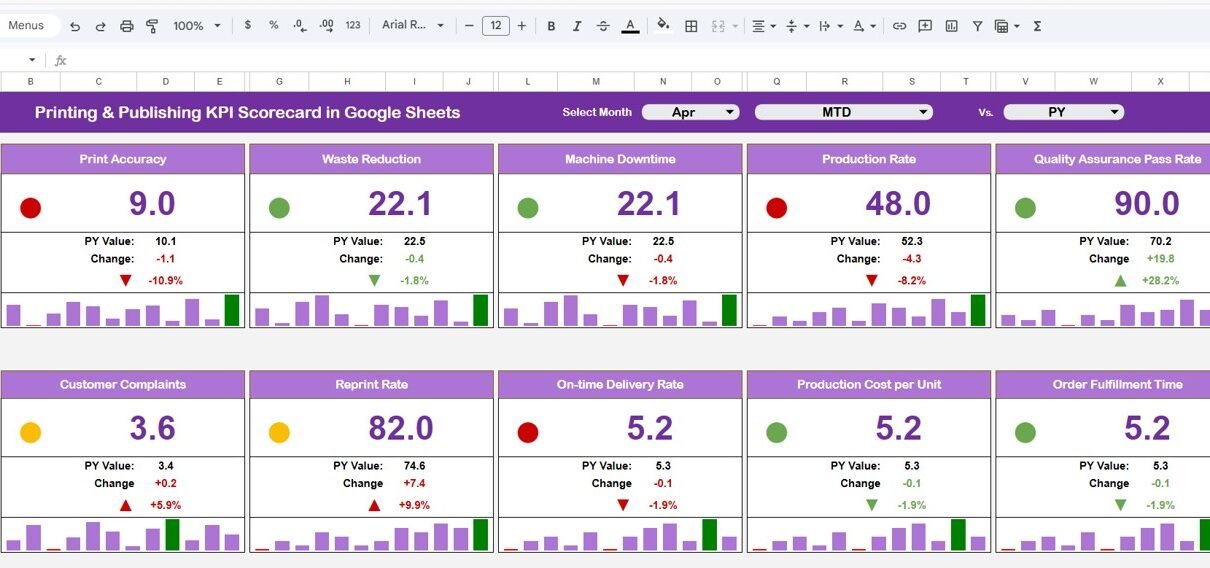
In today’s competitive printing and publishing industry, tracking performance is not optional—it is essential. Businesses must monitor production efficiency, costs, quality, and delivery timelines. However, when data stays scattered across multiple sheets, it becomes difficult to evaluate performance effectively.Printing & Publishing KPI Scorecard in Google Sheets So, how can you track KPIs, monitor trends, and […]
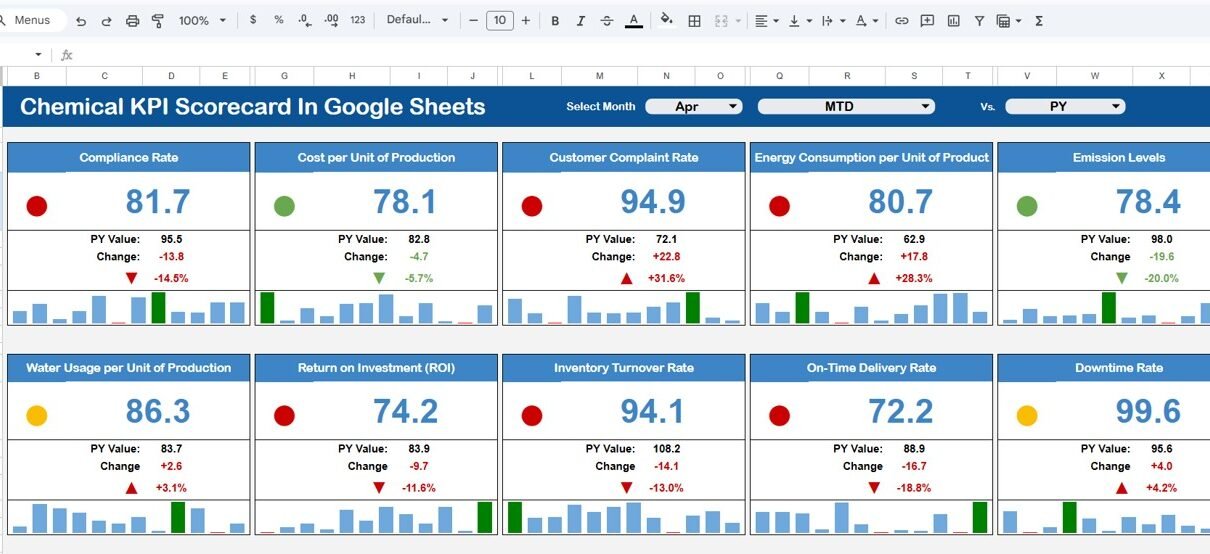
The chemical industry operates in a highly regulated, performance-driven, and efficiency-focused environment. Companies must continuously monitor production efficiency, safety performance, quality standards, operational costs, and environmental compliance. However, many chemical organizations still rely on manual spreadsheets and disconnected reports. As a result, managers struggle to evaluate performance quickly and accurately. So, how can chemical companies […]
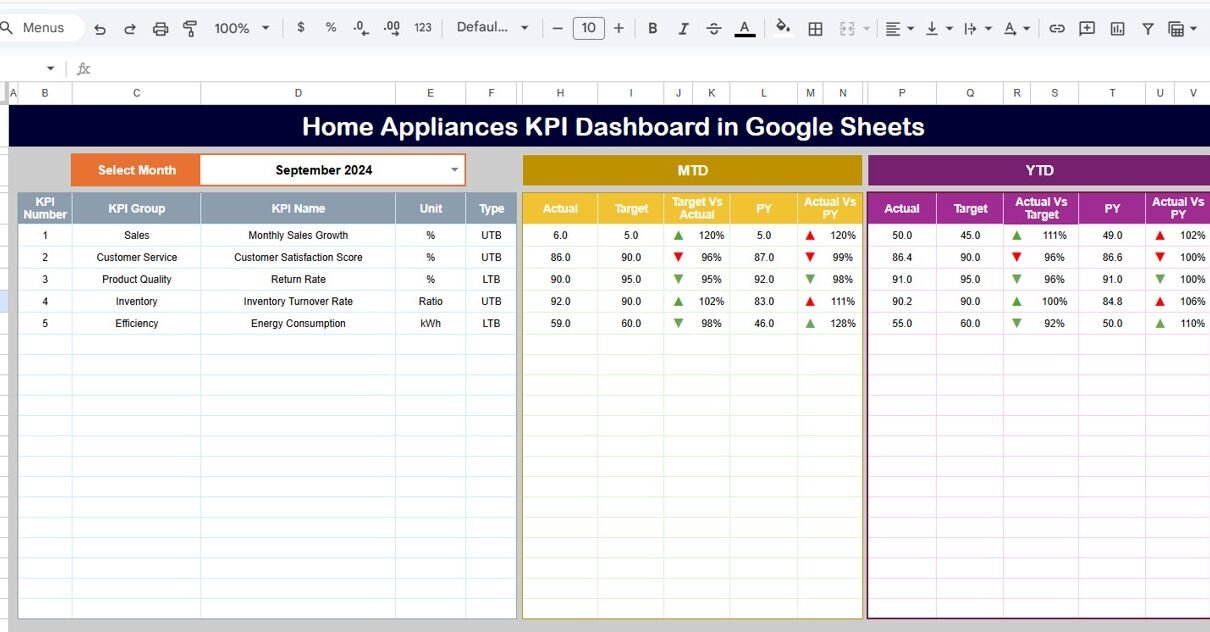
Tracking performance in the home appliances industry requires clear visibility into sales, operations, targets, and trends. When KPI data is scattered across multiple spreadsheets, it becomes difficult to evaluate performance, compare targets, and take timely actions. That is exactly where the Home Appliances KPI Dashboard in Google Sheets becomes a powerful, ready-to-use solution.Home Appliances KPI […]