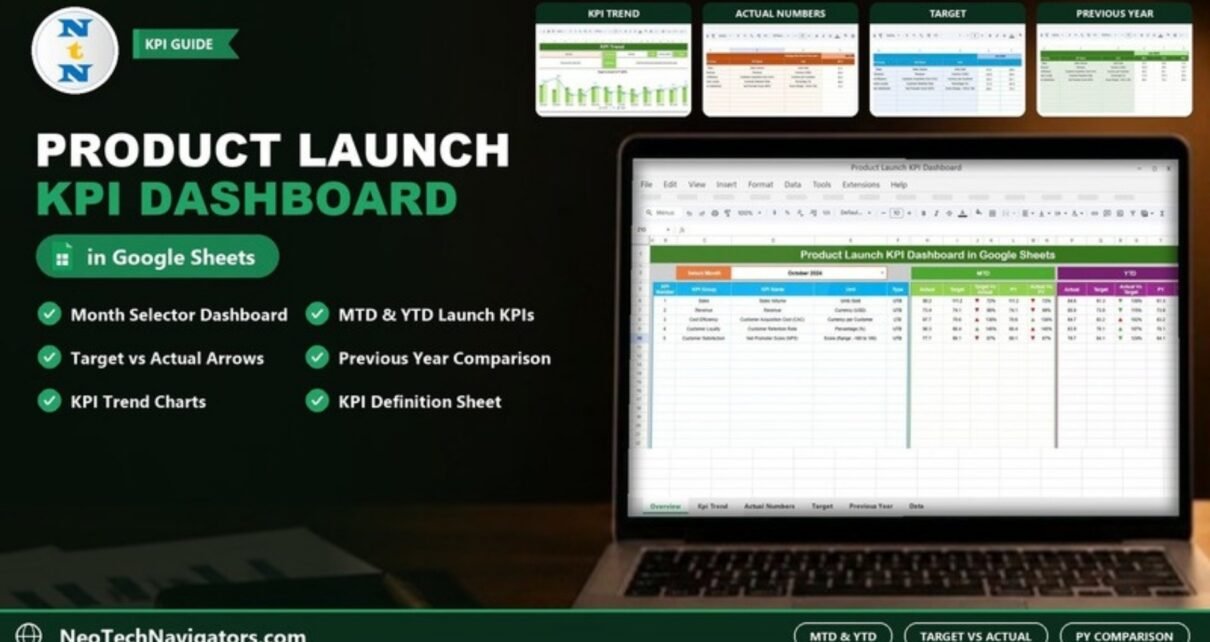
How the Product Launch KPI Dashboard in Google Sheets tracks five launch KPIs (Sales Volume, Revenue, CAC, Customer Retention Rate and NPS) on an MTD and YTD basis against targets and last year, with formulas, a worked example and setup steps.
Online Tutorial for Data Analysis and Automation
How the Product Launch KPI Dashboard in Google Sheets tracks five launch KPIs (Sales Volume, Revenue, CAC, Customer Retention Rate and NPS) on an MTD and YTD basis against targets and last year, with formulas, a worked example and setup steps.
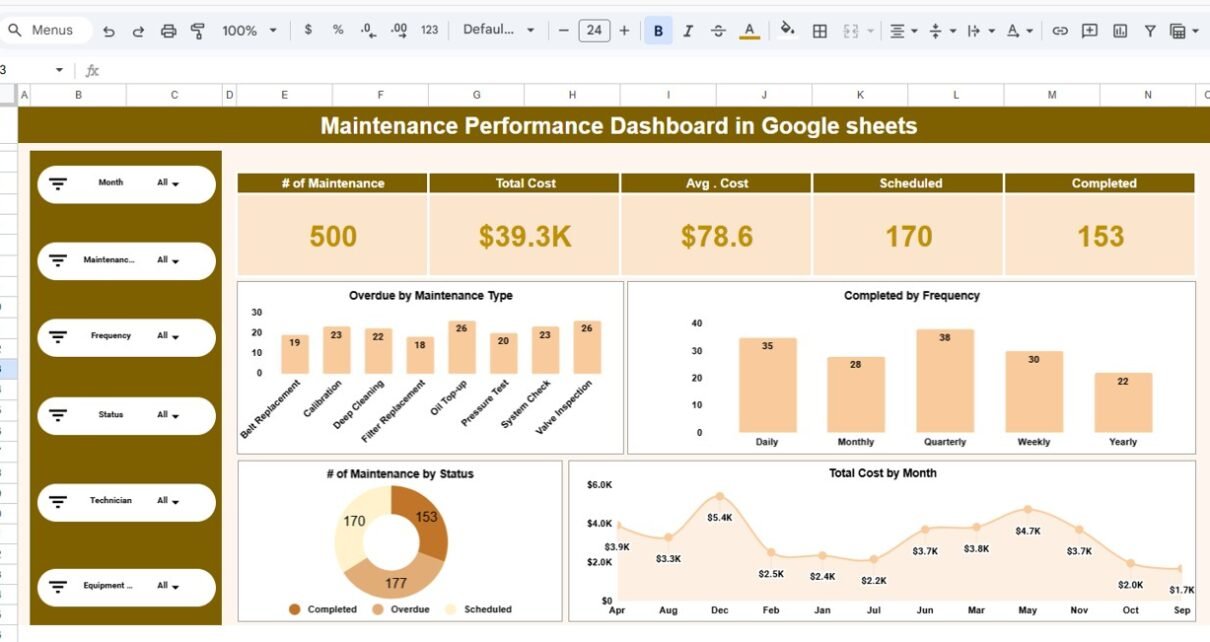
In today’s asset-driven organizations, maintenance teams must ensure equipment reliability while controlling costs. However, many companies still track maintenance activities using scattered spreadsheets and manual logs. As a result, managers struggle to monitor overdue tasks, technician performance, and maintenance costs in one place.Maintenance Performance Dashboard in Google Sheets Therefore, organizations need a centralized and interactive […]
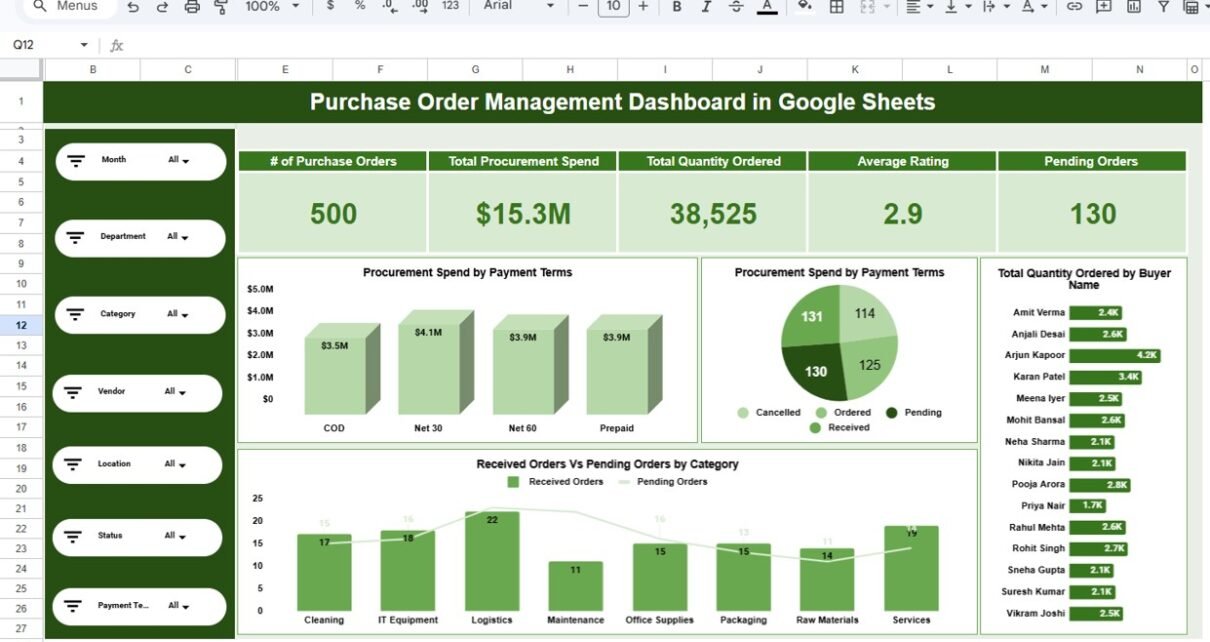
In today’s fast-moving procurement environment, organizations must track purchase orders with speed and accuracy. However, many teams still rely on scattered spreadsheets and manual reports. As a result, procurement managers often struggle to monitor spend, vendor performance, and order status in one place.Purchase Order Management Dashboard in Google Sheets Therefore, businesses need a centralized and […]
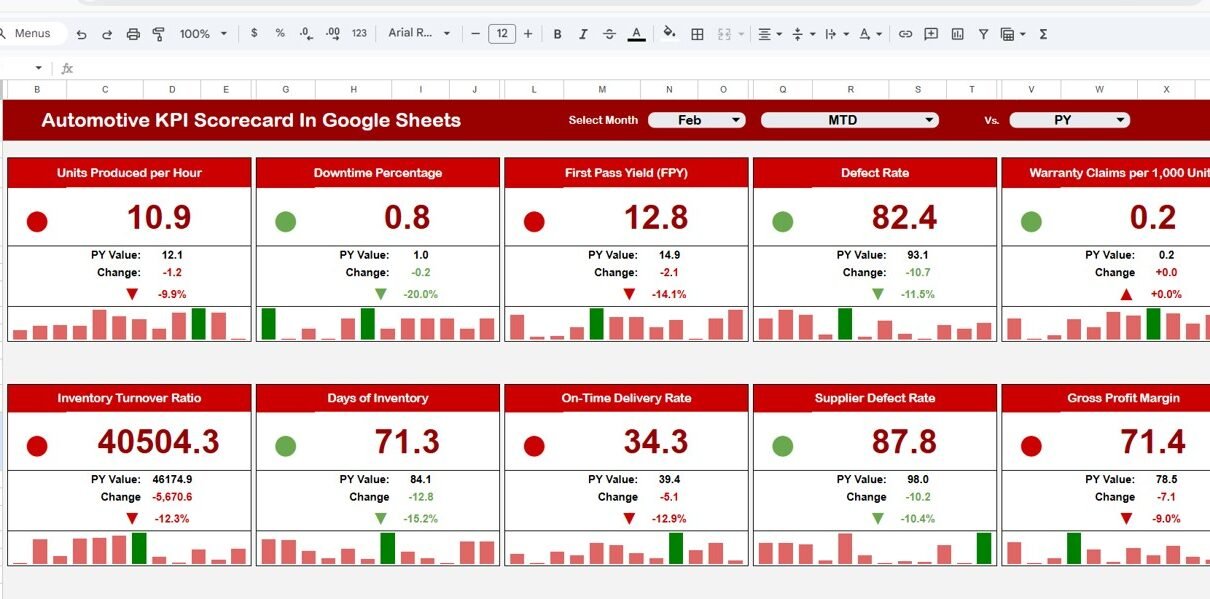
In today’s highly competitive automotive industry, data-driven decisions separate successful dealerships and service centers from the rest. However, many automotive businesses still rely on scattered spreadsheets and manual reporting. As a result, leaders struggle to monitor performance in real time. Therefore, companies need a structured and interactive performance monitoring system. More importantly, they need instant […]
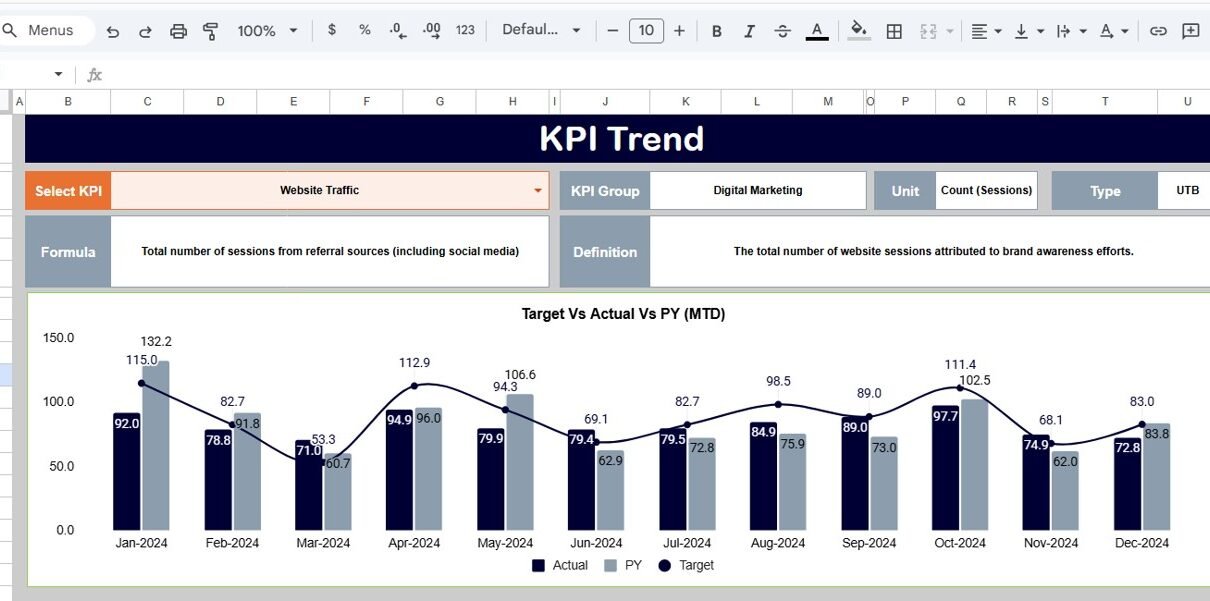
In today’s crowded digital marketplace, brands must do more than exist — they must stay visible and memorable. However, many marketing teams still struggle to measure brand awareness effectively. As a result, decision-makers often rely on scattered reports and incomplete data. Therefore, businesses need a centralized and structured system to track brand visibility. More importantly, […]
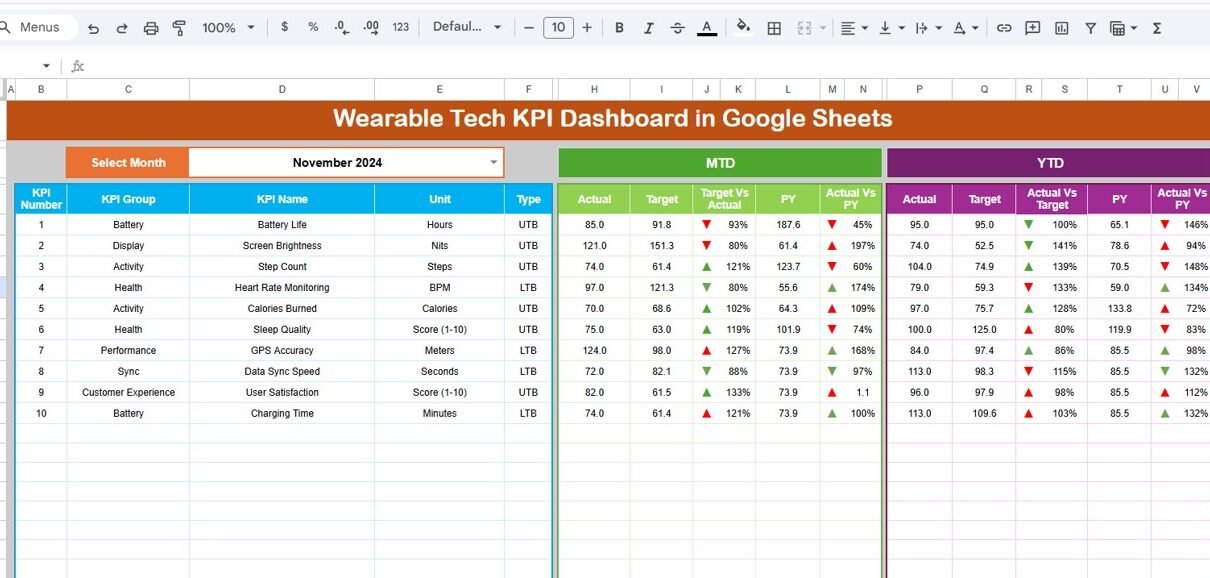
The wearable technology market is growing rapidly, driven by innovation, customer demand, and constant product evolution. To stay competitive, organizations need clear visibility into performance across sales, operations, quality, and customer engagement. That is exactly where the Wearable Tech KPI Dashboard in Google Sheets becomes an essential tool. This ready-to-use KPI dashboard helps you track, […]
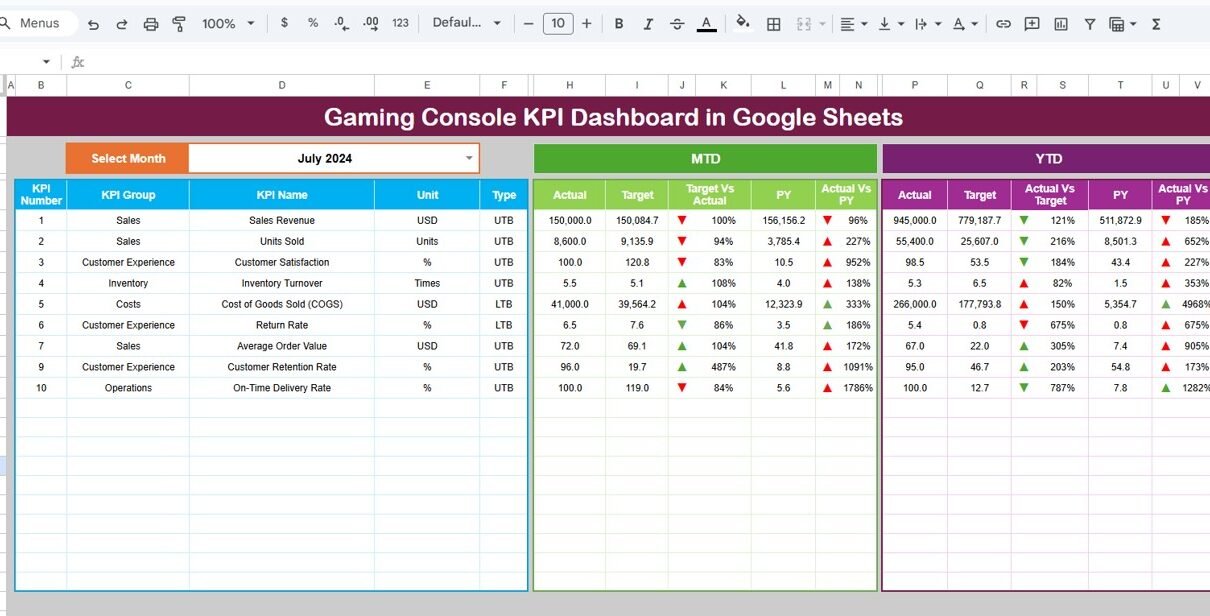
The gaming console industry moves fast. Sales volumes change monthly, customer demand fluctuates, and performance targets must be monitored closely. When gaming KPI data is spread across multiple spreadsheets, it becomes difficult to track progress, compare targets, and identify trends. That is exactly why the Gaming Console KPI Dashboard in Google Sheets is a powerful […]
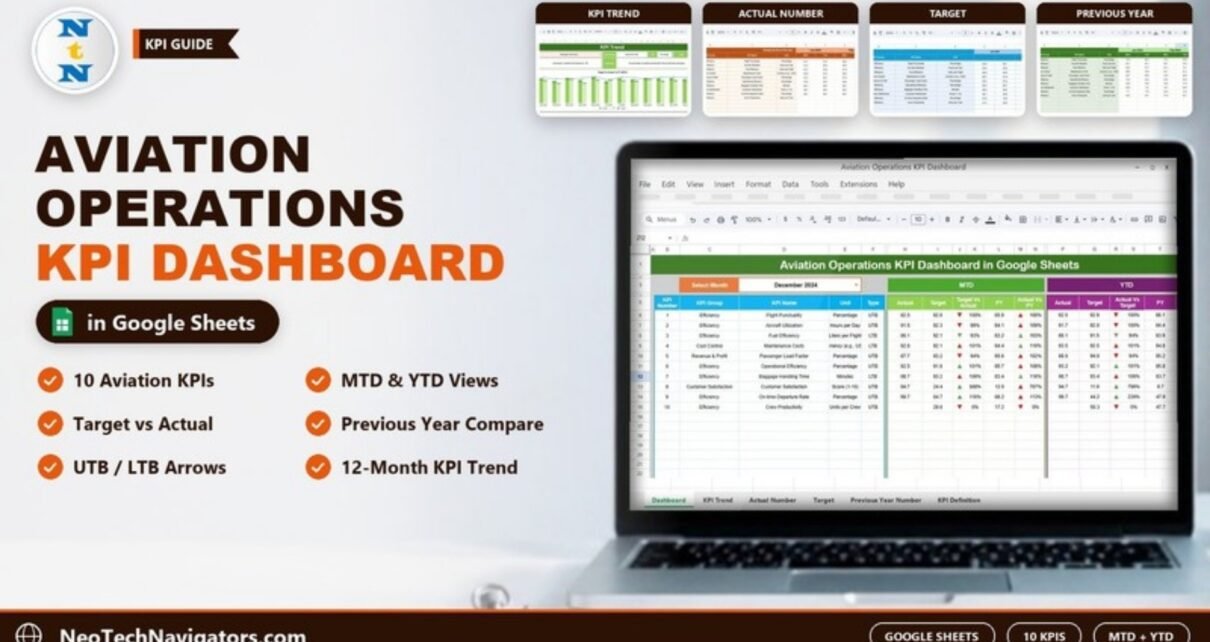
Track 10 aviation operations KPIs – from flight punctuality to baggage handling time – against target and last year, for the month and year to date, in one Google Sheets dashboard.

Ticket resolution time directly impacts customer satisfaction, operational efficiency, and service quality. Whether you manage IT support tickets, customer service requests, or internal helpdesk issues, delayed ticket resolution leads to frustration, SLA breaches, and increased costs. However, many teams still track ticket performance across emails or scattered spreadsheets, which makes monitoring slow and inaccurate.Ticket Resolution […]

Customer complaints directly impact brand reputation, customer loyalty, and revenue. When organizations fail to track complaints properly, resolution delays increase and customer satisfaction drops. Many teams still rely on emails, ticket logs, or disconnected spreadsheets, which makes complaint tracking inconsistent and reactive.Customer Complaint Resolution KPI Dashboard in Google Sheets This challenge makes a Customer Complaint […]