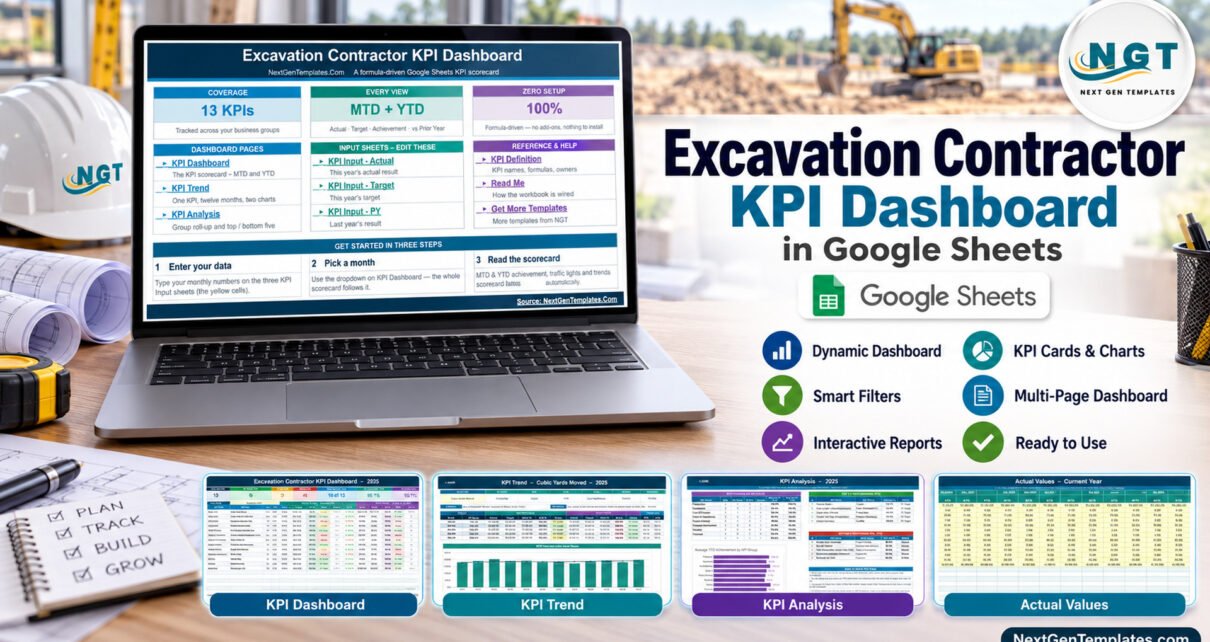
The Excavation Contractor KPI Dashboard in Google Sheets tracks 13 KPIs across 8 KPI groups and shows each one Month-to-Date and Year-to-Date against target and prior year. Its September 2025 sample reads 6 KPIs On Target, 3 At Risk and 4 Missed on a YTD basis, with 98.1% average YTD achievement and 10 of 13 KPIs improving on last year. One month dropdown recalculates all of it.Excavation Contractor KPI Dashboard in Google Sheets
Excavation and earthmoving contractors run on machine hours, haul volumes, bids and budgets, and the monthly management meeting often turns into a hunt through separate spreadsheets. This template puts production, equipment, cost, project delivery, quality and revenue numbers on one formula-driven scorecard. It belongs to our KPI Dashboard family (month picker, traffic lights, KPI Trend and KPI Analysis pages), which is a different format from our Excavation Contractor KPI Scorecard in Google Sheets.Excavation Contractor KPI Dashboard in Google Sheets
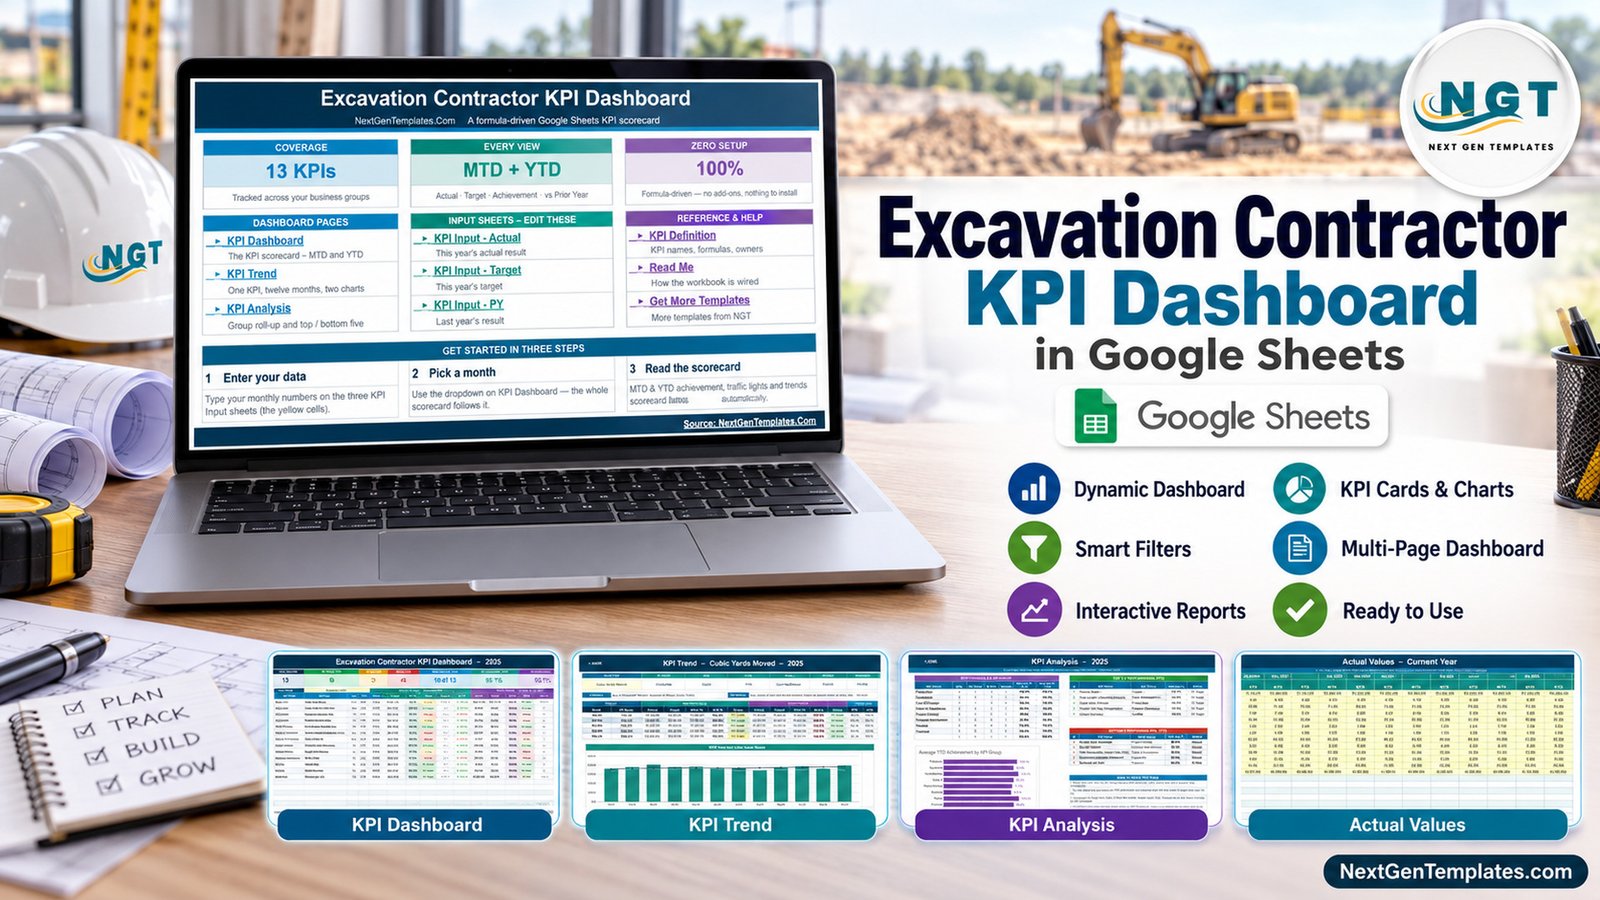
Key Features of the Excavation Contractor KPI Dashboard in Google Sheets
- Single month picker: the Select Month dropdown on the KPI Dashboard sheet drives the MTD block, the YTD block, the seven header cards and the KPI Analysis page.
- MTD and YTD in one row: every KPI shows Actual, Target, Ach %, Status, Prior Yr and vs PY for both periods.Excavation Contractor KPI Dashboard in Google Sheets
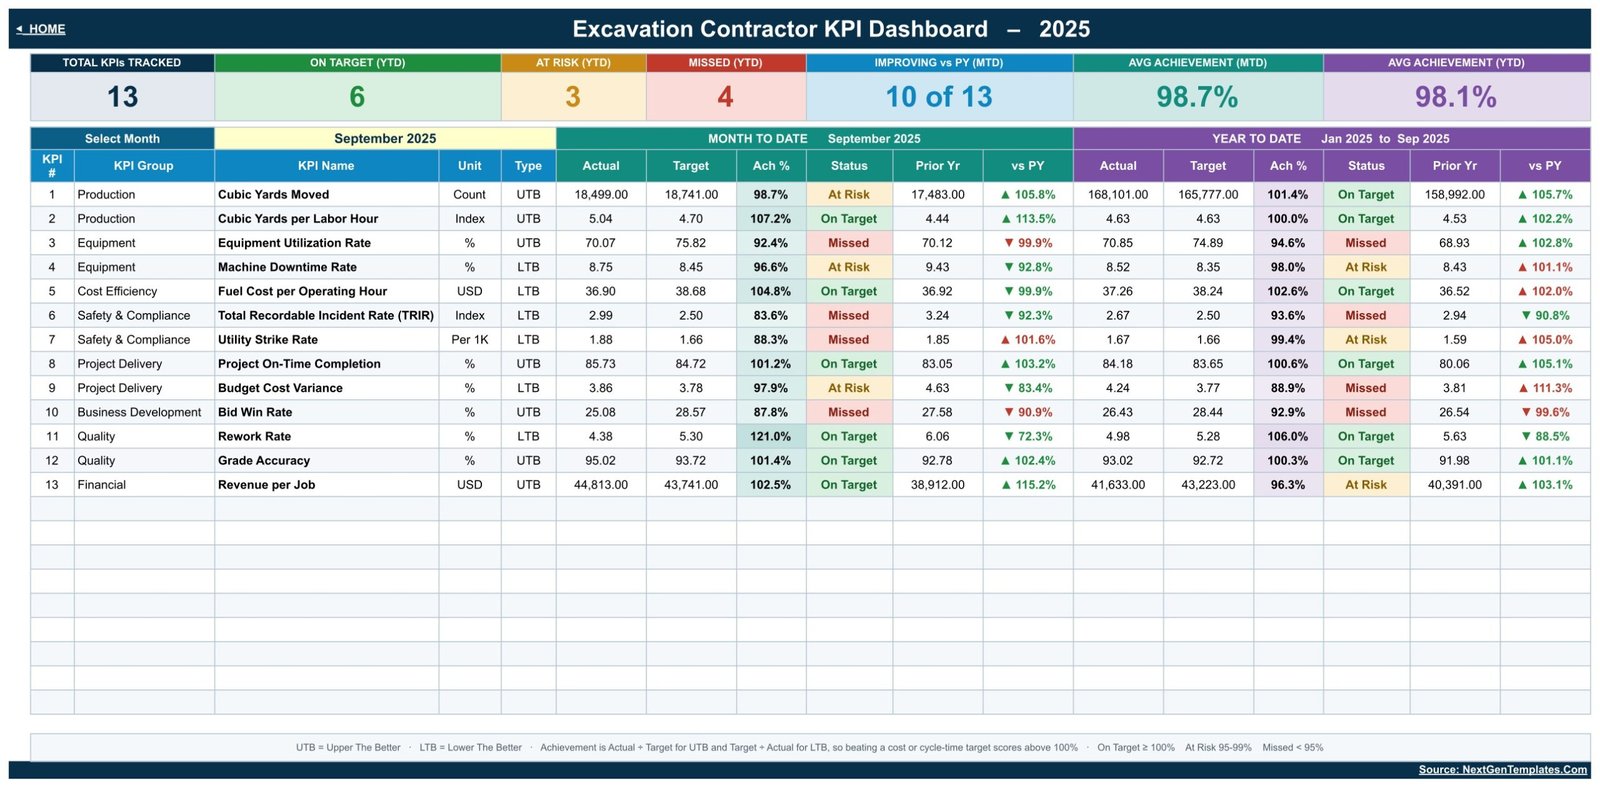
- Traffic-light thresholds: On Target from 100% achievement, At Risk from 95% to 99%, Missed below 95%.
- Direction-aware scoring: 7 KPIs are Upper The Better (UTB) and 6 are Lower The Better (LTB). For LTB metrics, achievement is Target ÷ Actual, so a downtime or fuel-cost result below target scores above 100%.Excavation Contractor KPI Dashboard in Google Sheets
- Seven header cards: Total KPIs Tracked, On Target (YTD), At Risk (YTD), Missed (YTD), Improving vs PY (MTD), Avg Achievement (MTD) and Avg Achievement (YTD).
- Editable KPI master list: add, rename or delete KPIs on the KPI Definition sheet, and every other sheet follows. The sheets are wired for 22 KPIs, with 13 filled in.
- Formula-driven: no add-ons, macros or Apps Script, so there is nothing to authorise and no refresh step.Excavation Contractor KPI Dashboard in Google Sheets
The 13 sample KPIs are grouped as follows:
- Production: Cubic Yards Moved, Cubic Yards per Labor Hour
- Equipment: Equipment Utilization Rate, Machine Downtime Rate
- Cost Efficiency: Fuel Cost per Operating Hour
- Safety & Compliance: Total Recordable Incident Rate (TRIR), Utility Strike Rate
- Project Delivery: Project On-Time Completion, Budget Cost Variance
- Business Development: Bid Win Rate
- Quality: Rework Rate, Grade Accuracy
- Financial: Revenue per Job
Dashboard Pages Explanation
The workbook has eleven tabs: Home, KPI Dashboard, KPI Trend, KPI Analysis, three KPI Input sheets, KPI Definition, a hidden Support sheet of helper calculations, Read Me and Get More Templates. The six pages below are the ones you will use most.Excavation Contractor KPI Dashboard in Google Sheets
Home Page
The start screen shows three coverage cards (13 KPIs, MTD + YTD, 100% formula-driven), links to the three dashboard pages, the three input sheets and the reference sheets, and a three-step strip: enter your data, pick a month, read the scorecard.

KPI Dashboard
This is the scorecard. The header cards for September 2025 read 13 KPIs tracked, 6 On Target, 3 At Risk, 4 Missed, 10 of 13 improving vs PY, 98.7% average MTD achievement and 98.1% average YTD achievement. Below them, each KPI row carries its group, unit and type, then the MTD and YTD blocks with coloured status cells. A footer legend explains UTB, LTB and the thresholds.Excavation Contractor KPI Dashboard in Google Sheets
KPI Trend
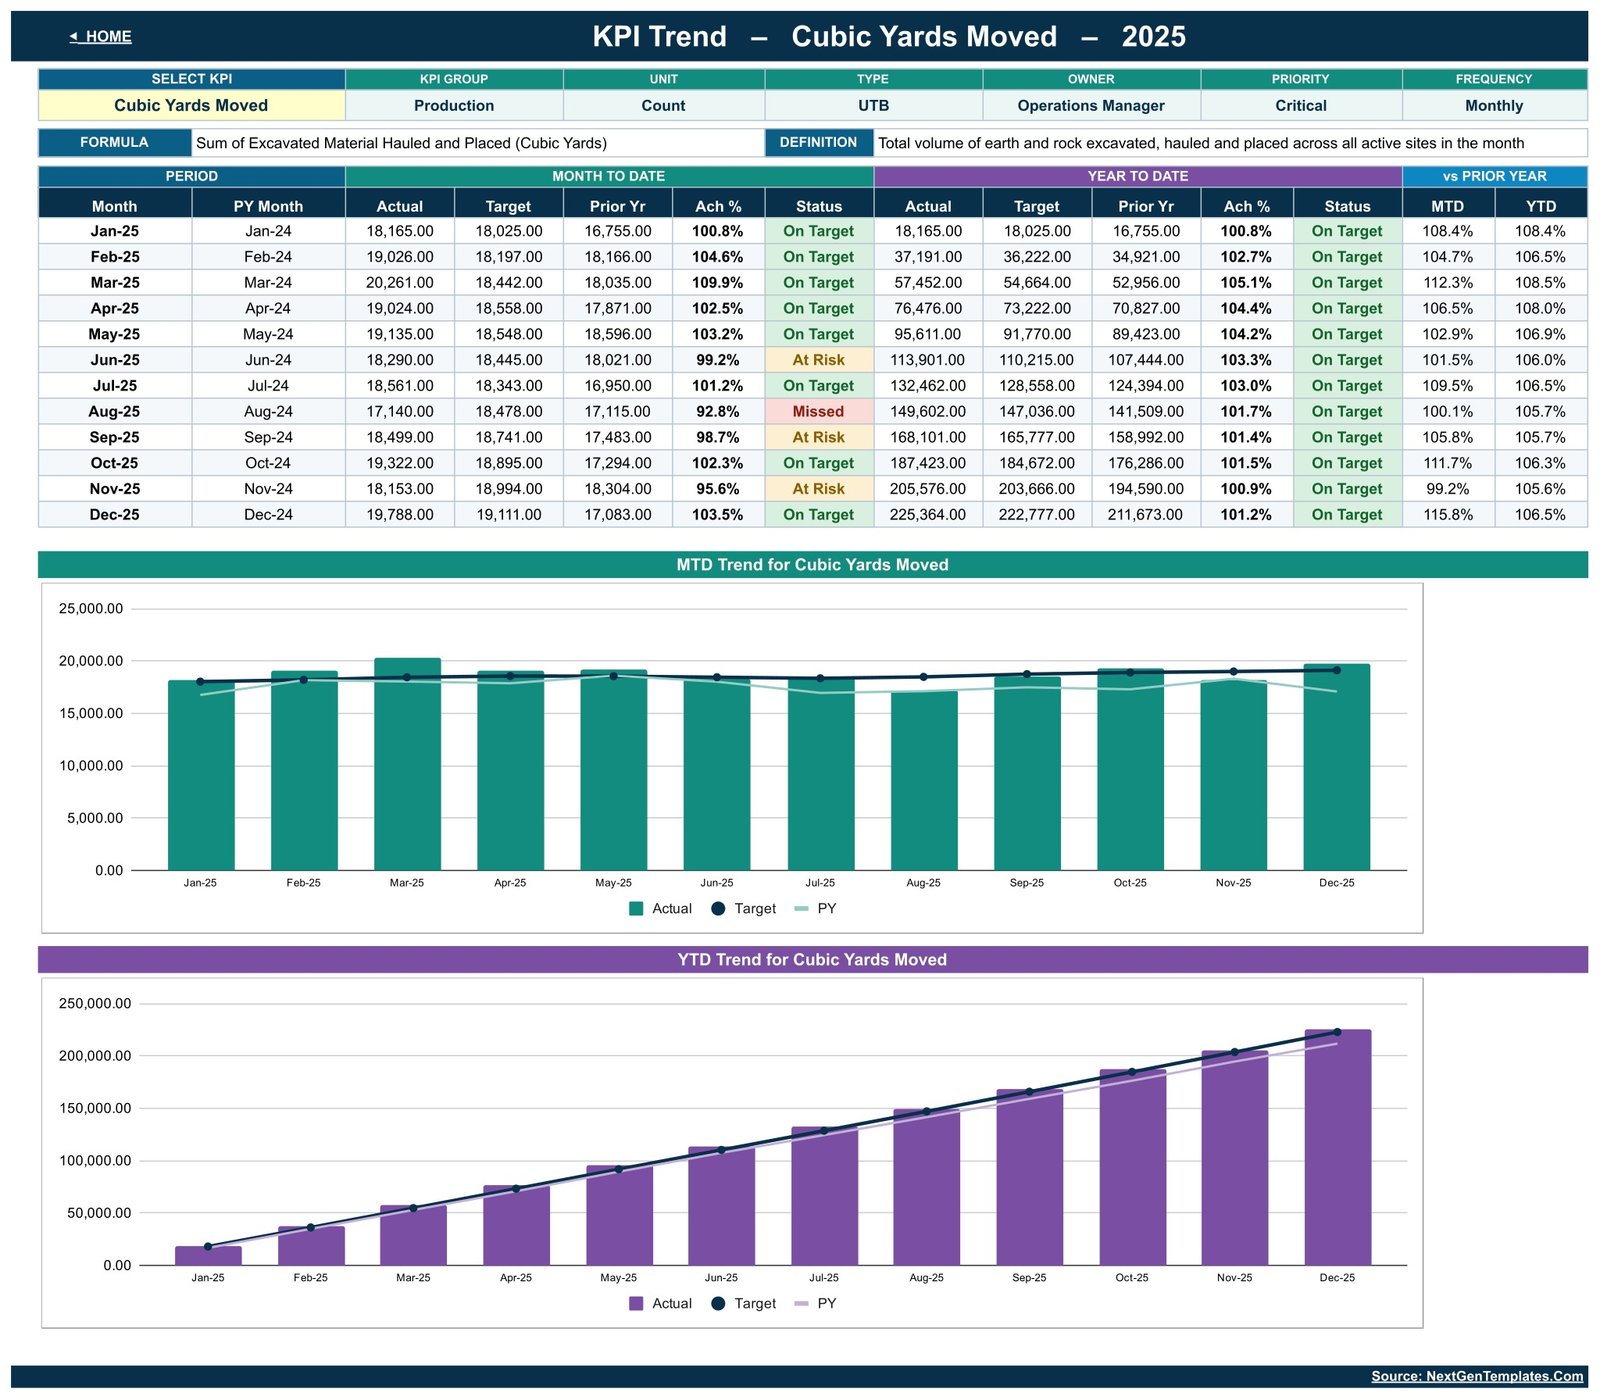
Pick one KPI from the dropdown. An attribute strip shows its group, unit, type, owner, priority and frequency, followed by its formula and definition. A 12-month table lists MTD and YTD Actual, Target, Prior Yr, Ach % and Status with vs PY percentages, and two charts plot MTD Actual, Target and PY by Month and YTD Actual, Target and PY by Month. The sample view shows Cubic Yards Moved, which reached 225,364 cubic yards YTD by December against a 222,777 target.Excavation Contractor KPI Dashboard in Google Sheets
KPI Analysis
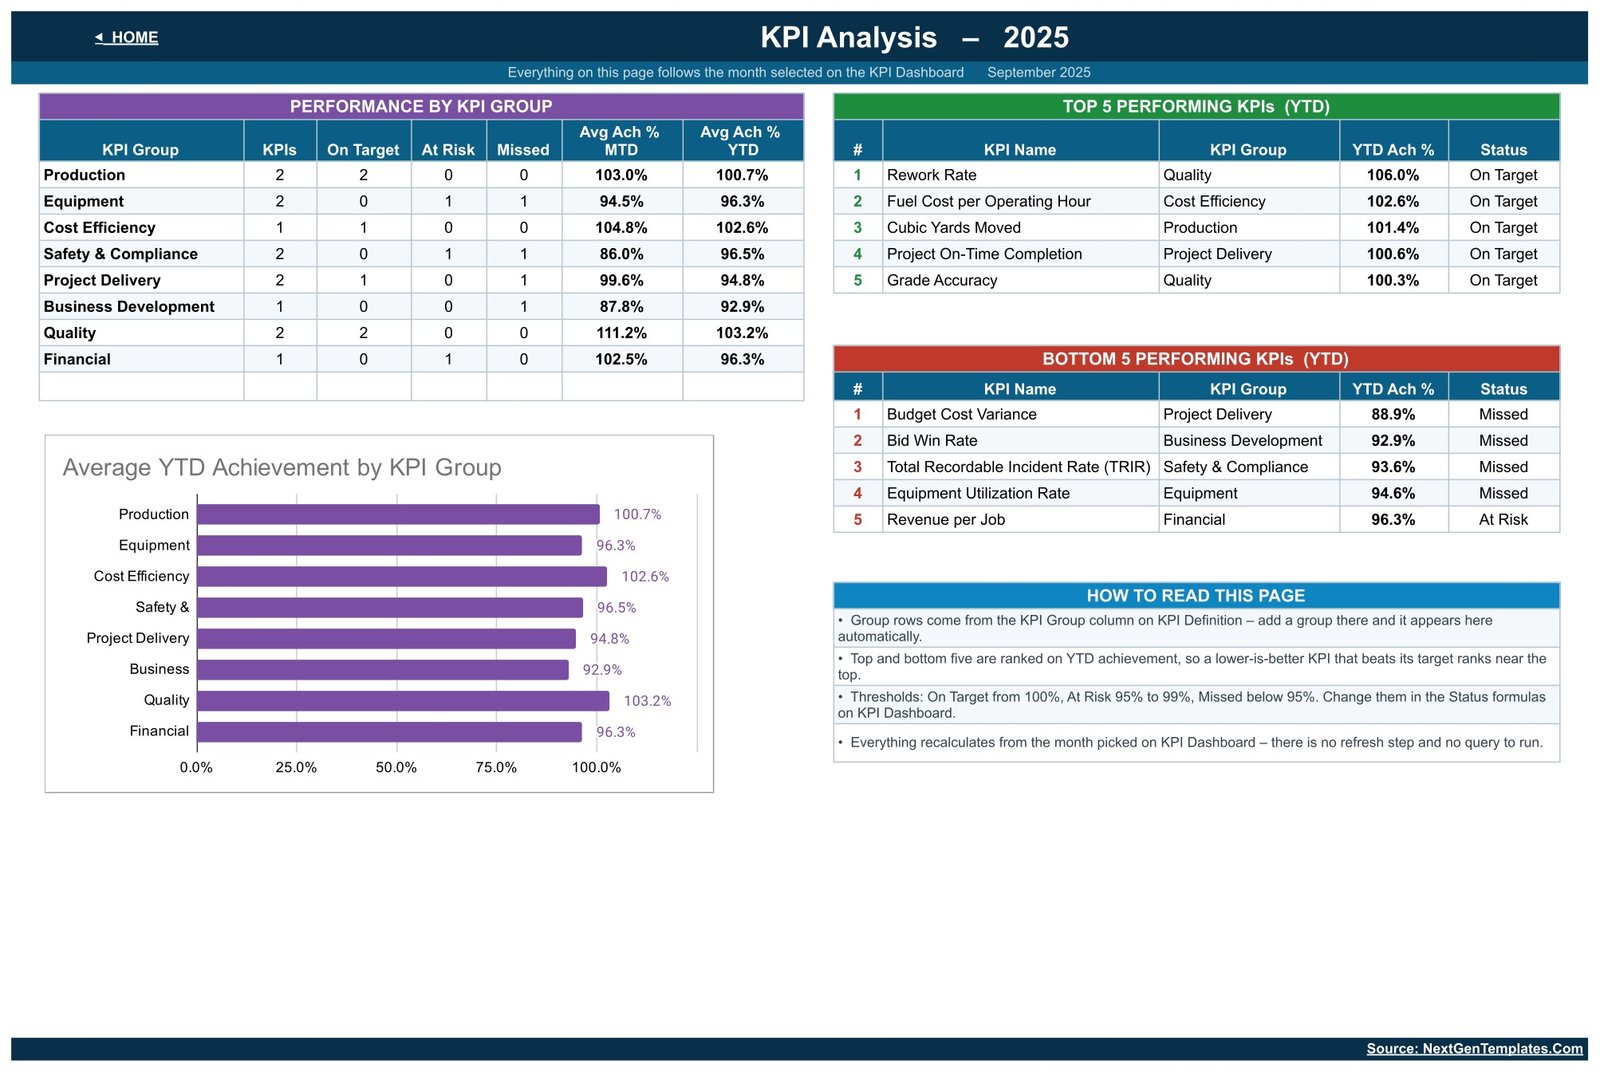
Everything on this page follows the month chosen on KPI Dashboard. Performance by KPI Group lists KPI counts, On Target, At Risk and Missed counts and average MTD and YTD achievement per group, and the Average YTD Achievement by KPI Group chart plots the same roll-up. In the sample, Quality leads at 103.2% YTD and Business Development trails at 92.9%. The Top 5 list is headed by Rework Rate (106.0%) and the Bottom 5 by Budget Cost Variance (88.9%).Excavation Contractor KPI Dashboard in Google Sheets
KPI Input – Actual (Actual Values, Current Year)
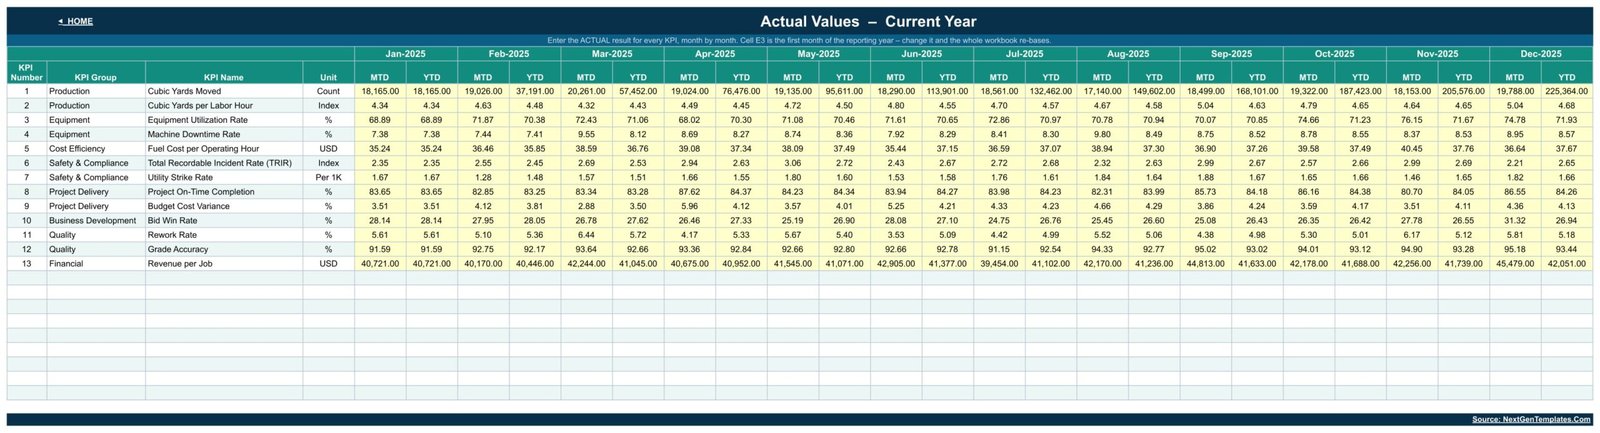
This is where you type. Each KPI row has an MTD and a YTD column for every month from January to December. Cell E3 holds the first month of the reporting year; change it and the Target sheet, the Prior Year sheet, the month dropdown and every sheet title re-base. KPI Input – Target and KPI Input – PY follow the same layout.Excavation Contractor KPI Dashboard in Google Sheets
KPI Definition (Master List)
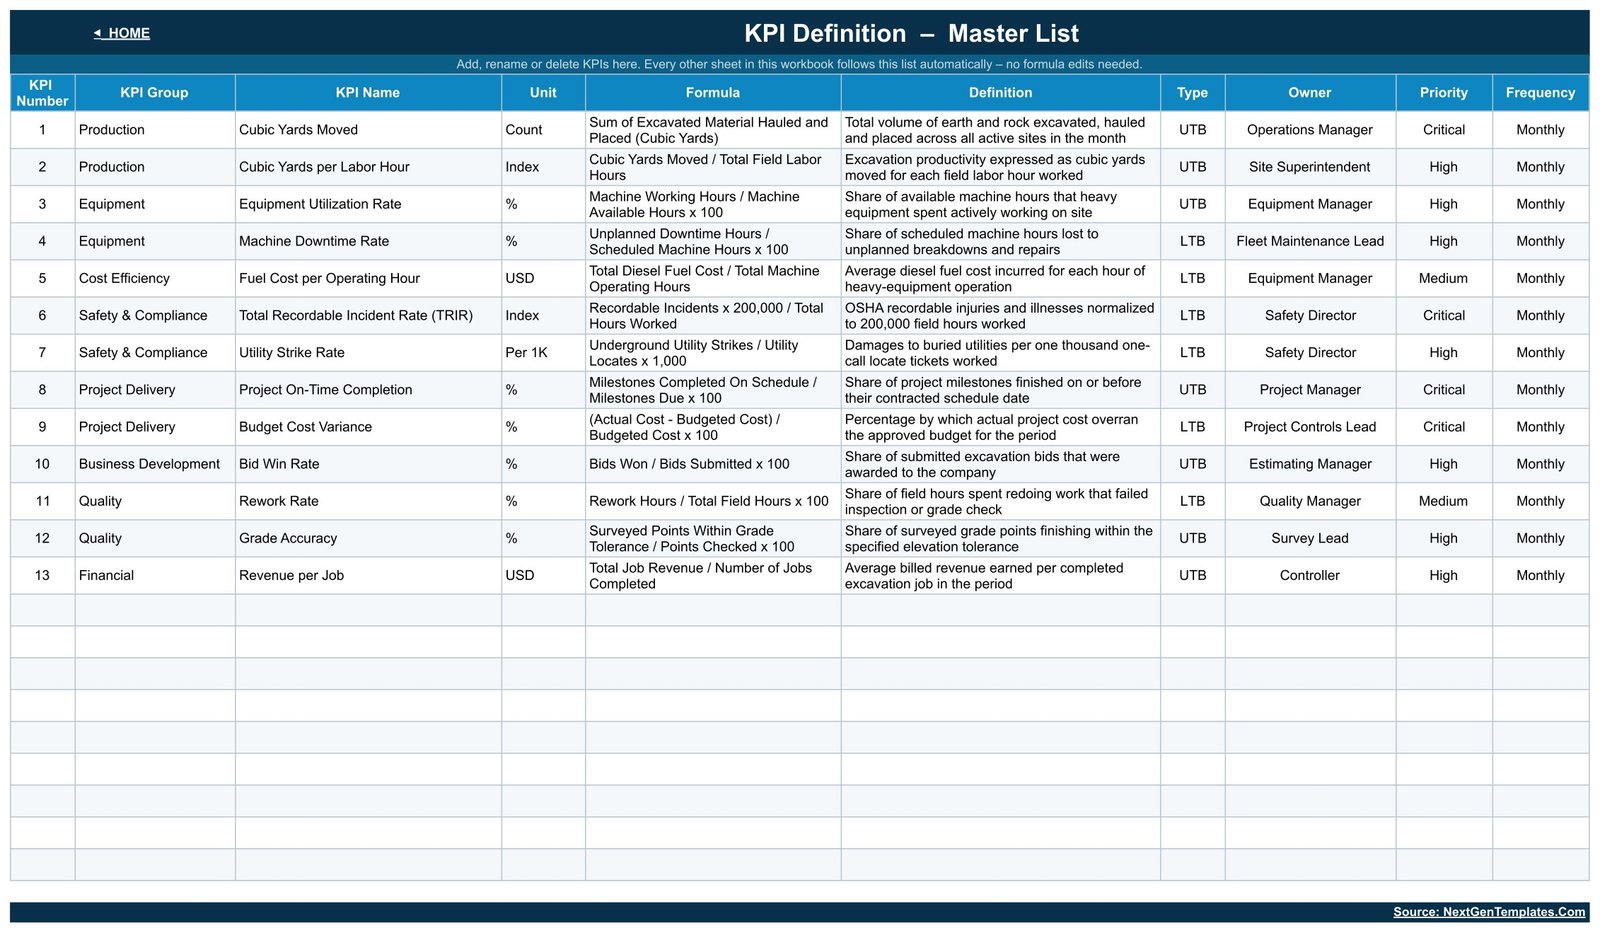
The master list holds KPI number, group, name, unit, formula, definition, type, owner, priority and frequency. Volumes such as Cubic Yards Moved accumulate through the year, while rates and per-unit costs such as Fuel Cost per Operating Hour are running averages. The definitions are editable examples; rewrite them to match how your company measures each KPI.Excavation Contractor KPI Dashboard in Google Sheets
Google Sheets KPI Dashboard vs. Excel Dashboard vs. Construction Management Software: Feature Comparison
| Feature | Excavation Contractor KPI Dashboard in Google Sheets | Excel KPI Dashboard | Construction management software (e.g. Procore, HCSS) |
|---|---|---|---|
| Cost | ✅ $8.99 one-time | One-time file price plus an Excel licence | Subscription, usually quote-based |
| Platform | ✅ Browser, free Google account | Microsoft Excel desktop | Vendor web and mobile apps |
| Setup time | ✅ Minutes | Minutes | Weeks of onboarding |
| Real-time team collaboration | ✅ Built into Google Sheets | Needs OneDrive or SharePoint | ✅ Yes |
| Mobile access | ✅ Google Sheets app | Excel mobile app | ✅ Yes |
| Customizable KPIs | ✅ One master list, 22 rows | ✅ Yes | Limited to vendor reports |
| Share with a link | ✅ Yes | Via cloud storage | User seats required |
| Job costing, dispatch, field logs | No, management KPIs only | No | ✅ Yes |
| MTD and YTD traffic lights with prior year | ✅ Built in | Depends on the template | Custom report setup |
For excavation contractors who want a monthly management scorecard without buying seats in a full operations platform, this Google Sheets template sits in the sweet spot.Excavation Contractor KPI Dashboard in Google Sheets
Who Should Use This Template
Perfect for:
- Owners and general managers of small and mid-sized excavation, grading and site-prep companies
- Equipment managers comparing utilization, downtime and fuel cost month by month
- Project controls and estimating leads who report on-time completion, cost variance and bid win rate
- Consultants who prepare monthly KPI packs for contractor clients
Not a fit if:
- You need job costing, dispatch, telematics or daily field reports; this template stores monthly totals only
- You want utility-locate, safety-compliance or incident-reporting software; the figures are typed in and the sample data is fictional
Real-World Use Cases
Dana owns a 40-person site-prep and excavation firm. At month end she types in yards moved, labor hours and job revenue, opens the KPI Dashboard in the management meeting and asks the team about the KPIs that moved from On Target to At Risk. The meeting starts from one page instead of five exports.
Luis manages a fleet of excavators, dozers and haul trucks. He opens KPI Trend on Equipment Utilization Rate and Machine Downtime Rate to show twelve months of results against target and last year. The YTD chart makes the case for replacing an ageing machine in a way a single month cannot.
Priya runs estimating and project controls. She watches Bid Win Rate and Budget Cost Variance on the Bottom 5 list of KPI Analysis and brings both to the quarterly pricing review, alongside the Project Delivery group roll-up.
Advantages of the Template
- One-time cost: $8.99 once, with no seats or renewals.
- Fast monthly close: three input sheets and one dropdown replace a hand-built slide deck.
- Fair scoring for costs: LTB logic means a low downtime or rework rate counts as a win.
- Transparent formulas: every number can be traced, which helps when an owner asks where a figure came from.
- Shareable: Google Sheets sharing lets office staff and site leads view the same scorecard.
Opportunities for Improvement
- YTD values are typed, not calculated. The input sheets store both MTD and YTD, which gives control but means you must enter YTD correctly each month.
- Budget Cost Variance is an overrun percentage. If a period comes in under budget the value turns negative, and a Target ÷ Actual achievement stops being meaningful. Record it as an overrun, or redefine the KPI.
- Chart labels are short. On KPI Analysis, the bar chart trims long group names such as Safety & Compliance and Business Development.
- Monthly grain only. There is no job, crew or machine-level breakdown; the scorecard works at company level.
Best Practices
- Agree each KPI’s formula and owner on KPI Definition before you enter any numbers.
- Enter Actual, Target and Prior Year for the same months so vs PY arrows stay meaningful.
- Keep status thresholds as they are for a quarter before tuning them; Google’s help page on conditional formatting in Google Sheets explains how the coloured cells work.
- Protect the input ranges if several people edit, and use the dropdown list feature documentation if you add your own pickers.
- Review KPI Analysis’s Bottom 5 list each month and assign one action per KPI.
Explore Relevant Templates
- Excavation Contractor KPI Scorecard in Google Sheets: the same trade in our separate KPI Scorecard format.
- Paving Contractor KPI Dashboard in Google Sheets: a month-picker scorecard for paving crews.
- Heavy Machinery Dashboard in Google Sheets: an analytical dashboard for equipment data.
- Demolition Contractor Management System Web App: job management for a neighbouring trade.
More guides on this blog: the Roofing Contractor KPI Dashboard in Google Sheets, the Electrical Contractor KPI Dashboard in Google Sheets, the Interior Fit-Out KPI Dashboard in Google Sheets and the Bathroom Remodeling KPI Dashboard in Google Sheets. An Excel edition of this dashboard is in preparation.
Frequently Asked Questions
What KPIs does the Excavation Contractor KPI Dashboard in Google Sheets track?
It ships with 13 sample KPIs in 8 groups: Cubic Yards Moved, Cubic Yards per Labor Hour, Equipment Utilization Rate, Machine Downtime Rate, Fuel Cost per Operating Hour, Total Recordable Incident Rate, Utility Strike Rate, Project On-Time Completion, Budget Cost Variance, Bid Win Rate, Rework Rate, Grade Accuracy and Revenue per Job. All are editable.
How long does setup take?
Copying the sheet takes a minute and setting the reporting month in cell E3 takes seconds. Most of the work is typing your monthly MTD and YTD figures into the Actual, Target and Prior Year sheets. After that, the dashboard, trend and analysis pages recalculate on their own.
How is this different from the Excavation Contractor KPI Scorecard?
This listing is the KPI Dashboard family, built around a month-picker scorecard with KPI Trend and KPI Analysis pages. The KPI Scorecard is a separately built Google Sheets product with its own layout and KPI set. Buy the one whose layout suits your meeting.
How does it compare to Procore or HCSS?
Those platforms manage field operations, costing and scheduling on a subscription. This template does none of that. It is a one-time $8.99 monthly scorecard for figures you already collect, which makes it a reporting layer rather than a replacement for operations software.
Can I change the On Target, At Risk and Missed thresholds?
Yes. The 100% and 95% thresholds live in the Status formulas on the KPI Dashboard sheet. The Read Me sheet points to them, so you can raise or lower the bands to match your own targets.
Does it give safety or compliance guidance?
No. All figures are fictional sample data and every KPI definition is an editable example. The template makes no safety, permitting, licensing or regulatory claim; your company decides how incidents, utility strikes and other KPIs are defined and counted.
About the Author
Built by PK, Microsoft Certified Professional with 15+ years of Excel, Google Sheets and Power BI experience and founder of NextGenTemplates, reaching 300K+ subscribers across YouTube channels. Every template is hand-built and tested before release.
Conclusion
The Excavation Contractor KPI Dashboard in Google Sheets gives an earthmoving business one monthly page for production, equipment, cost, delivery, quality and revenue, with a trend page for any single KPI and a group analysis that shows where to act next.
Click here to Purchase the Excavation Contractor KPI Dashboard in Google Sheets
Instant download · One-time payment · No subscription
Last updated: September 2026
Visit our YouTube channel: Youtube.com/@NeoTechNavigators