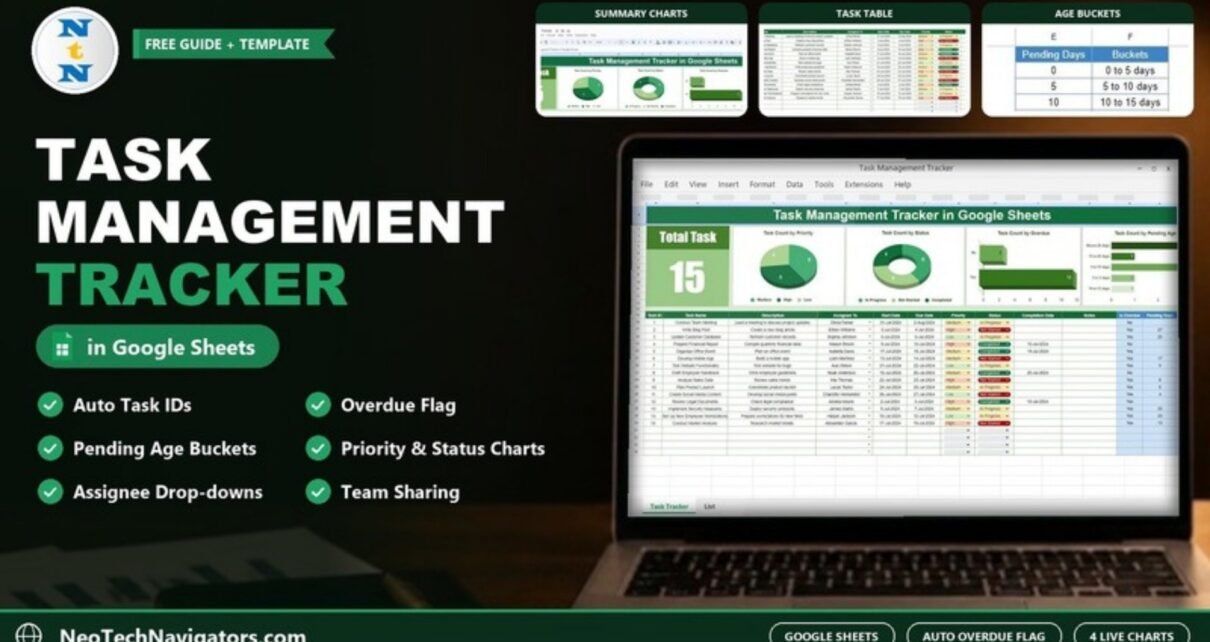
A Task Management Tracker in Google Sheets gives you one shared place to log every task, see who owns it, and spot what is late before it turns into a problem. This guide walks through a ready-made tracker that combines a task table with five visuals: a Total Task card, priority and status charts, an overdue chart and a pending-age chart.
It is written for team leads, small business owners, freelancers and anyone who manages work for more than one person. You will see exactly what each part of the sheet does, the formulas that drive it (COUNTA, SEQUENCE, IF, TODAY and VLOOKUP), and how to set it up with your own tasks.
🎥 Watch the Video Tutorial
Get the Task Management Tracker

What the Task Management Tracker in Google Sheets Includes
The main tracker tab holds the visuals and the task table; a separate List tab holds the drop-down names and the pending-age buckets.
| Part | What it shows | Sample value in the screenshots |
|---|---|---|
| Total Task card | Number of tasks entered | 15 |
| Task Count by Priority (3D pie) | Tasks split into High, Medium and Low | Medium 6, High 5, Low 4 |
| Task Count by Status (3D doughnut) | In Progress, Not Started and Completed | In Progress 6, Not Started 5, Completed 4 |
| Task Count by Overdue (bar) | Tasks flagged Yes or No in the Is Overdue column | Yes 12, No 3 |
| Task Count by Pending Age (bar) | Open tasks grouped by how long they have been pending | Above 20 days 4, 5 to 10 days 3, 0 to 5 / 10 to 15 / 15 to 20 days 1 each |
| Task table | One row per task with inputs and calculated columns | 15 sample tasks |
| List tab | Assigned To names and the pending-age bucket table | 5 buckets |
The Summary Visuals

Total Task card
The large green card counts every task name in the table. It uses COUNTA on the Task Name column, so blank rows are ignored and the number grows as soon as you type a new task:
=COUNTA(B16:B1009)Task Count by Priority
A 3D pie chart splits tasks into High, Medium and Low. In the sample there are 5 High tasks, which tells you where to put attention first.
Task Count by Status
A 3D doughnut chart shows In Progress, Not Started and Completed. With 4 of 15 tasks completed, the sample team has finished just over a quarter of its list.
Task Count by Overdue
This bar chart counts the Yes and No values in the Is Overdue column. Twelve Yes values against three No values is a clear signal that deadlines need reviewing.
Task Count by Pending Age
Open tasks are grouped into five buckets: 0 to 5 days, 5 to 10 days, 10 to 15 days, 15 to 20 days and Above 20 days. Anything in the top bar has been sitting for three weeks or more.
The Task Table, Column by Column

Input columns
- Task Name and Description: what needs doing.
- Assigned To: a drop-down fed by the names on the List tab.
- Start Date, Due Date and Completion Date: double-click a cell to open the date picker.
- Priority: High, Medium or Low from a drop-down.
- Status: Not Started, In Progress or Completed from a drop-down.
- Notes: anything the next person needs to know.
Task ID
The ID is generated automatically. SEQUENCE creates a running number for every filled Task Name, so you never type or renumber IDs:
=SEQUENCE(COUNTA(B16:B1009))Is Overdue
The formula compares the Due Date (column F) with the Completion Date (column I). If the task is not finished yet, it compares with today instead:
=IF(F16<IF(I16="",TODAY(),I16),"Yes","No")This means a task can be overdue in two ways: it is still open after its due date, or it was completed later than the due date.
Pending Days
For any task that is not Completed and has already started, the sheet counts the days since the Start Date (column E):
=IF(AND(H16<>"Completed",E16<=TODAY()),TODAY()-E16,"")Pending Age
Pending Days is then placed into a bucket with an approximate-match VLOOKUP against the table on the List tab:
=IF(L16="","",VLOOKUP(L16,List!$E$2:$F$6,2,1))
Worked Example From the Sample Data
The screenshots were taken on 30 July 2024. Here is how the formulas treat four of the sample tasks:
| Task | Start / Due / Completed | Status | Is Overdue | Pending Days | Pending Age |
|---|---|---|---|---|---|
| Write Blog Post | 3-Jul / 4-Jul / – | Not Started | Yes | 27 | Above 20 days |
| Prepare Financial Report | 9-Jul / 10-Jul / 10-Jul | Completed | No | – | – |
| Organize Office Event | 17-Jul / 18-Jul / 19-Jul | Completed | Yes | – | – |
| Conduct Market Analysis | 17-Jul / 19-Jul / – | Not Started | Yes | 13 | 10 to 15 days |
“Organize Office Event” is a useful case: it is finished, but because it was completed one day after the due date, it still counts as overdue. That keeps late deliveries visible in the overdue chart.
How to Use It With Your Own Data
- Open the List tab and replace the sample names with your team members. The Assigned To drop-down picks them up.
- Clear the sample rows in the task table, keeping the formulas in Task ID, Is Overdue, Pending Days and Pending Age.
- Enter each task with a name, owner, start date, due date and priority.
- Update Status as work moves, and add the Completion Date when a task is done.
- Review the charts at the start of each week, beginning with the Overdue and Pending Age charts.
- If your team prefers different bands, edit the bucket table on the List tab (for example 0, 3, 7, 14, 30 days).
Real-World Use Cases
- Small marketing team: blog posts, social content and campaign tasks with clear owners and dates.
- Operations or admin office: recurring jobs such as reports, audits and supplier follow-ups, where pending age shows what keeps slipping.
- Freelancer with several clients: use Assigned To for the client name instead of a person and see which client’s work is overdue.
Tips and Common Mistakes
- Typing over a formula column: the blue columns are calculated. If one shows a value you typed, copy the formula down again from the row above.
- Text instead of dates: use the date picker. A date typed as text breaks the TODAY() comparisons.
- Boundary values: because the VLOOKUP uses approximate match, exactly 5 pending days falls into “5 to 10 days”, and exactly 20 falls into “Above 20 days”.
- Missing completion dates: if Status is Completed but Completion Date is empty, Is Overdue compares with today and may show Yes. Always fill both.
- Checking a chart number: a quick COUNTIF such as
=COUNTIF(H16:H1009,"Completed")lets you confirm a count by hand.
Who Should Not Use This Tracker
It is a lightweight spreadsheet tracker. It does not send email reminders, track time spent, show task dependencies or draw a Gantt timeline. If you need those, a dedicated project tool or a Gantt-style sheet is a better fit.
Related Guides
If you want to rank work by urgency on a Kanban-style view, see the Task Priority Tracker in Google Sheets. For a simpler personal list, try the To Do List in Google Sheets. Teams logging problems rather than tasks can use the Project Management Issue Tracker, and the Pro Gantt Chart in Google Sheets covers timelines. To understand the bucket lookup in depth, read mastering the VLOOKUP function in Google Sheets.
If you want to go further with structured lessons on lookups, IF logic and date formulas, the Excel AI Mastery: 100 Formulas course on NextGenTemplates Academy covers the same functions step by step.
Frequently Asked Questions
How does the tracker decide a task is overdue?
It compares the Due Date with the Completion Date. If there is no completion date, it compares with today. If the due date is earlier, the task shows Yes.
Can I add more team members to the Assigned To list?
Yes. Add the names on the List tab and they appear in the Assigned To drop-down.
How many tasks can the sheet hold?
The formulas reference rows 16 to 1009, which gives room for roughly a thousand tasks. You can extend the ranges if you need more.
Why is Pending Days blank for some open tasks?
The formula only counts tasks whose Start Date is today or earlier. A task scheduled to start in the future shows blank until that day arrives.
Can several people update the tracker at the same time?
Yes. It is a normal Google Sheets file, so you can share it with edit access and everyone sees changes in real time.
Wrapping Up
This Task Management Tracker in Google Sheets keeps the essentials simple: one table for every task, automatic IDs, an overdue flag that also catches late completions, and a pending-age view that shows what has been stuck the longest. Start by adding your team on the List tab, enter this week’s tasks, and check the Overdue chart every Monday.
Get the Task Management Tracker
Related template: Task Priority Tracker in Google Sheets.
📅 Last updated: October 2026