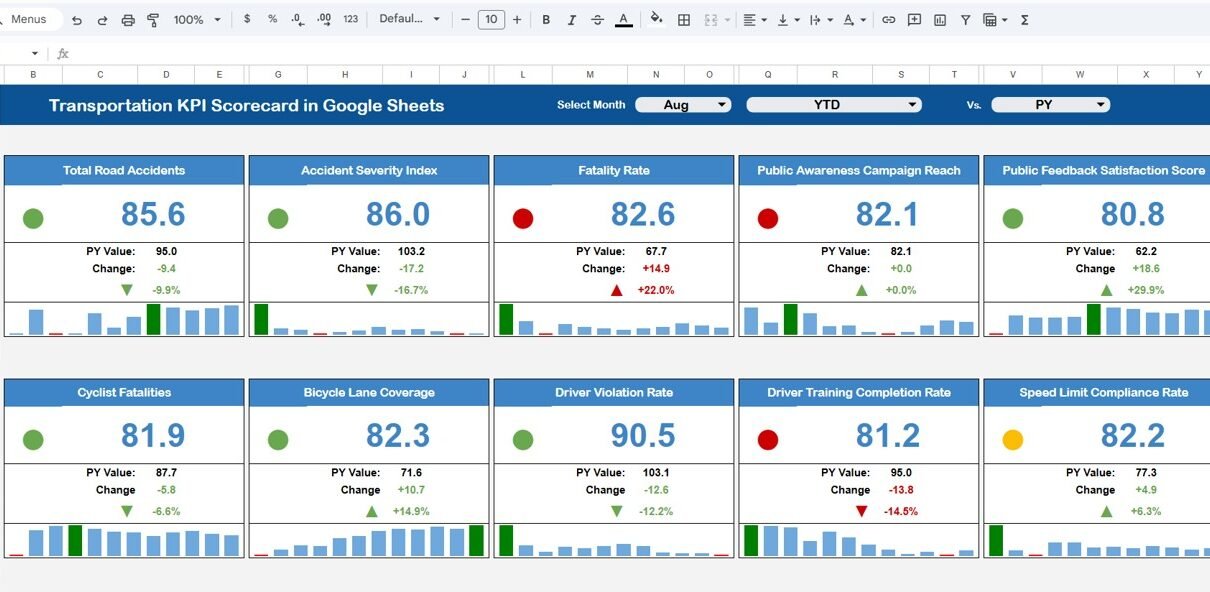
Transportation businesses operate in a fast-paced environment. Deliveries must reach on time. Fuel costs fluctuate. Driver performance impacts service quality. Therefore, transportation companies must monitor KPIs continuously. However, many companies still track performance manually. As a result, they struggle to compare monthly performance. They fail to identify weak areas quickly. Moreover, they cannot analyze year-to-date […]
Blog
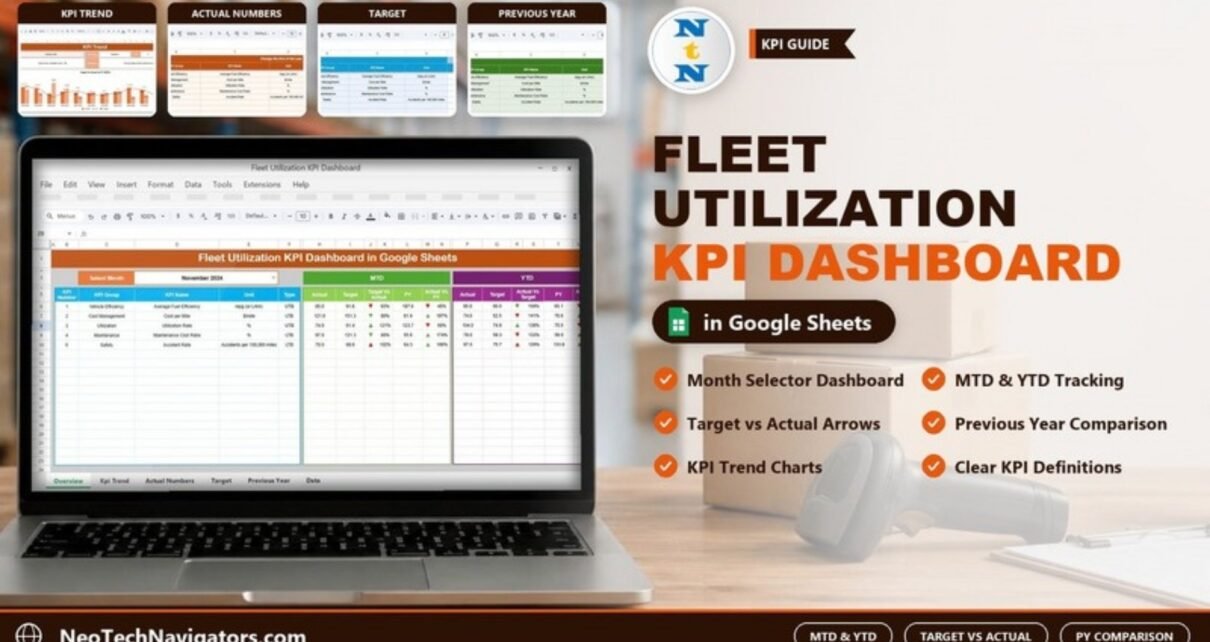
Fleet Utilization KPI Dashboard in Google Sheets
How the Fleet Utilization KPI Dashboard in Google Sheets compares five fleet KPIs (fuel efficiency, cost per mile, utilization rate, maintenance cost ratio and accident rate) with targets and last year on an MTD and YTD basis, with formulas and setup steps.
Legal KPI Scorecard In Google Sheets
The Legal KPI Scorecard in Google Sheets is a ready-to-use performance tracking template designed to help legal teams monitor, measure, and evaluate key legal KPIs in a clear and structured manner. Instead of managing scattered reports and manual calculations, this scorecard consolidates monthly and yearly legal performance metrics into one interactive Google Sheets scorecard. As […]
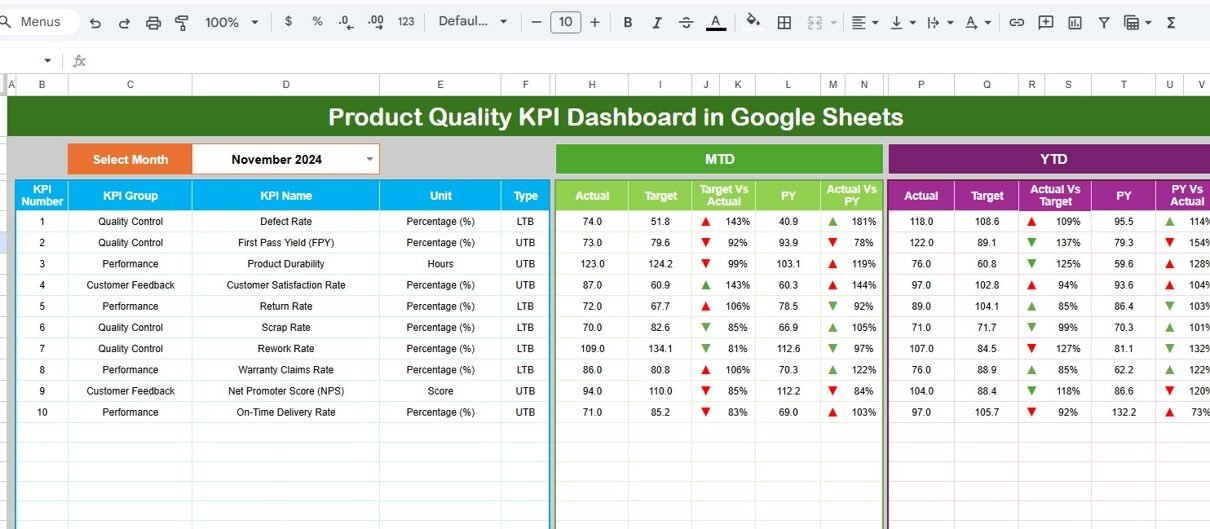
Product Quality KPI Dashboard in Google Sheets
The Product Quality KPI Dashboard in Google Sheets is a ready-to-use performance tracking solution designed to help organizations monitor, measure, and improve product quality metrics in a structured and visual manner. Instead of tracking quality KPIs across multiple spreadsheets and manual reports, this dashboard consolidates MTD, YTD, target, and previous-year performance into one interactive Google […]
CSR Program Performance & Impact Dashboard in Google Sheets
The CSR Program Performance & Impact Dashboard in Google Sheets is a ready-to-use analytics solution designed to help organizations track, measure, and evaluate the effectiveness of their Corporate Social Responsibility (CSR) initiatives.CSR Program Performance & Impact Dashboard in Google Sheets Instead of managing CSR data across multiple spreadsheets and reports, this dashboard consolidates projects, budgets, […]
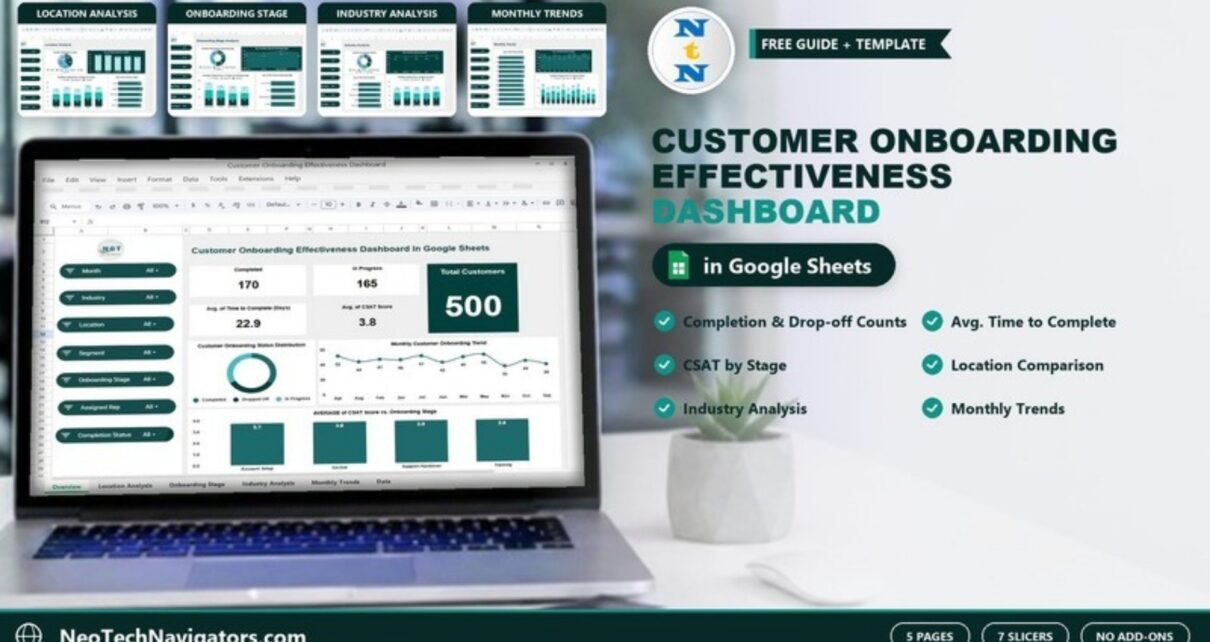
Customer Onboarding Effectiveness Dashboard in Google Sheets
A five-page Google Sheets dashboard that tracks customer onboarding completion, drop-offs, time to complete and CSAT by location, stage, industry and month, with seven slicers for drill-down.
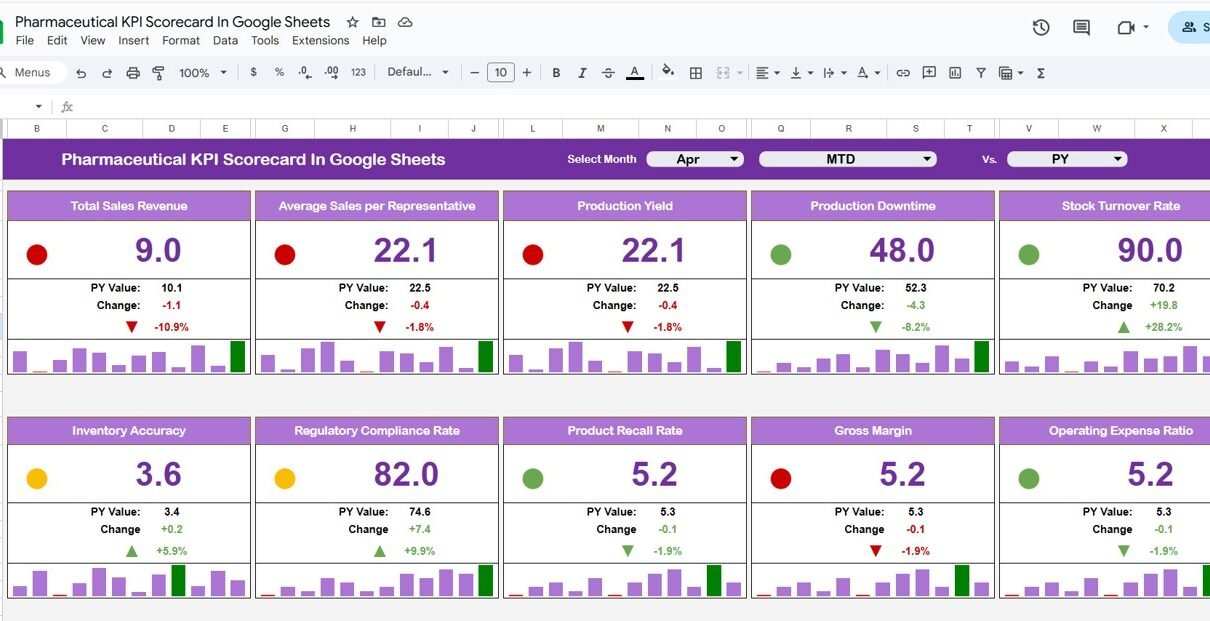
Pharmaceutical KPI Scorecard in Google Sheets
Tracking performance in the pharmaceutical industry requires precision, compliance, and speed. However, when KPIs stay scattered across reports and spreadsheets, performance monitoring becomes slow and unclear. That is exactly why the Pharmaceutical KPI Scorecard in Google Sheets becomes a powerful, ready-to-use solution. This Pharmaceutical KPI Scorecard in Google Sheets is designed as a monthly and […]
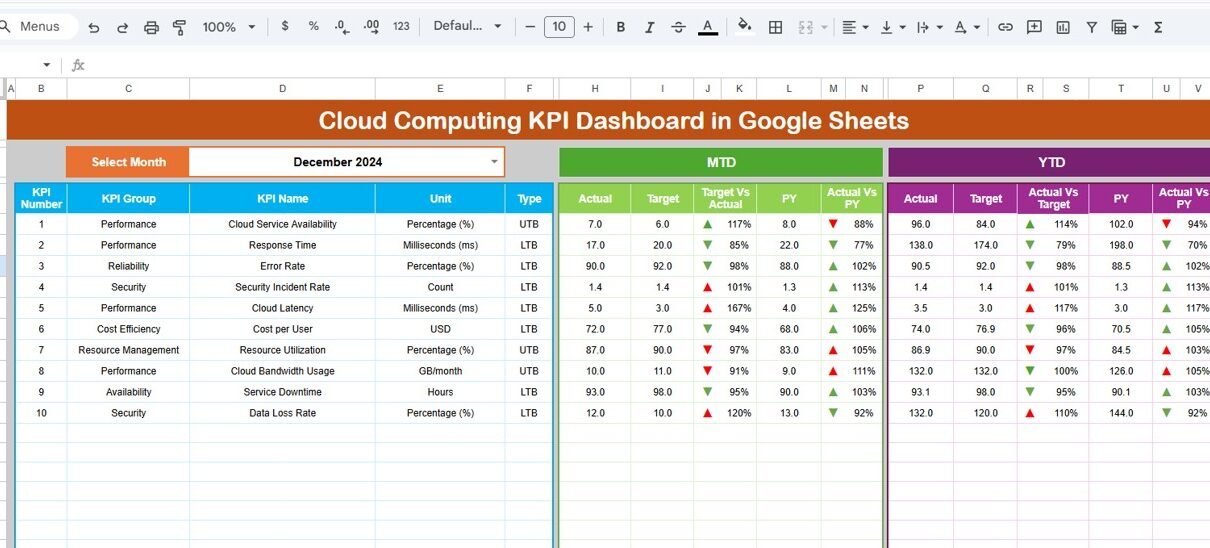
Cloud Computing KPI Dashboard in Google Sheets
Cloud infrastructure powers modern digital businesses. However, without continuous monitoring, cloud costs, performance, and availability can quickly go out of control. That is exactly why a Cloud Computing KPI Dashboard in Google Sheets becomes essential. This ready-to-use Cloud Computing KPI Dashboard in Google Sheets helps organizations track operational, financial, performance, and reliability KPIs in one […]
Employee Performance and Attrition Dashboard in Google Sheets
Managing employee performance and reducing attrition are two of the biggest challenges for modern organizations. When employee data stays scattered across spreadsheets, HR systems, and reports, leaders struggle to identify trends and take timely action. That is exactly where the Employee Performance and Attrition Dashboard in Google Sheets becomes a powerful, ready-to-use solution. In this […]
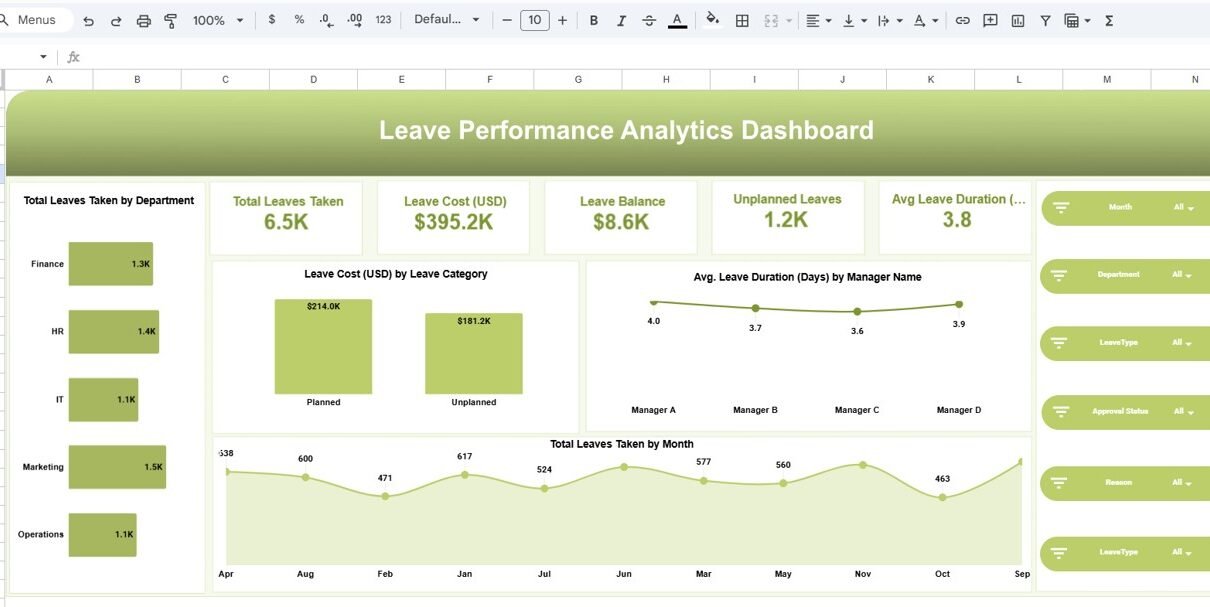
Leave Performance Analytics Dashboard in Google Sheets
Managing employee leave efficiently plays a critical role in workforce productivity, cost control, and employee satisfaction. However, when leave data remains scattered across registers or raw spreadsheets, decision-making becomes slow and reactive. That is exactly why the Leave Performance Analytics Dashboard in Google Sheets becomes an essential solution. Get the Leave Performance Analytics Dashboard in […]