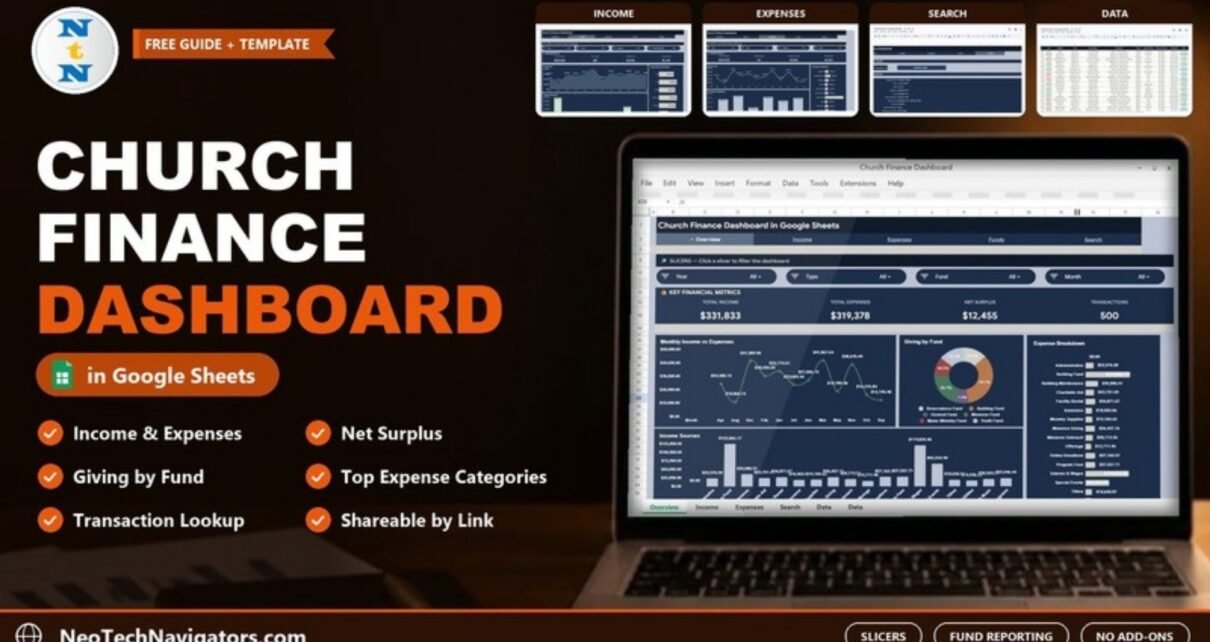
Track church income, expenses, net surplus and giving by fund in one Google Sheets dashboard with slicers and a transaction lookup. This guide explains each tab and how to load your own records.
Online Tutorial for Data Analysis and Automation
Track church income, expenses, net surplus and giving by fund in one Google Sheets dashboard with slicers and a transaction lookup. This guide explains each tab and how to load your own records.
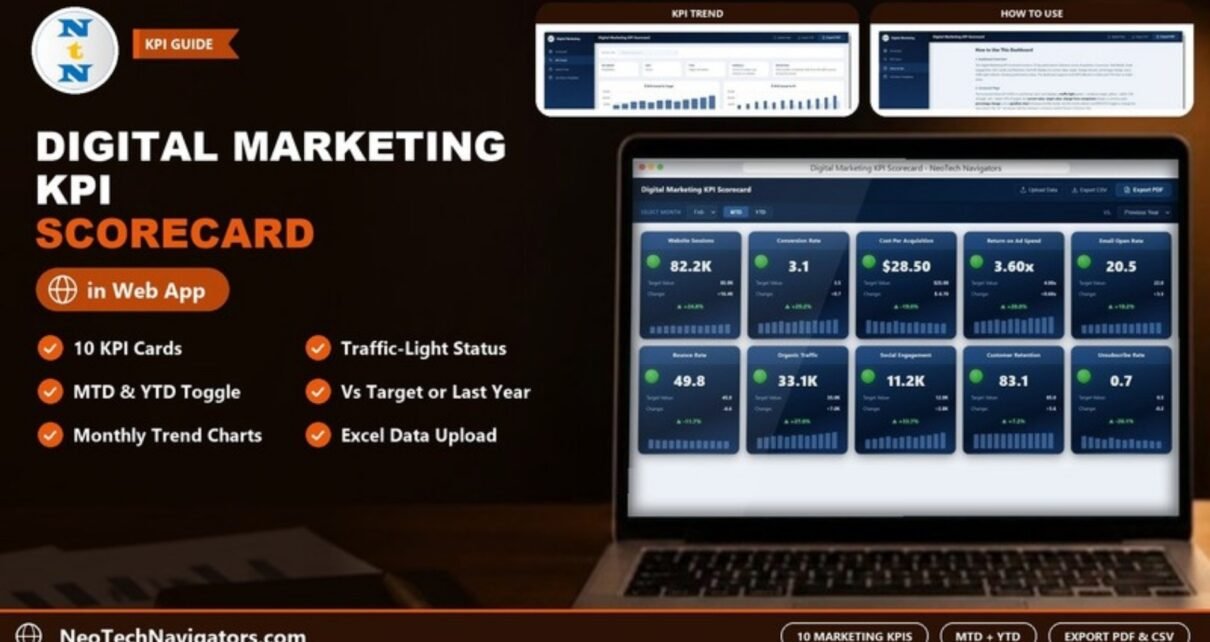
How the Digital Marketing KPI Scorecard in HTML works: ten KPI cards with traffic lights, MTD/YTD and target or previous-year comparison, a KPI Trend page, and an Excel upload for your own numbers.
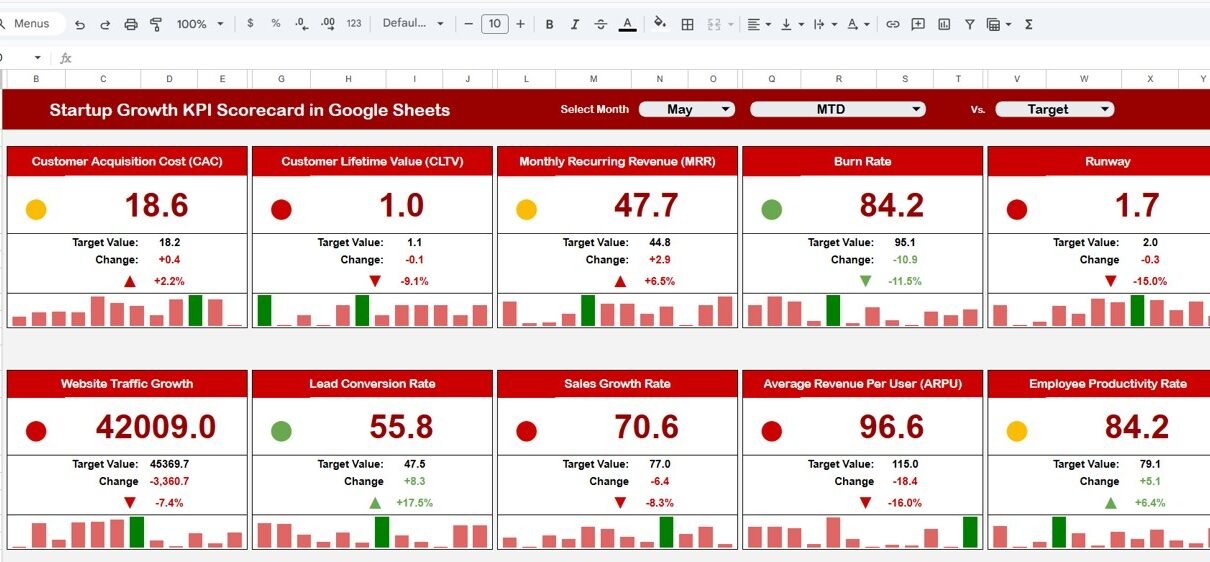
Track 20+ startup KPIs including MRR, churn rate, CAC, and burn rate with MTD/YTD trend analysis, actual vs target comparisons, and prior-year benchmarking in this ready-to-use Google Sheets scorecard template.
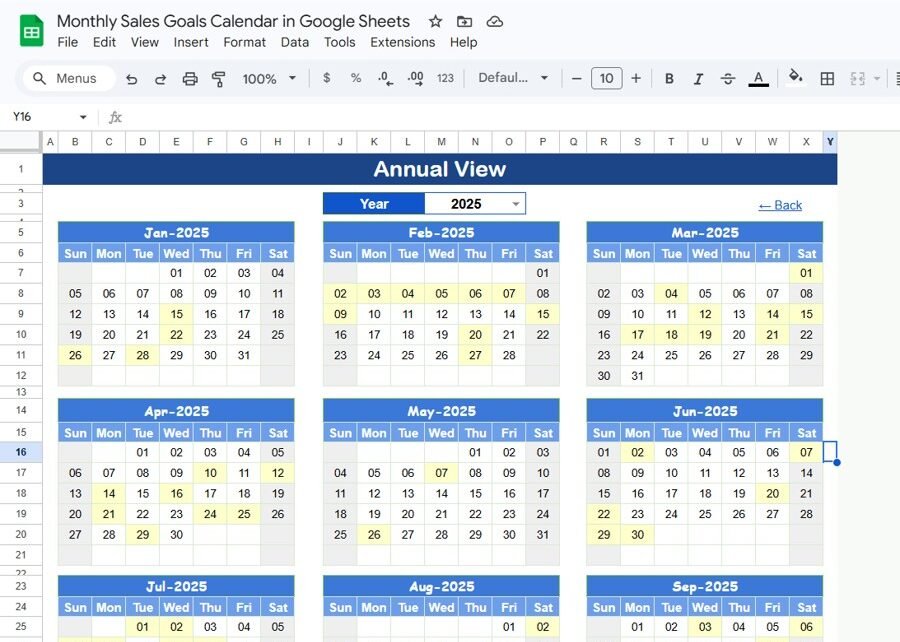
Track monthly sales targets, events, and deadlines across 5 interactive Google Sheets views — Annual, Monthly, Daily, and Events database. Setup under 10 minutes with real-time team collaboration.
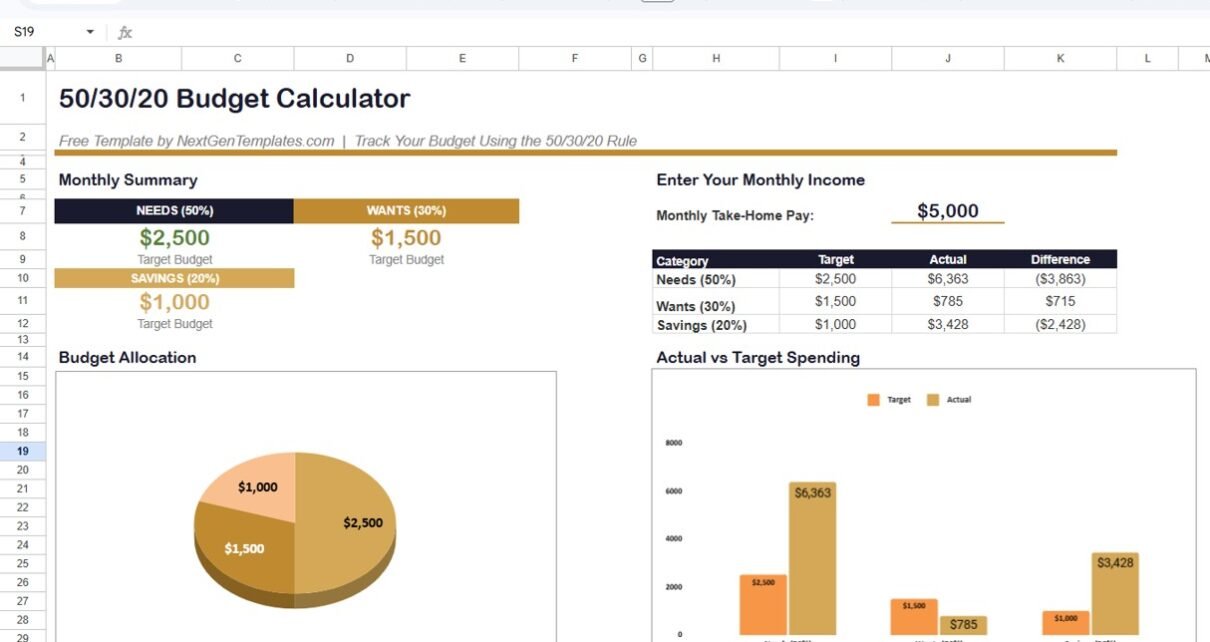
Free Budget Calculator in Google Sheets using the 50/30/20 budgeting rule. Track Needs, Wants, and Savings with 3 allocation cards, pie chart, bar chart, and 15+ expense sub-categories. Download instantly.
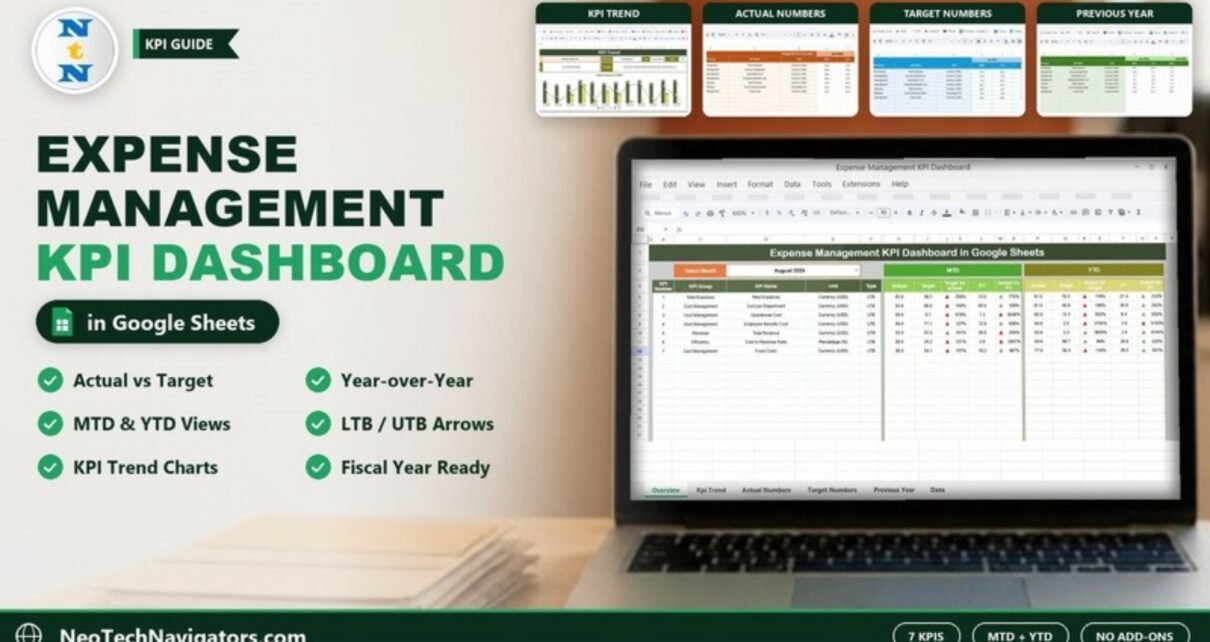
Compare expense KPIs against target and last year, month to date and year to date, in one Google Sheets scorecard. This guide covers all six sheets, the seven sample KPIs and a worked example.
HVAC Service Dashboard in HTML — 5 pages, 6 KPIs, 20+ charts. Track revenue, technicians, regions and SLAs offline. $12.99 one-time, no SaaS subscription.
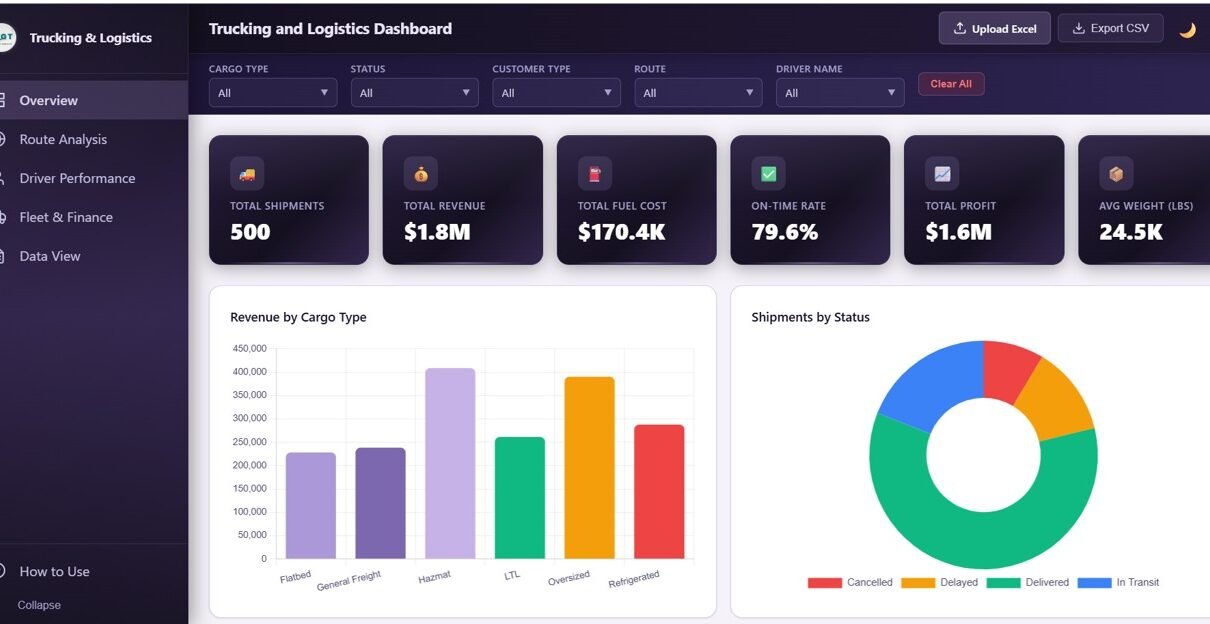
A browser-based trucking and logistics dashboard with 5 interactive pages, 6 KPI cards, and 13 dynamic charts for shipments, revenue, fuel cost, on-time rate, drivers, and fleet profitability. Runs offline in any browser — one-time $12.99 purchase, no subscription, no login.
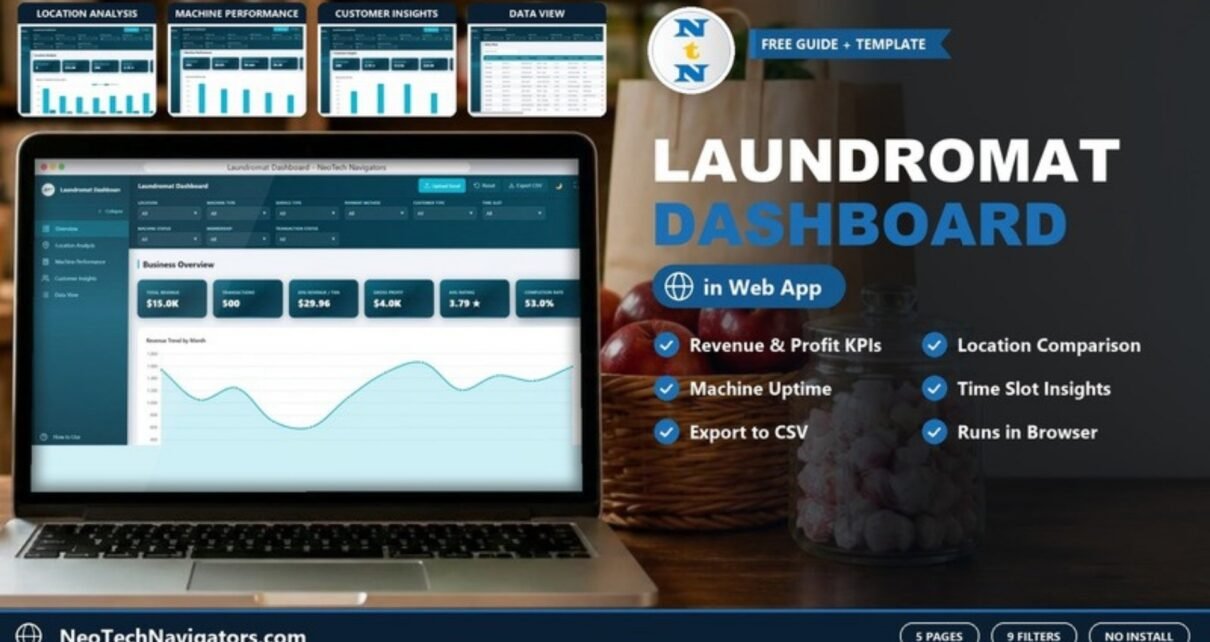
A browser-based laundromat dashboard with five pages for revenue, location costs, machine performance, customer insights and transaction data. See what each page shows and how to load your own POS data.
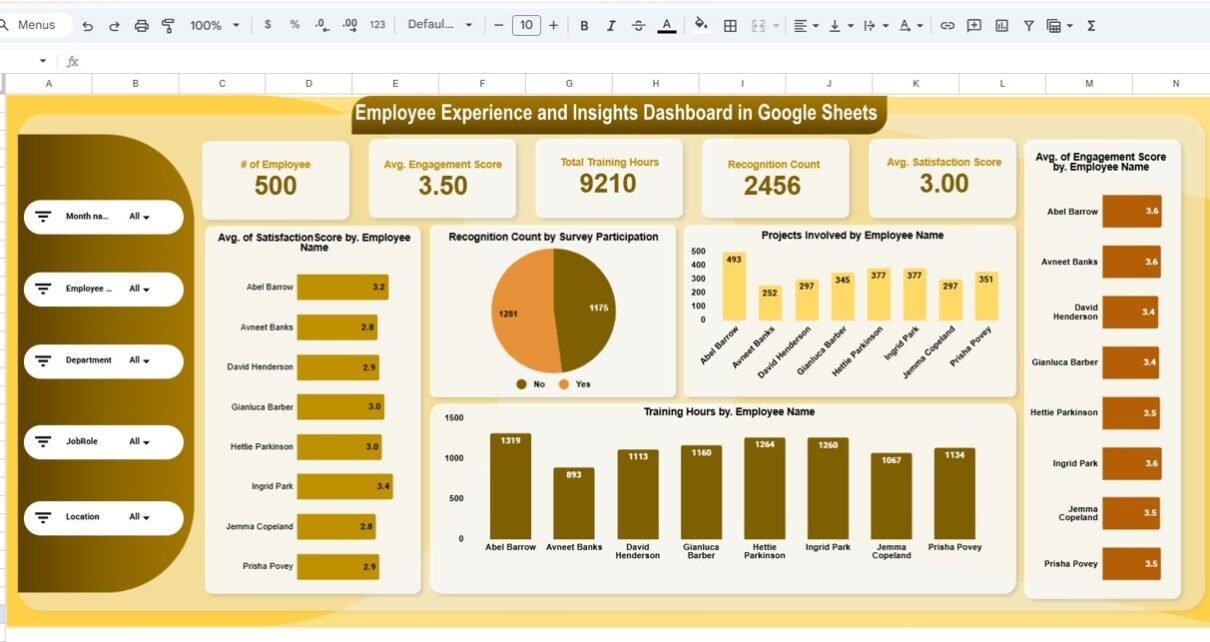
Track employee engagement, satisfaction, training hours, and recognition with this 6-page Employee Experience and Insights Dashboard in Google Sheets. 5 KPI cards, 20+ charts, slicer-based filtering, and multi-dimension analysis by location, department, job role, and month.