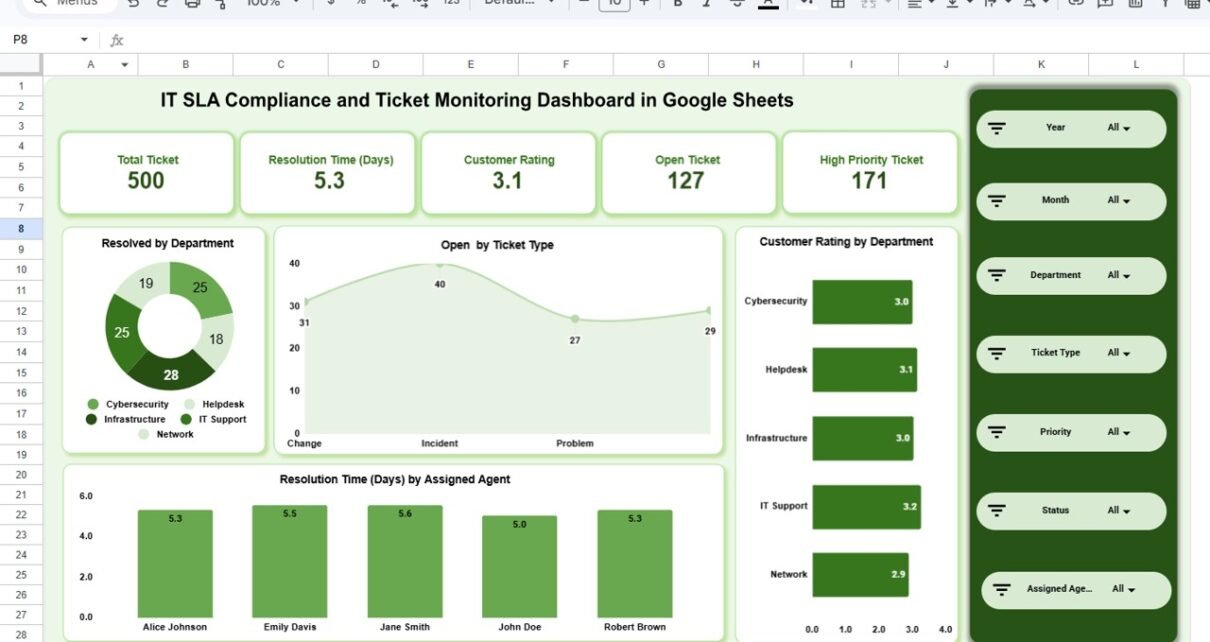
Track IT ticket SLA compliance, response times, agent performance, and ticket trends with this ready-to-use IT SLA Compliance and Ticket Monitoring Dashboard in Google Sheets featuring 4 dashboard pages, data sheet, and search page.
Online Tutorial for Data Analysis and Automation
Track IT ticket SLA compliance, response times, agent performance, and ticket trends with this ready-to-use IT SLA Compliance and Ticket Monitoring Dashboard in Google Sheets featuring 4 dashboard pages, data sheet, and search page.
Free SQL quiz with 75 questions on SELECT, WHERE, joins, GROUP BY, subqueries and window functions. 20 random questions per attempt, with instant feedback.

SQL LEFT JOIN tutorial: return every row from the left table with matching right rows or NULL, find rows with no match, ON vs WHERE filtering, and examples.

SQL INNER JOIN tutorial: return only rows that match in both tables, syntax with ON, combining with GROUP BY, filtering joined results, and examples.

SQL introduction for beginners: what SQL is, what a relational database is, the main SQL commands, which databases use it, and how to run your first query.
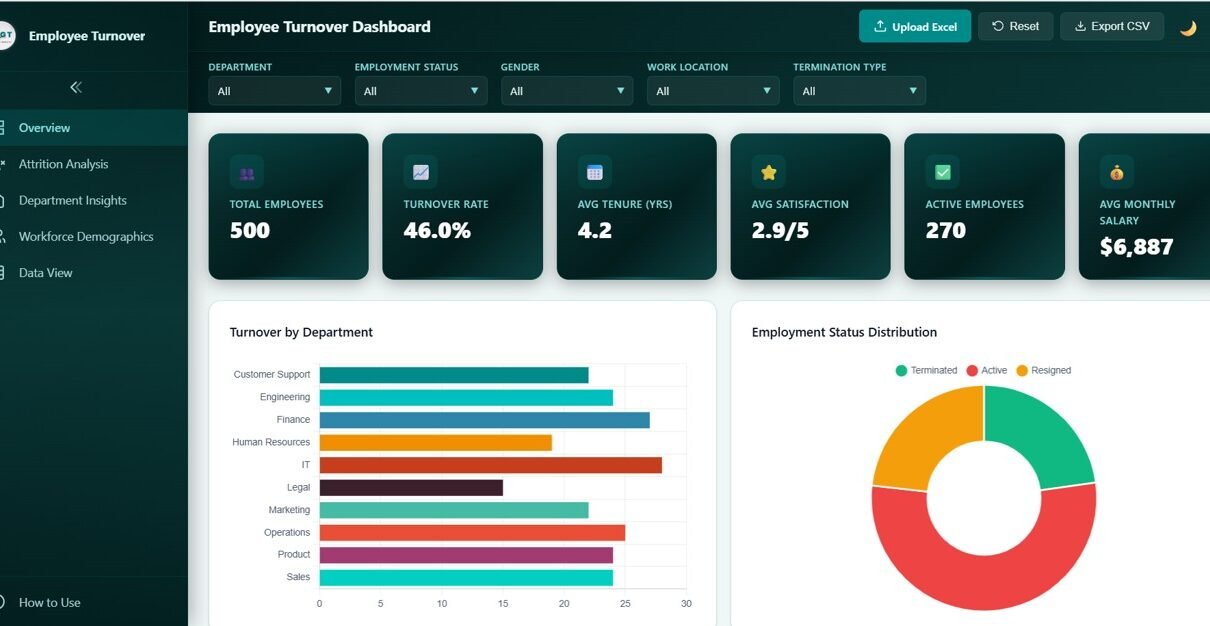
A browser-based Employee Turnover Dashboard in HTML with five pages, KPI cards, about 20 charts, five global filters and a searchable employee table with CSV export.
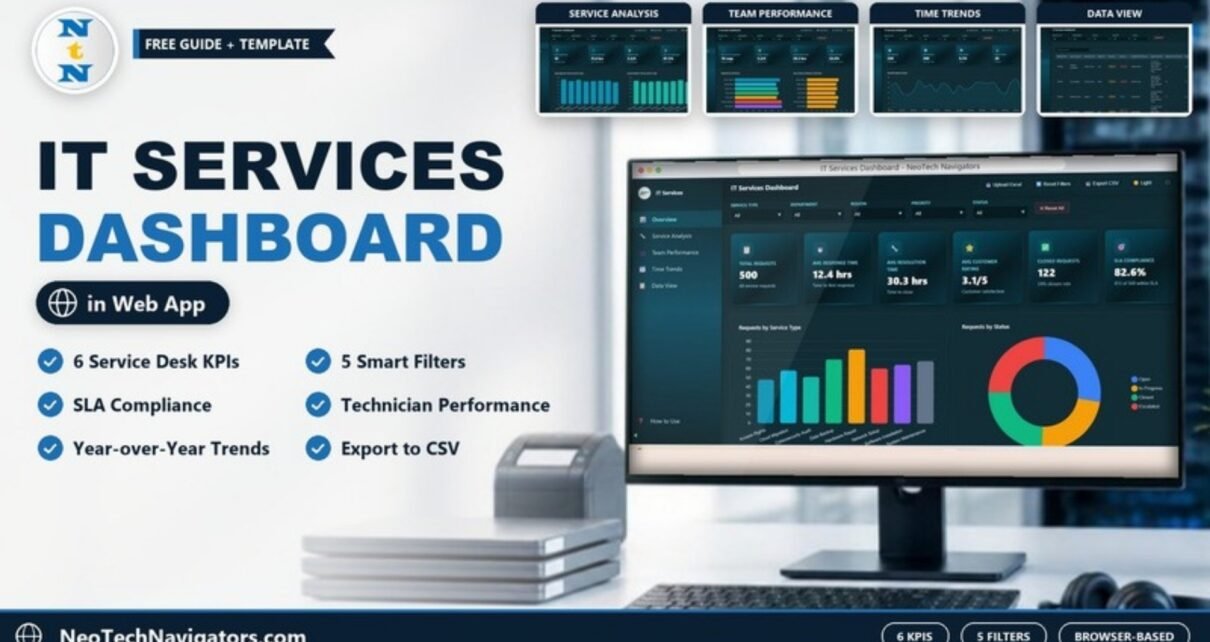
A page-by-page guide to the IT Services Dashboard in HTML: six service-desk KPIs, five filters, service, technician and time-trend analysis, and a searchable data view, all running in the browser.
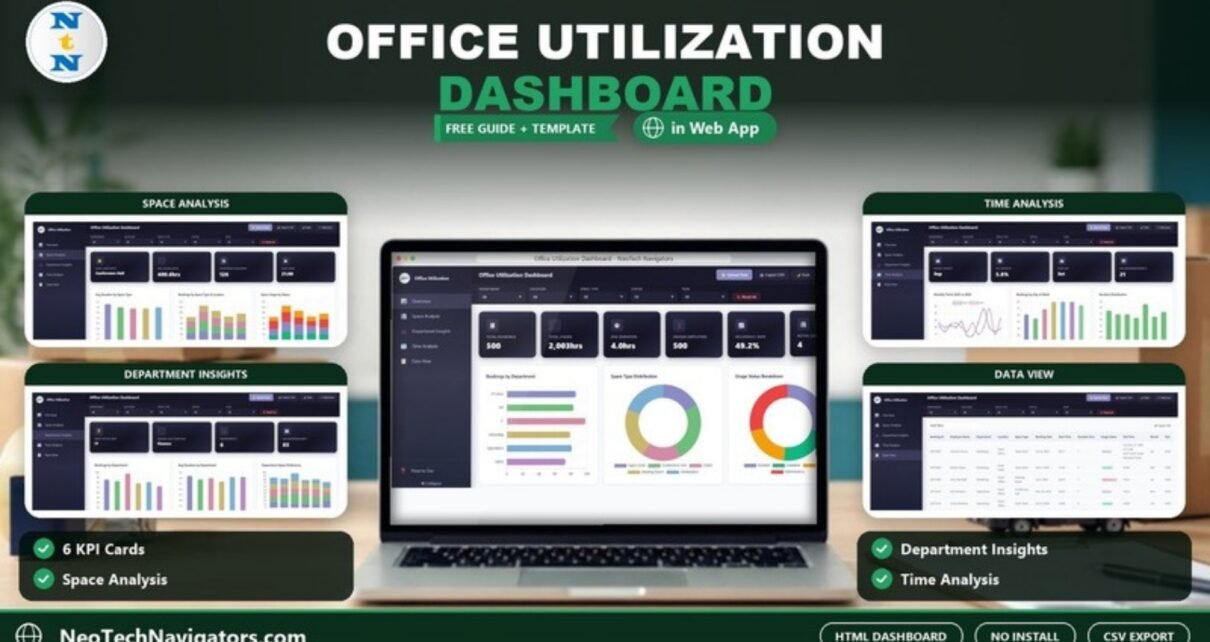
A walkthrough of the Office Utilization Dashboard in HTML: six KPIs including occupancy rate and total hours, the Space Analysis, Department Insights, Time Analysis and Data View pages, the filter bar and how to load your own booking data.
Introduction Tracking performance is crucial for any successful e-commerce business. The E-commerce KPI Scorecard In Google Sheets offers a ready-to-use, customizable solution to monitor your key performance indicators seamlessly. Designed for ease and clarity, this scorecard allows you to visualize and analyze your business data effectively, ensuring you stay on top of your goals and […]
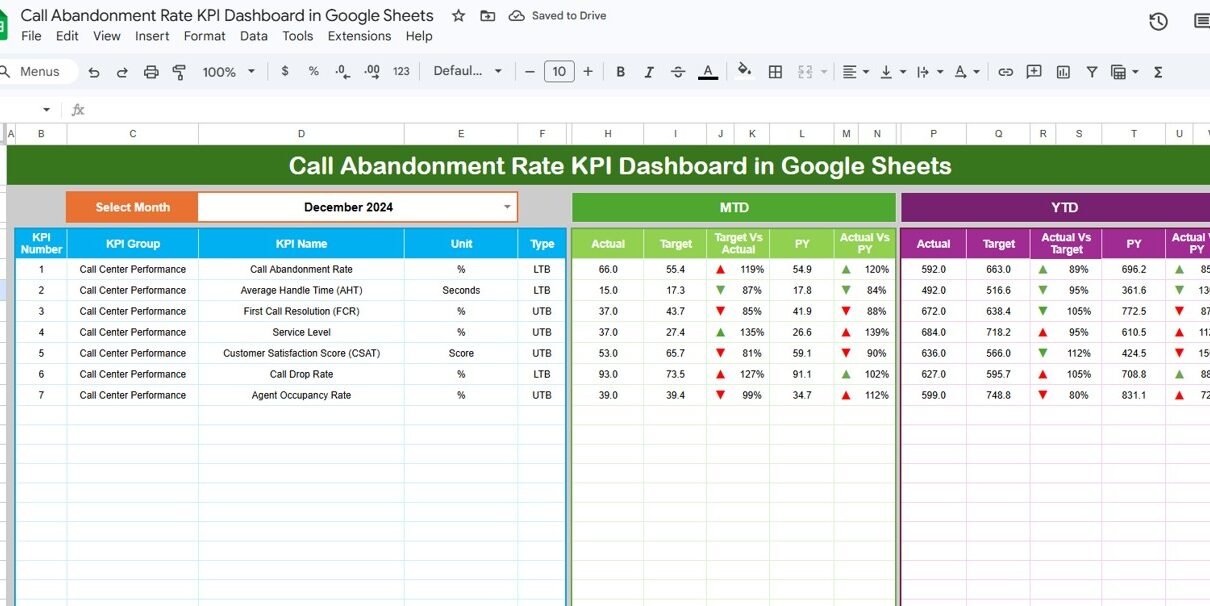
Introduction The Call Abandonment Rate KPI Dashboard in Google Sheets is a comprehensive and ready-to-use template designed to help businesses monitor, analyze, and improve their call handling efficiency. Call abandonment rate is a vital Key Performance Indicator (KPI) that measures the percentage of calls that are terminated by the customer before reaching a service agent. […]