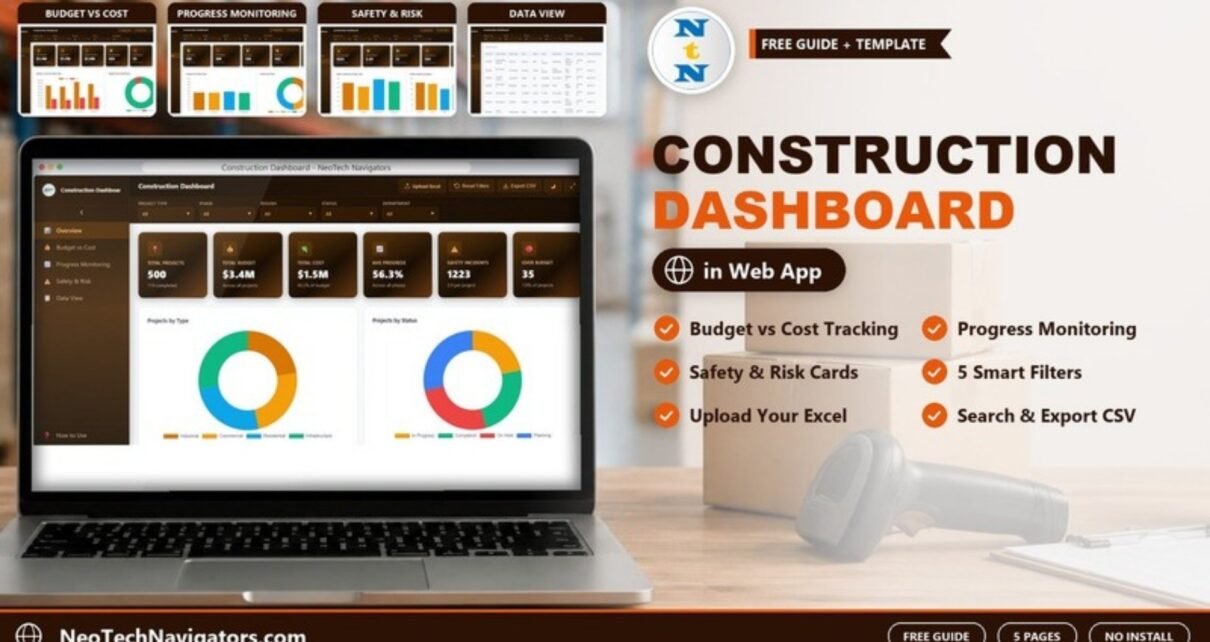
A five-page browser dashboard for construction portfolios that tracks budget vs cost, progress and safety incidents, with filters for project type, phase, region, status and department.
Online Tutorial for Data Analysis and Automation
A five-page browser dashboard for construction portfolios that tracks budget vs cost, progress and safety incidents, with filters for project type, phase, region, status and department.
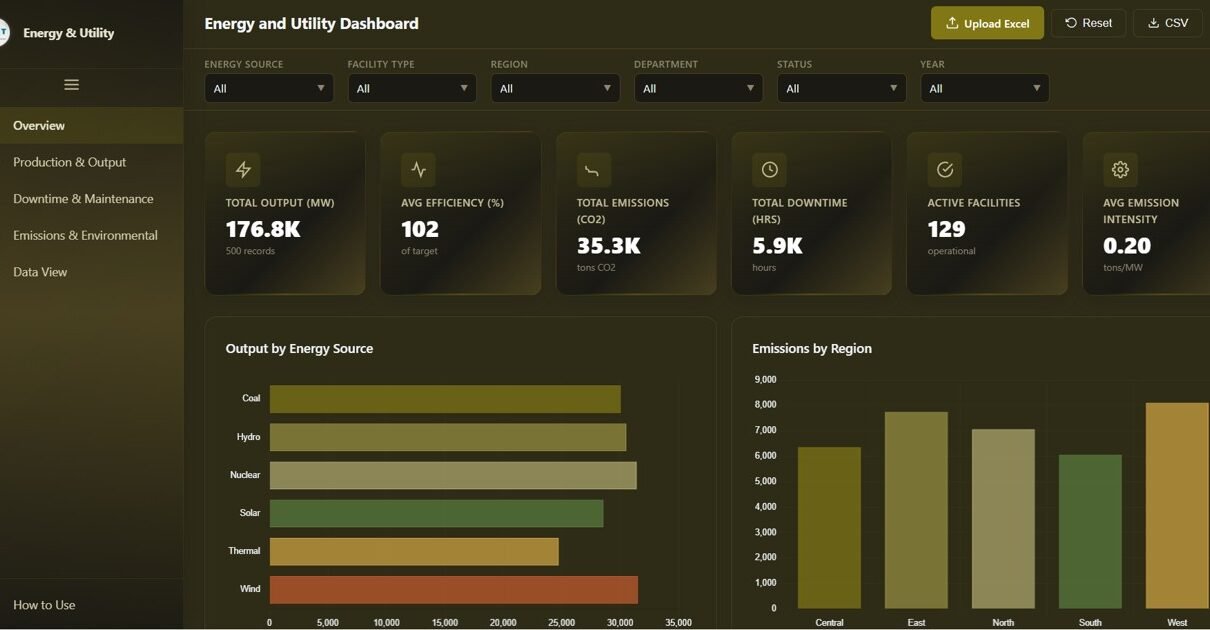
Track energy output, emissions, efficiency, and facility downtime with this interactive Energy and Utility Dashboard in HTML. Features five analysis pages with dynamic KPI cards, filters, charts, and CSV export.
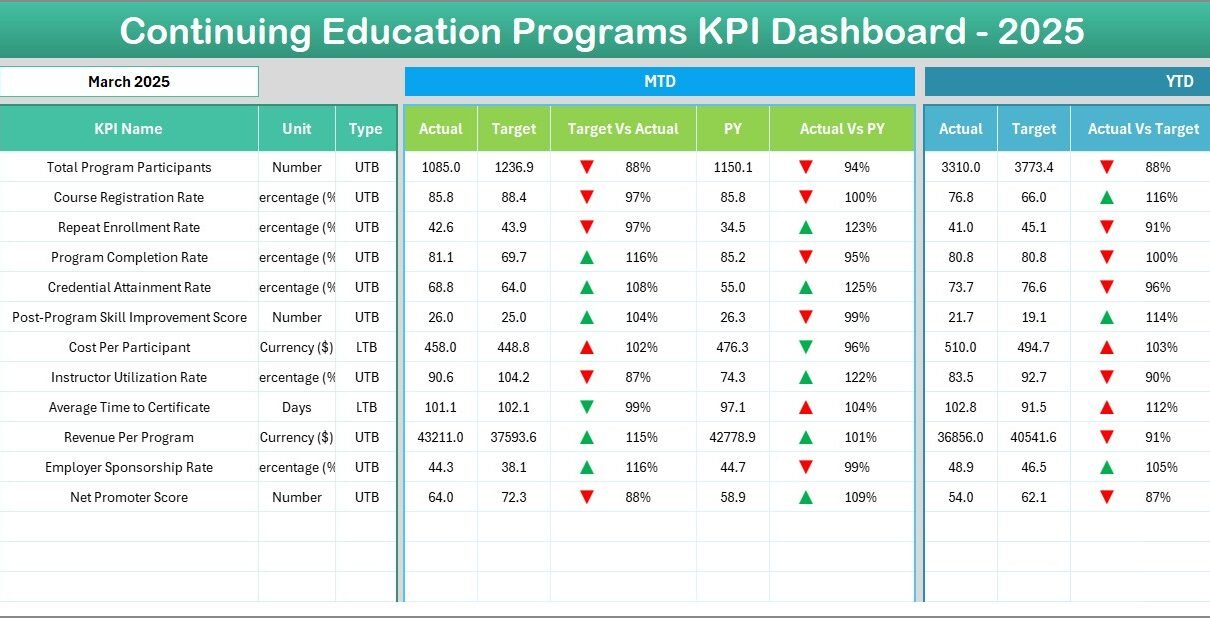
Track gaming KPIs with this ready-to-use Gaming KPI Scorecard in Google Sheets. Monitor MTD, YTD, target vs actual, trend analysis, and year-over-year comparisons with automated traffic light indicators and dynamic dropdowns.
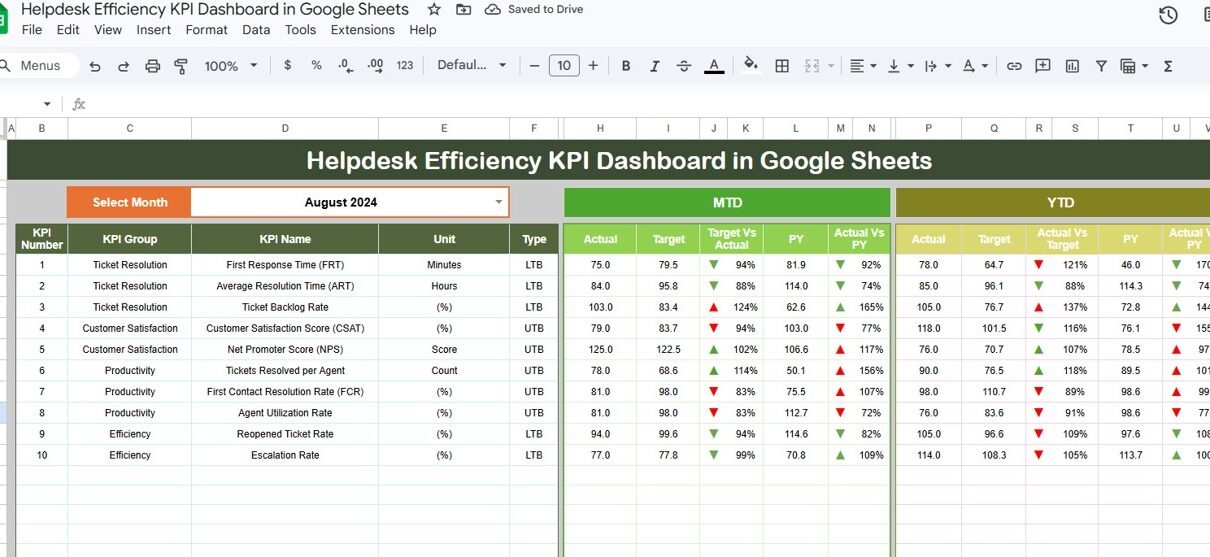
Track and optimize helpdesk performance with this ready-to-use KPI Dashboard in Google Sheets. Monitor MTD and YTD actuals vs targets with trend charts, conditional formatting, and a complete KPI definition library.
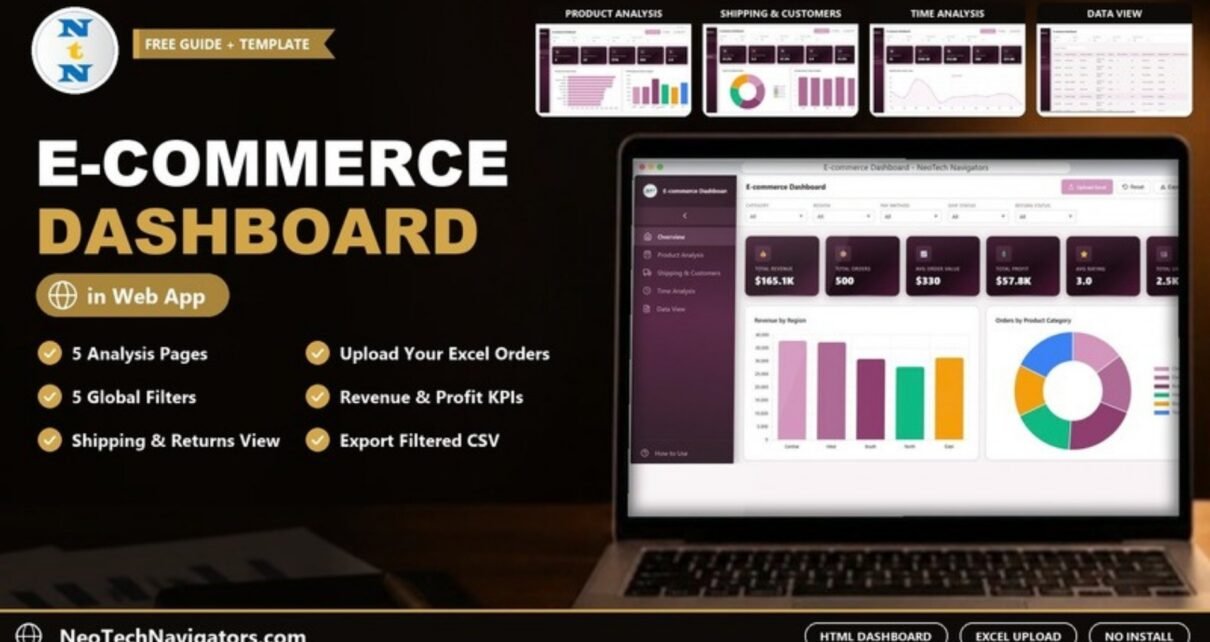
A browser-based E-commerce Dashboard in HTML with five pages, global filters, Excel upload and CSV export to track revenue, products, shipping, returns and monthly trends.
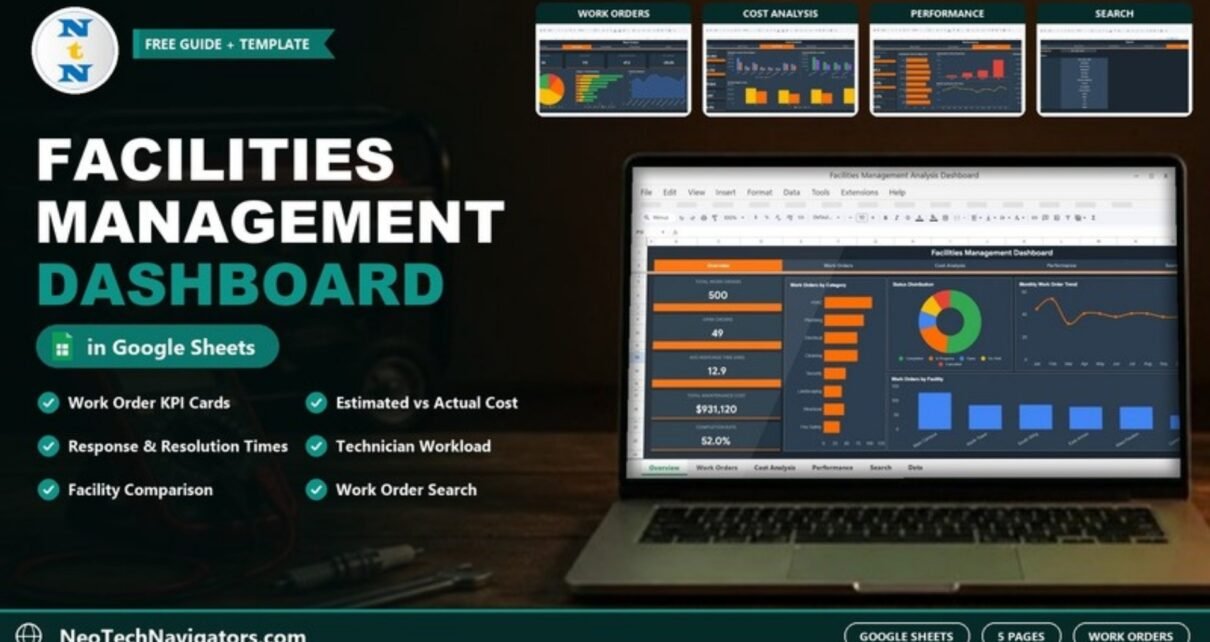
A five-page Facilities Management Analysis Dashboard in Google Sheets for work order volume, estimated vs actual maintenance cost, response and resolution times, technician workload and single-order search.
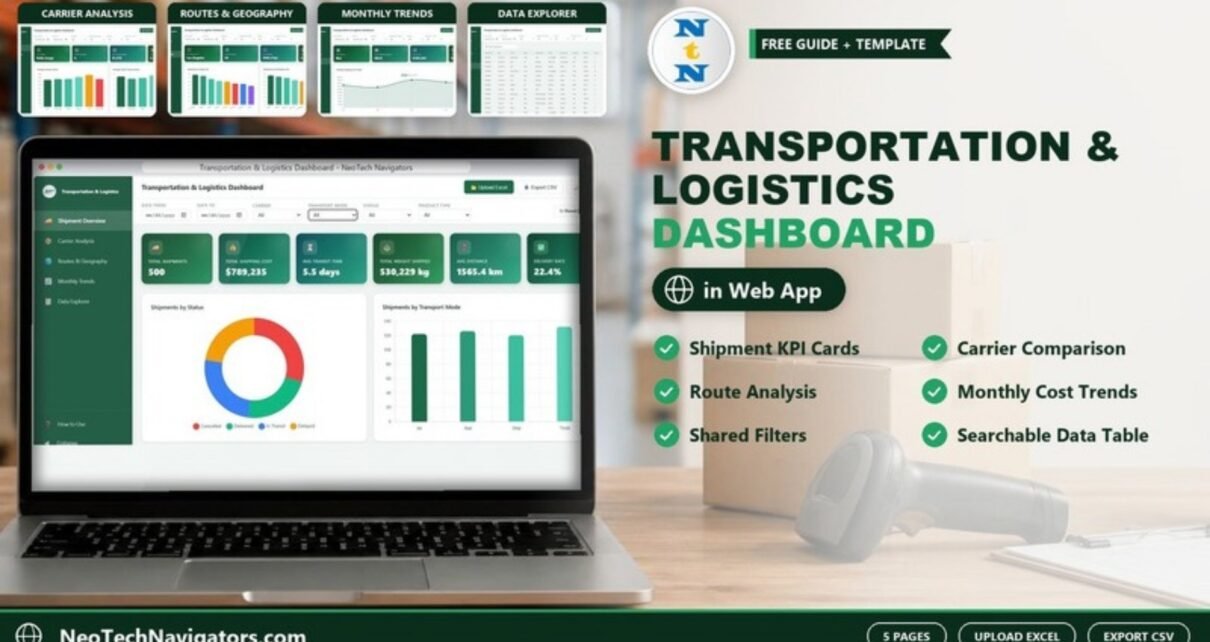
A browser-based Transportation and Logistics Dashboard in HTML with five pages for shipments, carriers, routes, monthly trends and a searchable data table. Upload your Excel shipment data, filter by carrier, mode, status or product type, and export to CSV.
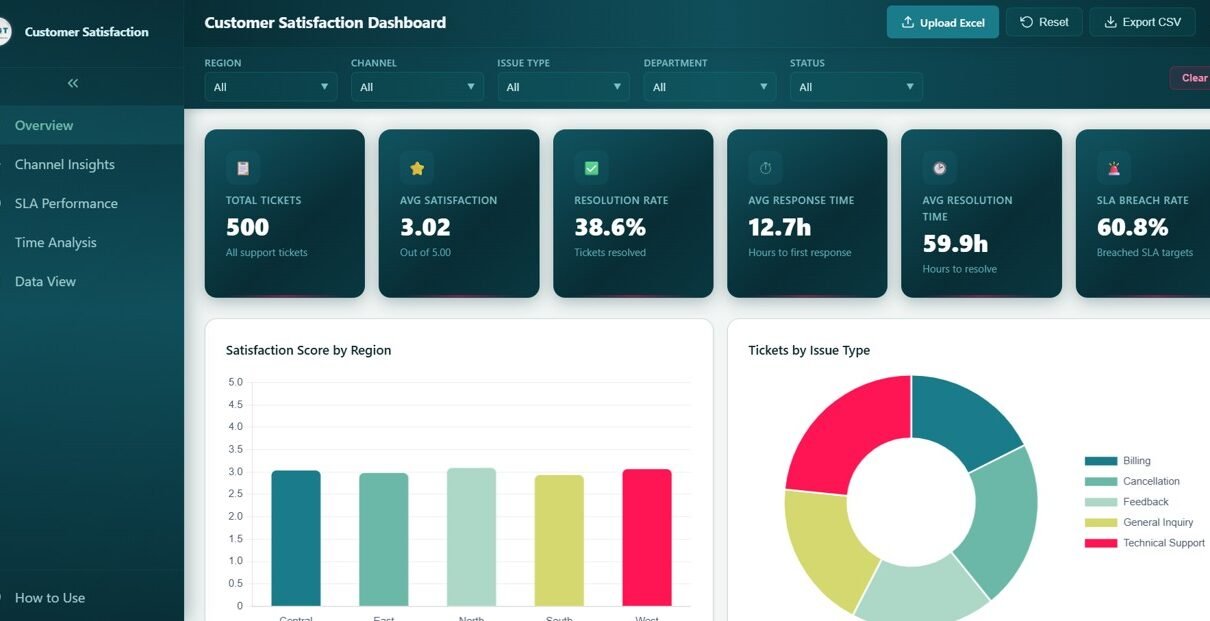
Customer Satisfaction Dashboard in HTML is an interactive, browser-based analytics template to track CSAT scores, NPS, resolution times, and feedback trends with dynamic charts and smart filters.
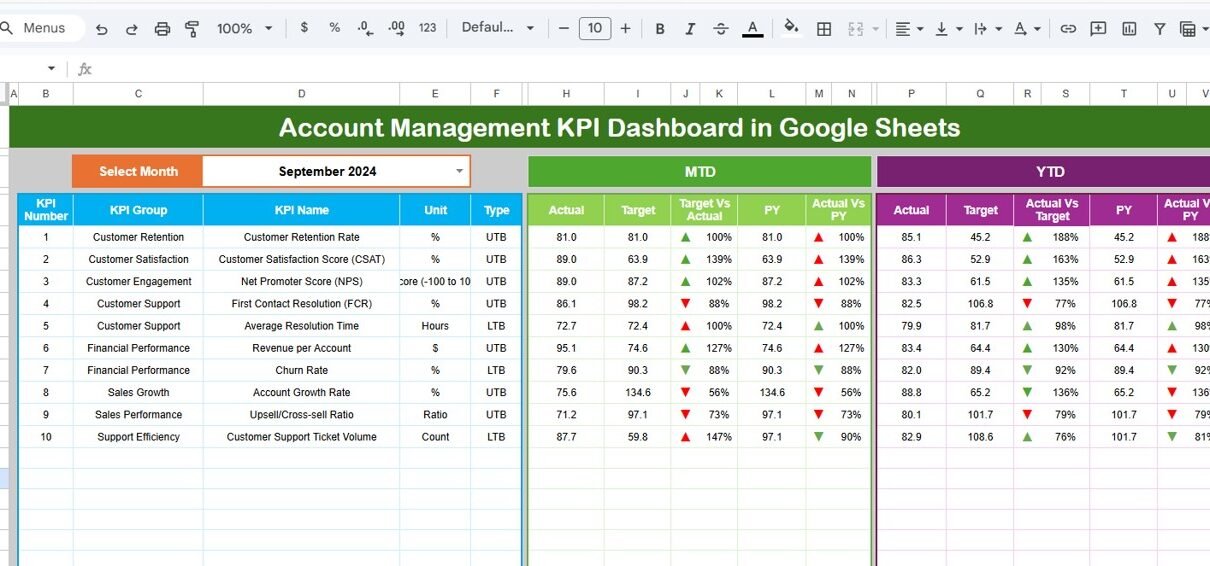
Introduction The Account Management KPI Dashboard in Google Sheets is a comprehensive and easy-to-use tool designed to help businesses track and analyze their key performance indicators effectively. Whether you’re managing customer accounts, sales targets, or growth metrics, this ready-to-use template simplifies monitoring performance metrics with interactive and dynamic features.Account Management KPI Dashboard in Google Sheets […]
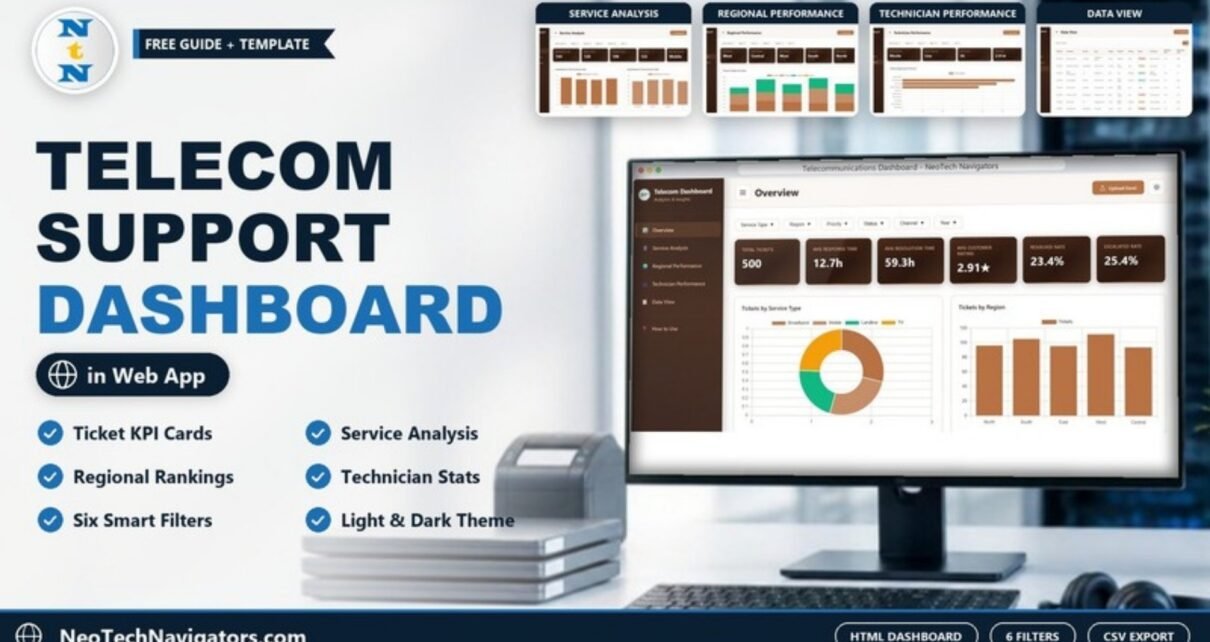
A browser-based telecom support dashboard with KPI cards, service, regional and technician analysis, six filters and a searchable ticket table with CSV export.