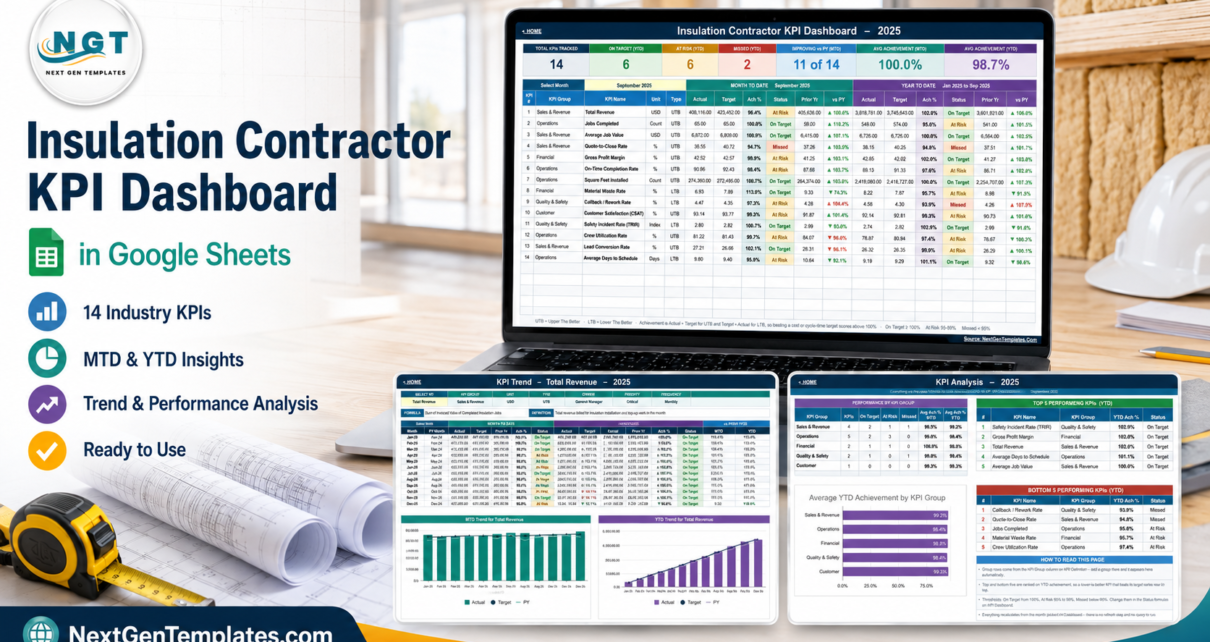
A formula-driven Google Sheets KPI dashboard for insulation contractors: 14 trade KPIs, a month picker, MTD and YTD traffic lights, a twelve-month trend page and a KPI group roll-up.
Online Tutorial for Data Analysis and Automation
Google-Sheet-KPI-Dashboard
A formula-driven Google Sheets KPI dashboard for insulation contractors: 14 trade KPIs, a month picker, MTD and YTD traffic lights, a twelve-month trend page and a KPI group roll-up.
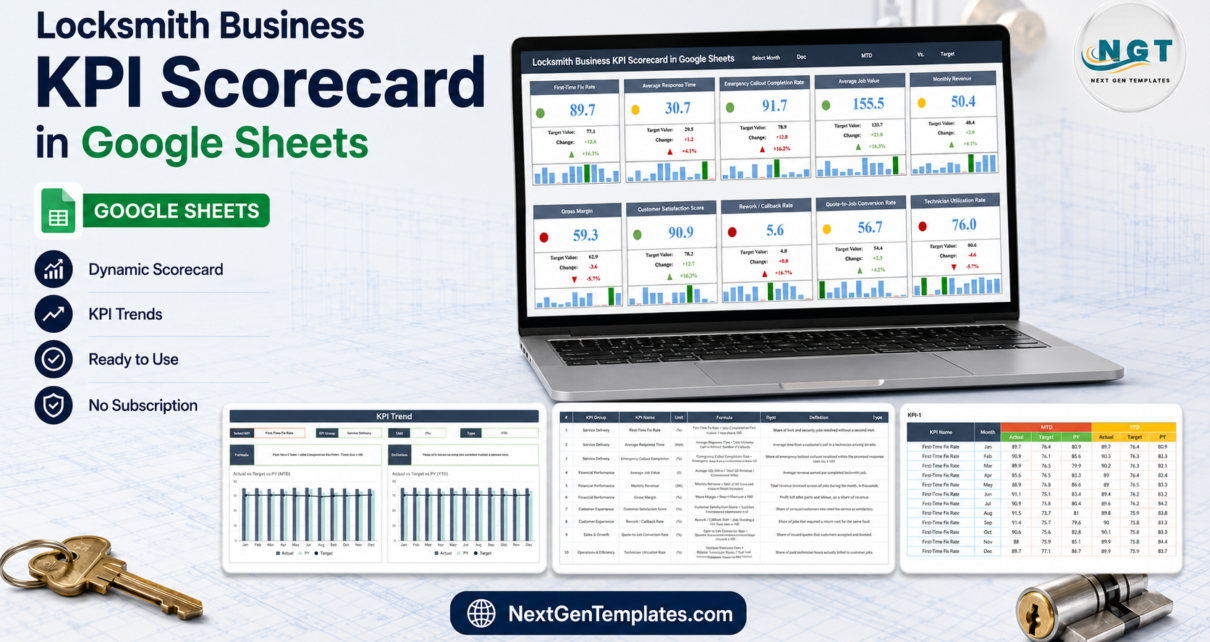
A walkthrough of the Locksmith Business KPI Scorecard in Google Sheets: 10 trade KPIs across 5 groups, MTD/YTD toggles, direction-aware traffic lights, a per-KPI trend page, and the two build defects we found when we opened the workbook.
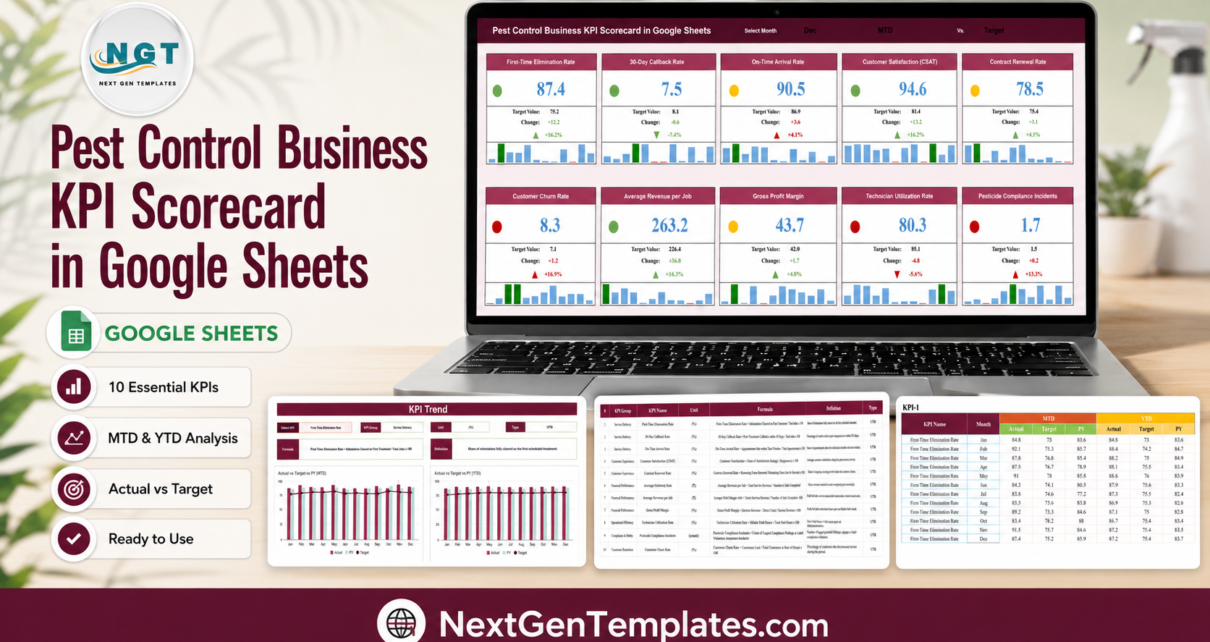
Track ten pest-control KPIs on one screen in Google Sheets – month picker, MTD/YTD against target or prior year, red/amber/green traffic lights, a KPI trend page and a written formula for every metric.
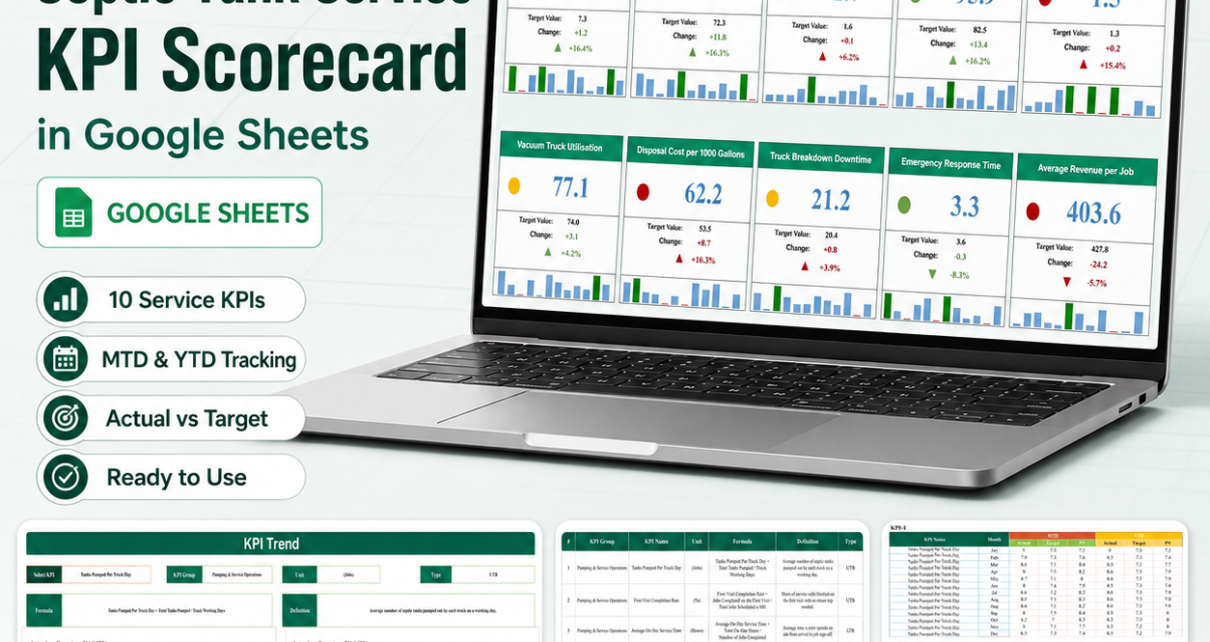
A month-picker scorecard that puts ten septic-service KPIs – pumping throughput, inspections, fleet, disposal cost, emergency response and revenue per job – on one Google Sheets screen with targets, arrows and traffic lights. Full walkthrough of all four pages, the December sample numbers, the known June/July month-label issue and its thirty-second fix.
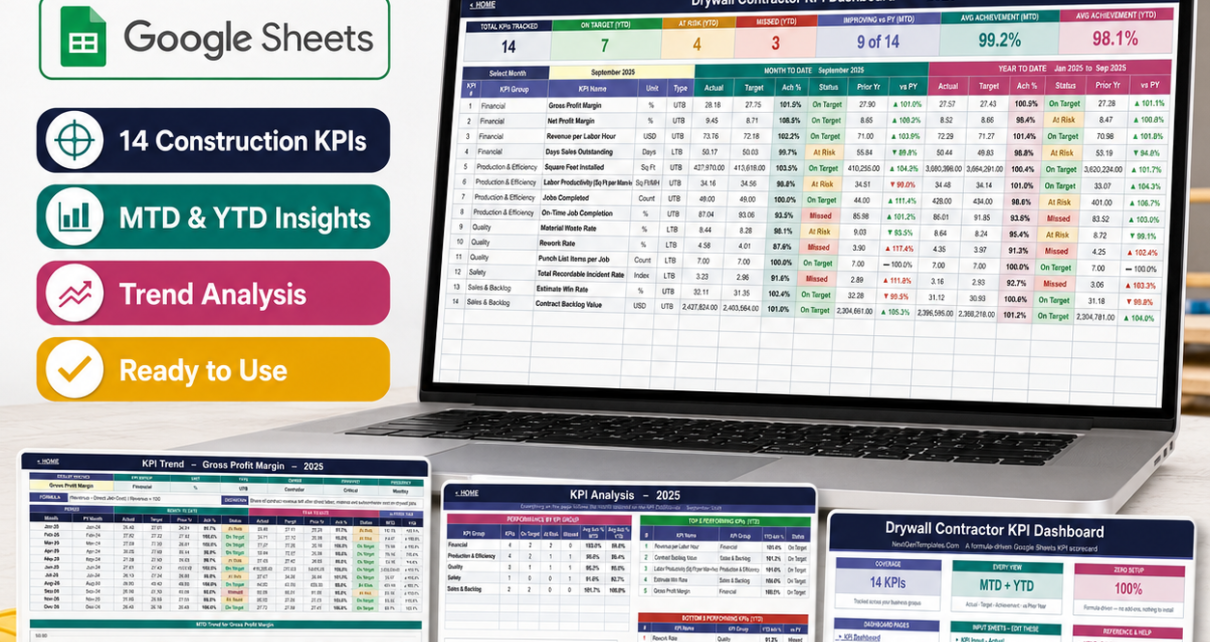
Track 14 drywall contractor KPIs in Google Sheets with MTD and YTD achievement, prior-year comparison, traffic-light status and a single month dropdown.
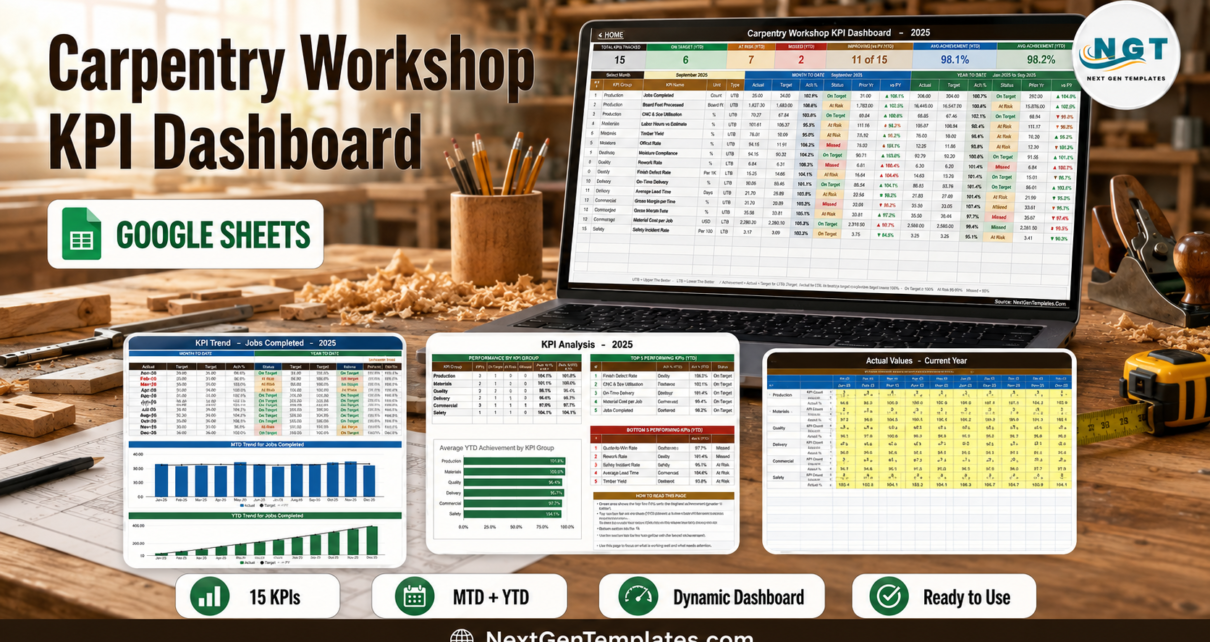
Track 15 carpentry KPIs in Google Sheets across Production, Materials, Quality, Delivery, Commercial and Safety – MTD and YTD, traffic lights, a month picker, a KPI Trend page and a KPI Analysis page, all worksheet formulas.
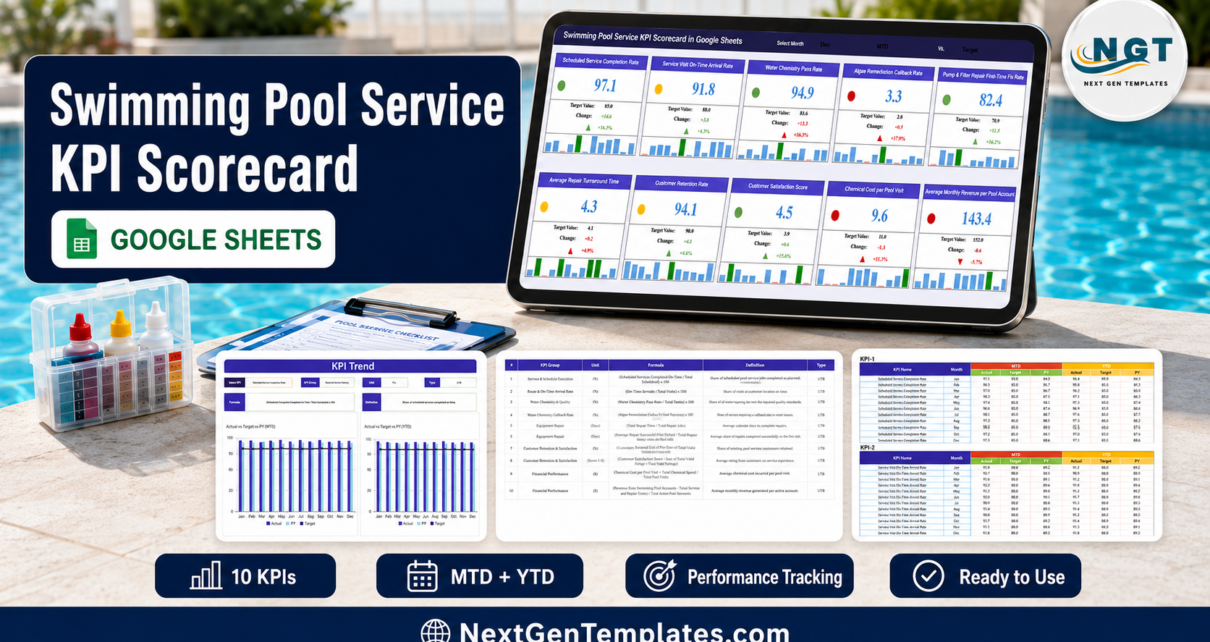
Track ten pool service KPIs on one screen in Google Sheets – month picker, red/amber/green traffic lights, MTD and YTD against target and prior year, a KPI trend page and written formulas for every metric.
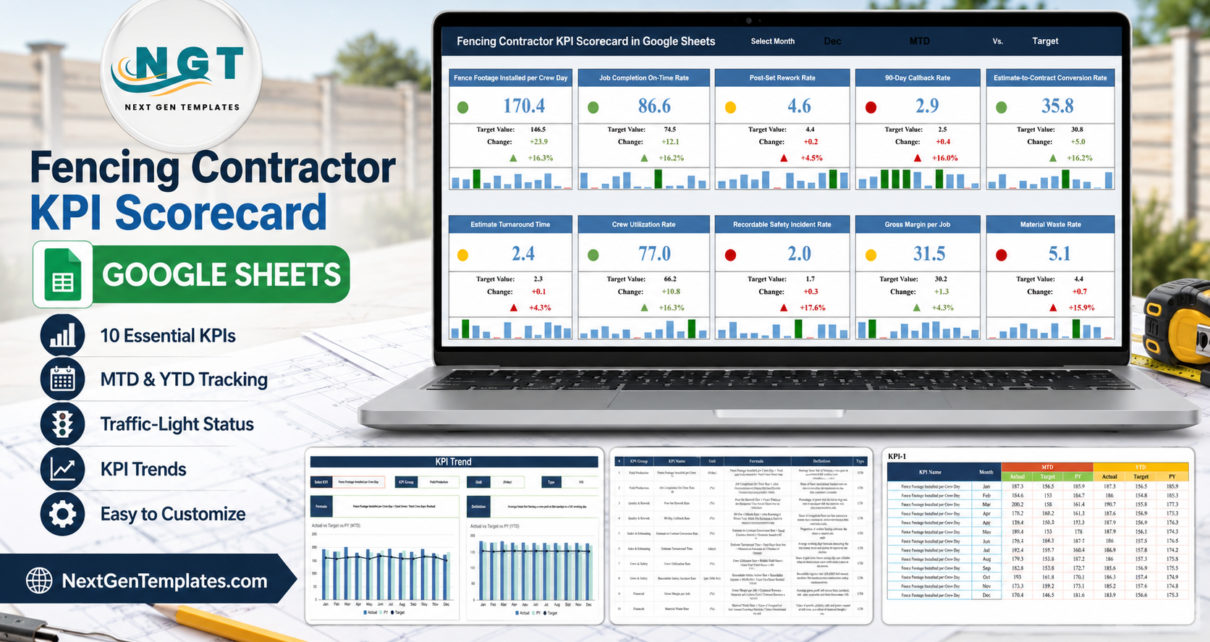
Ten fencing KPIs on one Google Sheets page – month picker, MTD/YTD switch, direction-aware traffic lights, 12-month sparklines and a KPI trend page. A tab-by-tab walkthrough of what the scorecard does, what it does not do, and how it differs from the Excel edition.
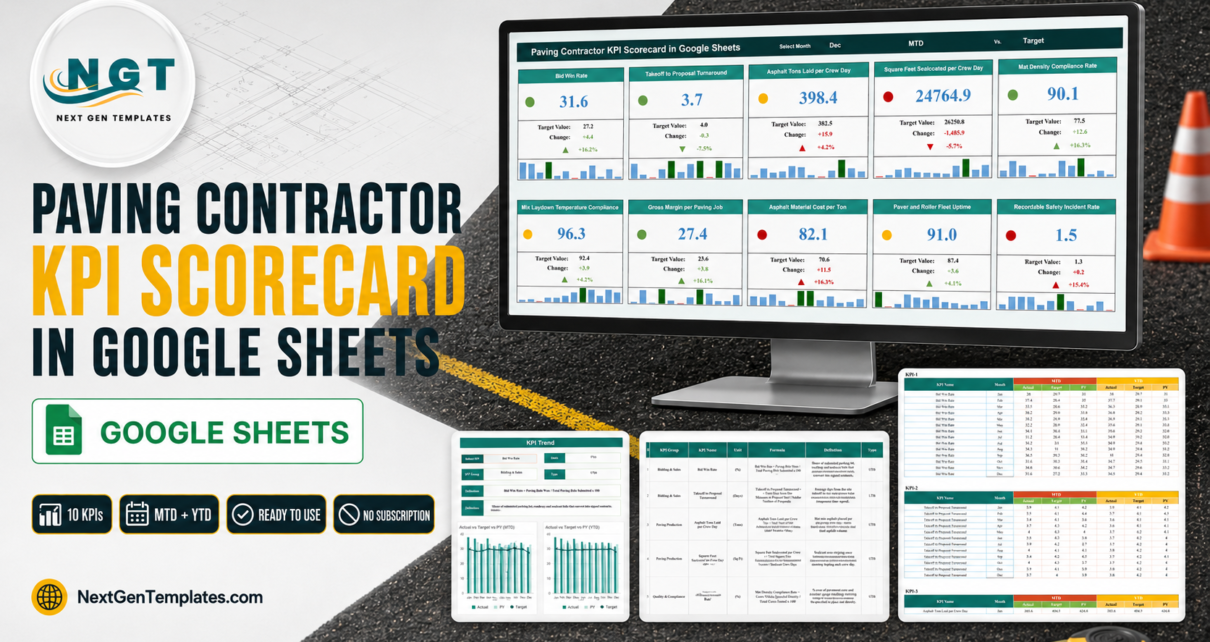
Track ten paving contractor KPIs on one screen in Google Sheets – month picker, MTD/YTD against target or prior year, red/amber/green traffic lights, a KPI trend page and a written formula for every metric.
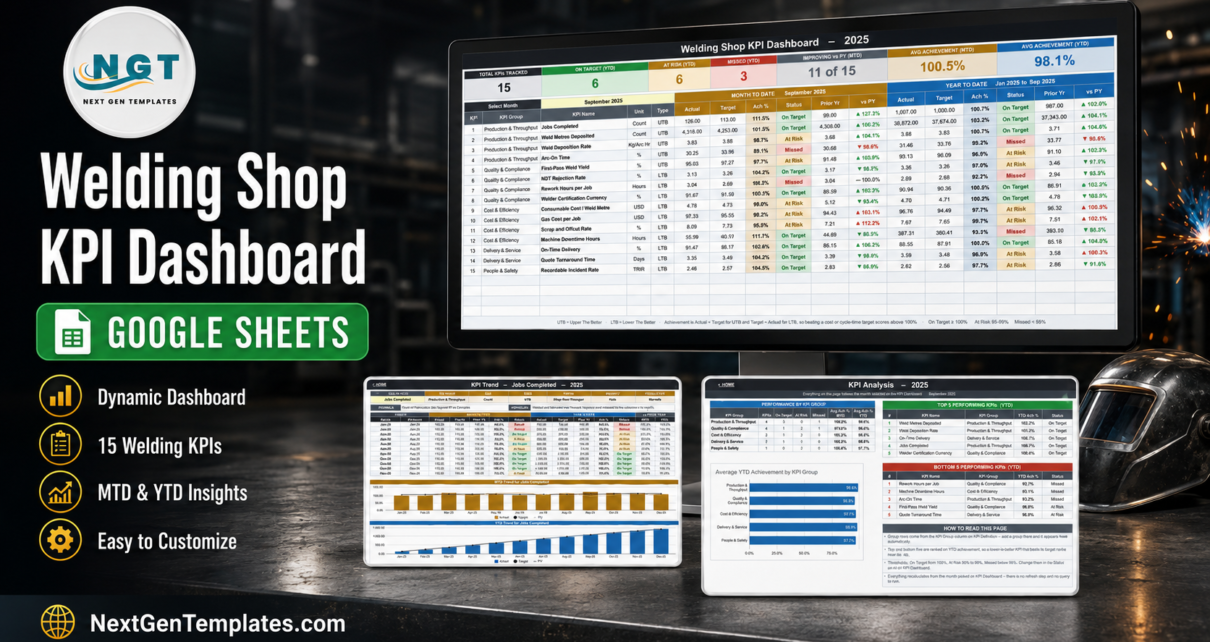
The Welding Shop KPI Dashboard in Google Sheets tracks 15 fabrication KPIs across 5 groups with MTD and YTD achievement, editable traffic lights, a month picker, a KPI Trend page and a KPI Analysis page – all plain worksheet formulas, no add-ons.