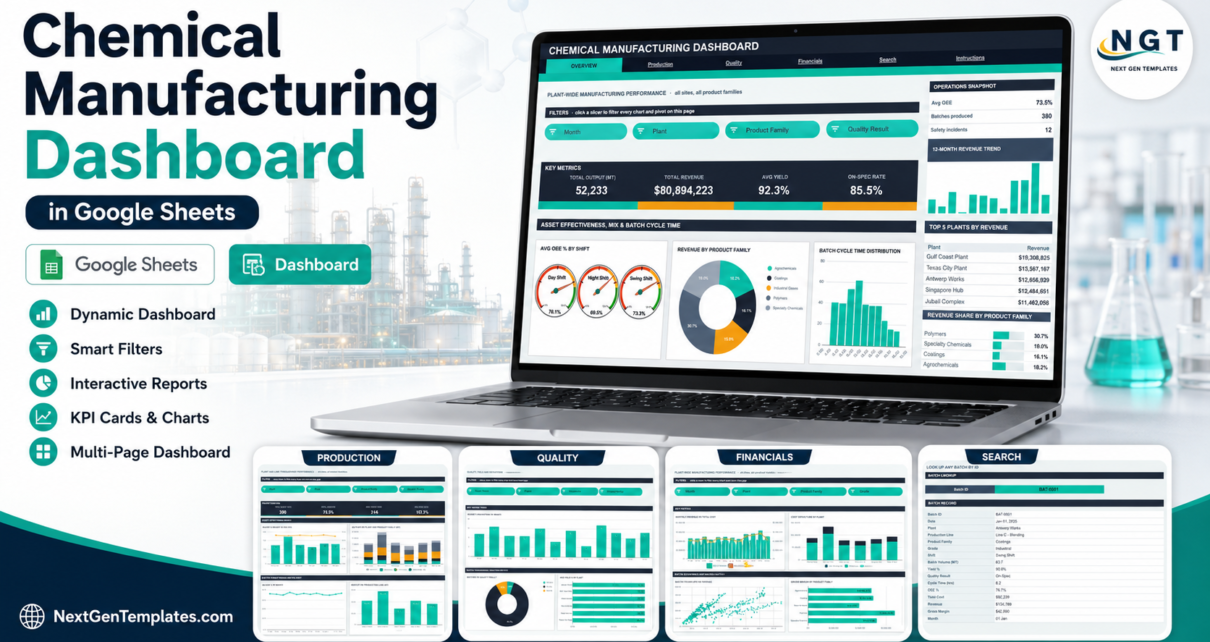
A production-reporting dashboard for chemical plants built entirely in Google Sheets: 6 tabs, 16 KPI cards, 18 native charts and 15 slicers over a 380-batch demo dataset covering output, yield, OEE, cost and margin.
Online Tutorial for Data Analysis and Automation
Google-Sheets-Dashboard
A production-reporting dashboard for chemical plants built entirely in Google Sheets: 6 tabs, 16 KPI cards, 18 native charts and 15 slicers over a 380-batch demo dataset covering output, yield, OEE, cost and margin.
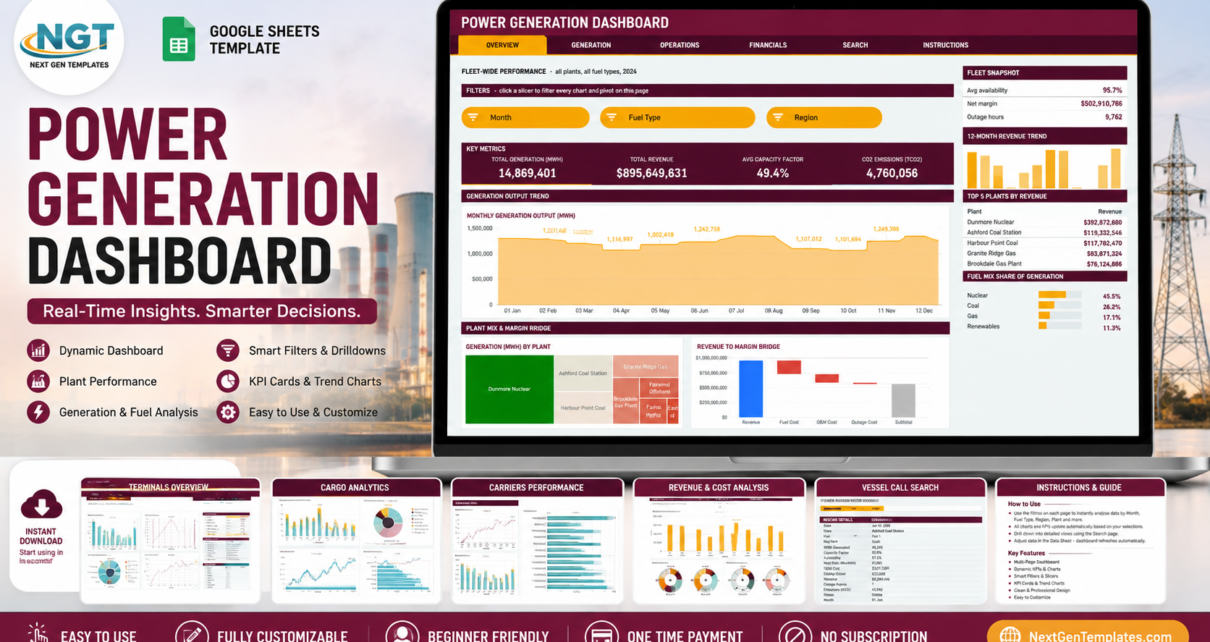
A six-page Power Generation Dashboard in Google Sheets built on native pivot tables and slicers – 16 KPI cards, 18 charts and a record lookup covering MWh, capacity factor, availability, outage hours, revenue and margin across your generation fleet.
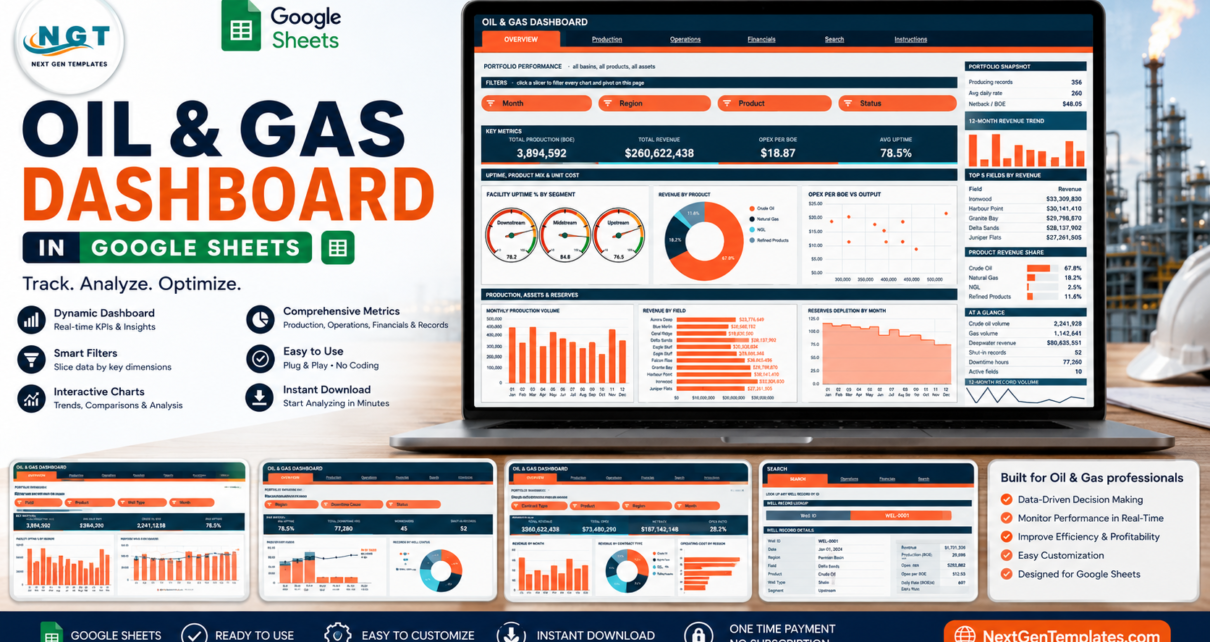
A walkthrough of the Oil & Gas Dashboard in Google Sheets – 6 tabs, 16 KPI cards, 18 pivot-driven charts and 15 native slicers for production, uptime, operating cost and netback reporting, with 500 rows of labelled demo data to start from.
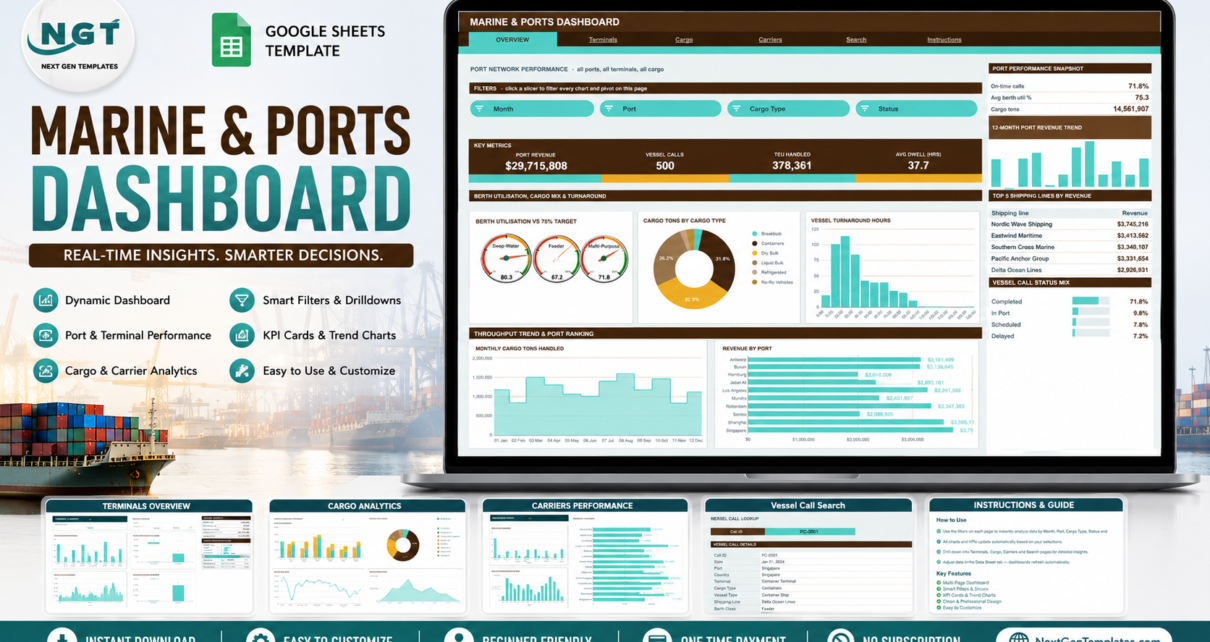
The Marine & Ports Dashboard in Google Sheets reports vessel calls, cargo tonnage, TEU, berth utilisation and shipping line revenue across 6 tabs, 16 KPI cards, 18 pivot-driven charts and 15 slicers – a one-time-purchase reporting layer over your own vessel call log.
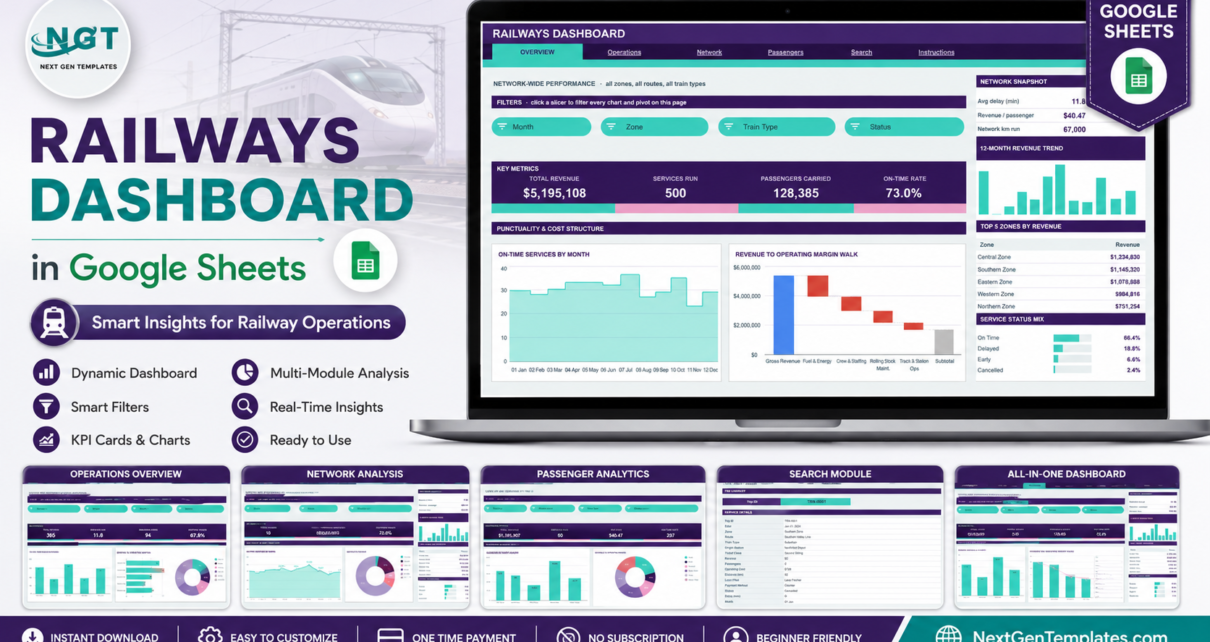
A pivot-and-slicer Railways Dashboard in Google Sheets with 6 tabs, 16 KPI cards, 19 charts and gauges and 15 slicers – covering punctuality, route revenue, operating margin and passenger demand from your own service log.
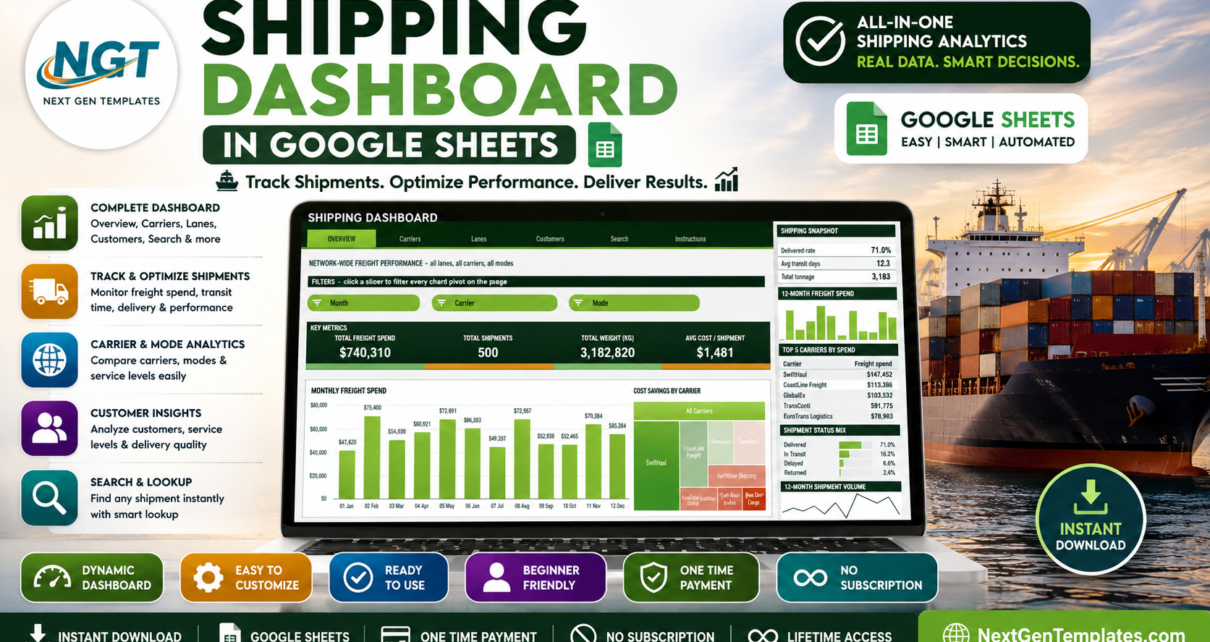
A five-page Shipping Dashboard in Google Sheets built on native pivot tables and slicers – freight spend, carrier mix, trade lanes, customer delivery quality and a shipment-ID lookup, with 500 sample shipments loaded and room for 1,000 rows.
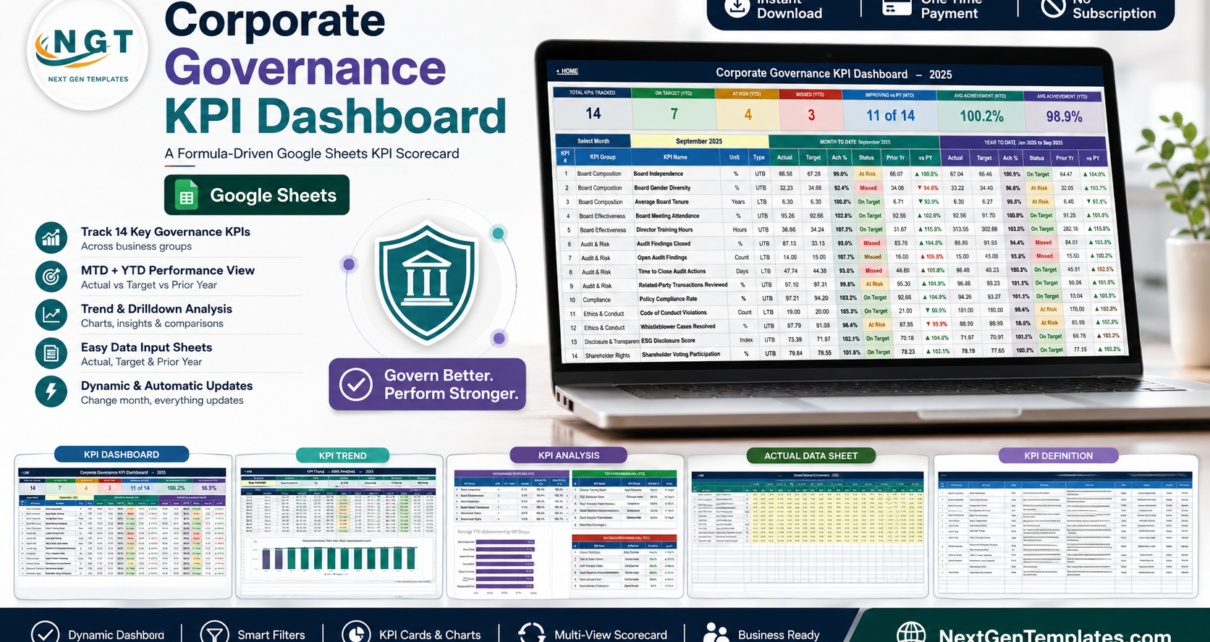
Track 14 corporate governance KPIs across board composition, board effectiveness, audit and risk, compliance, ethics, disclosure and shareholder rights in one formula-driven Google Sheets scorecard. Pick a month and MTD plus YTD achievement, traffic lights and prior-year comparisons update instantly. No add-ons, no scripts. A reporting template only, not legal or governance advice.
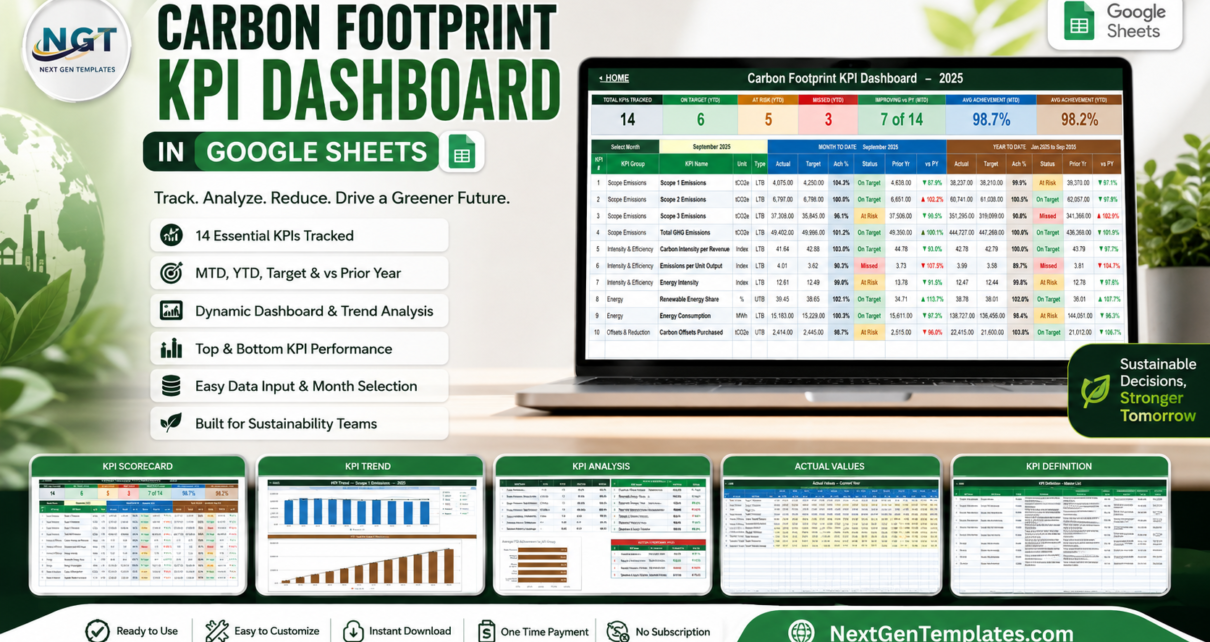
A formula-driven carbon footprint KPI dashboard in Google Sheets: 14 emissions KPIs, 12 months, MTD and YTD with traffic lights and prior-year comparison, all driven by one month dropdown. No add-ons, no scripts.
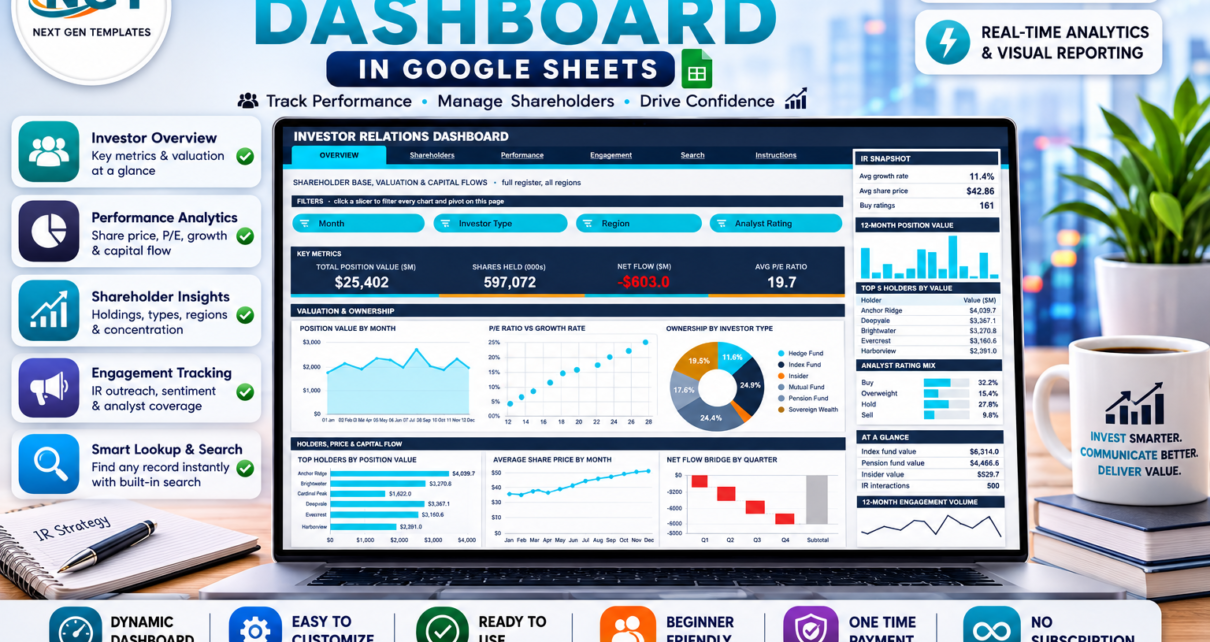
A six-page Investor Relations Dashboard in Google Sheets built on native pivot tables and 15 slicers. Track your shareholder register, share price, capital flows and IR meetings in one file – a reporting tool only, with demo data you replace with your own.
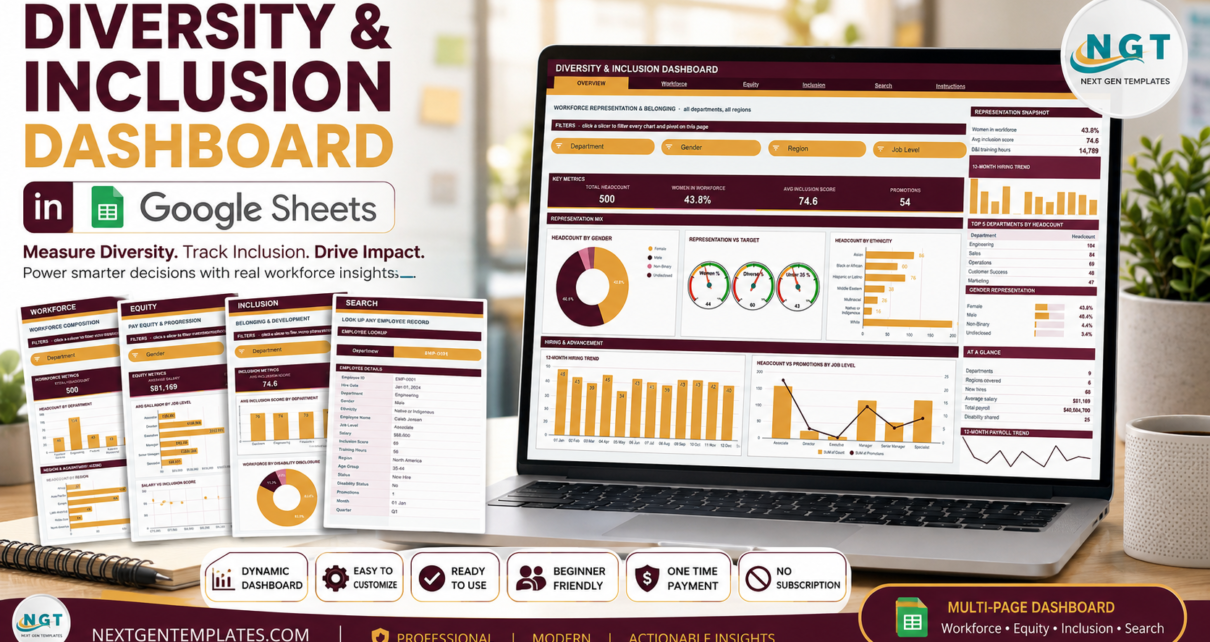
A six-tab Google Sheets workbook that charts workforce representation, pay and inclusion-survey scores from 500 sample employee records using native pivot tables and 16 slicers. A reporting tool only – it charts what you enter and gives no HR or legal advice.