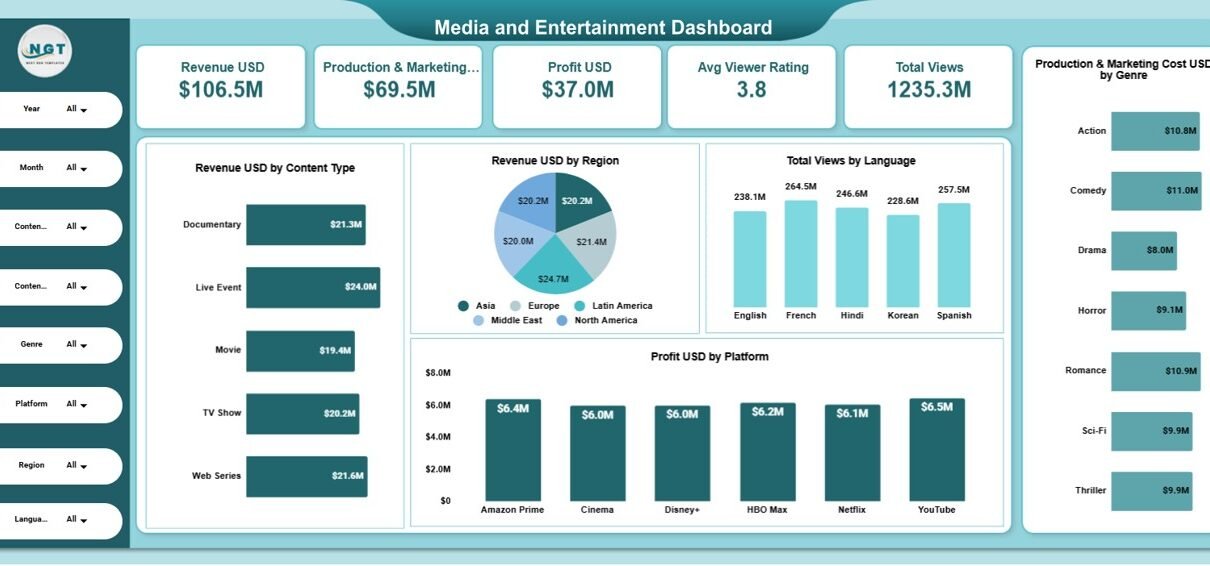
The media and entertainment industry moves fast. Content launches every week. Platforms compete daily. Audience preferences change quickly. Meanwhile, production and marketing costs keep rising.Media and Entertainment Dashboard in Google Sheets So, how can studios, OTT platforms, content creators, and media companies track revenue, profit, views, ratings, and regional performance in one structured system? Media […]
Google Sheets
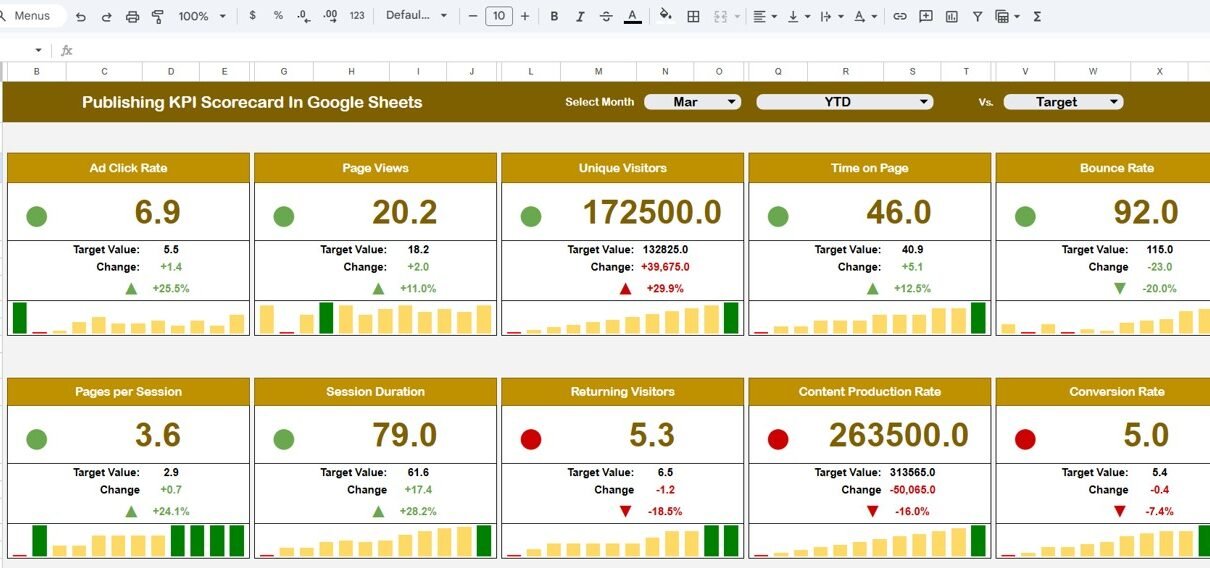
Publishing KPI Scorecard In Google Sheets
The publishing industry moves fast. Deadlines tighten. Content volume increases. Revenue targets grow every quarter. Meanwhile, editorial teams, marketing teams, and sales teams must align perfectly. However, many publishing businesses still rely on scattered spreadsheets and manual reports. As a result, leaders struggle to measure real performance. So, how can you track circulation, digital reach, […]
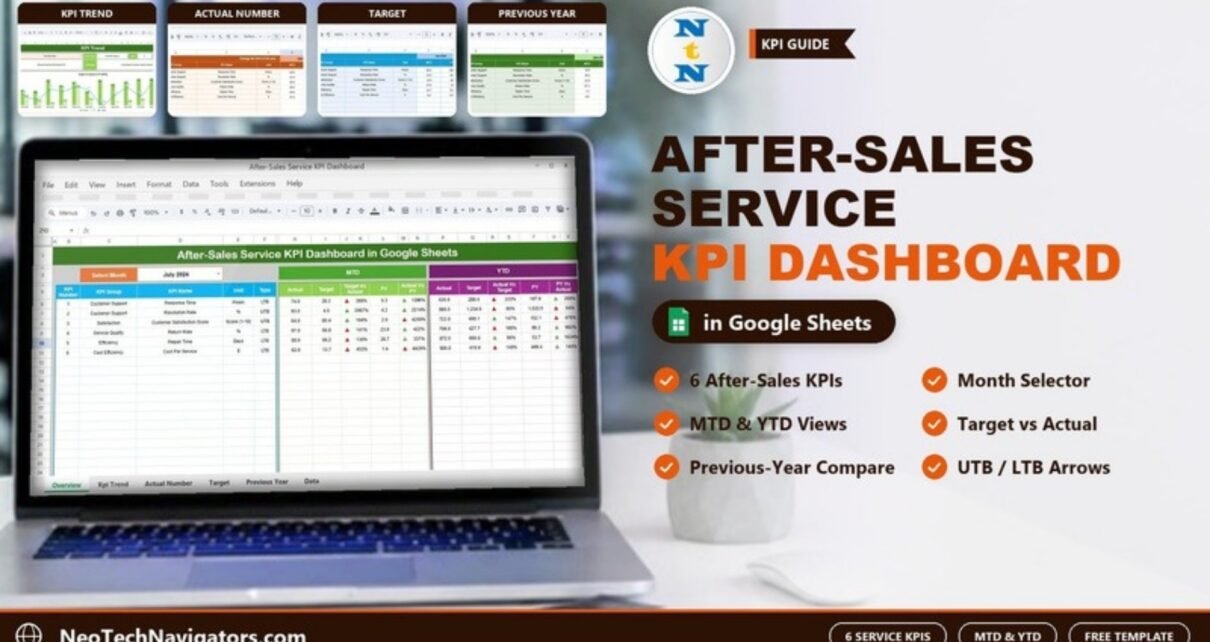
After-Sales Service KPI Dashboard in Google Sheets
Track six after-sales KPIs (response time, resolution rate, satisfaction, return rate, repair time and cost per service) with MTD, YTD, target and previous-year comparisons in Google Sheets. Includes a sheet-by-sheet guide and worked example.
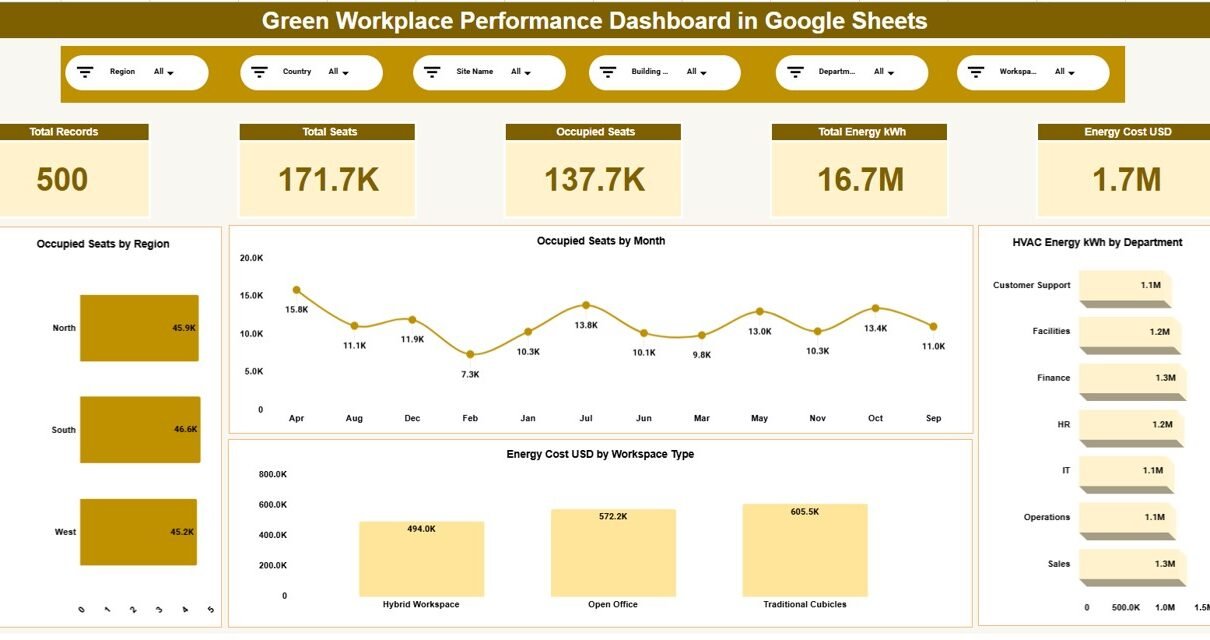
Green Workplace Performance Dashboard in Google Sheets
Sustainability is no longer optional. Organizations must reduce energy usage, control water consumption, and manage waste effectively. However, many companies still track environmental performance using disconnected reports. As a result, leaders struggle to monitor sustainability metrics clearly. Therefore, you need a centralized and structured system.Green Workplace Performance Dashboard in Google Sheets The Green Workplace Performance […]
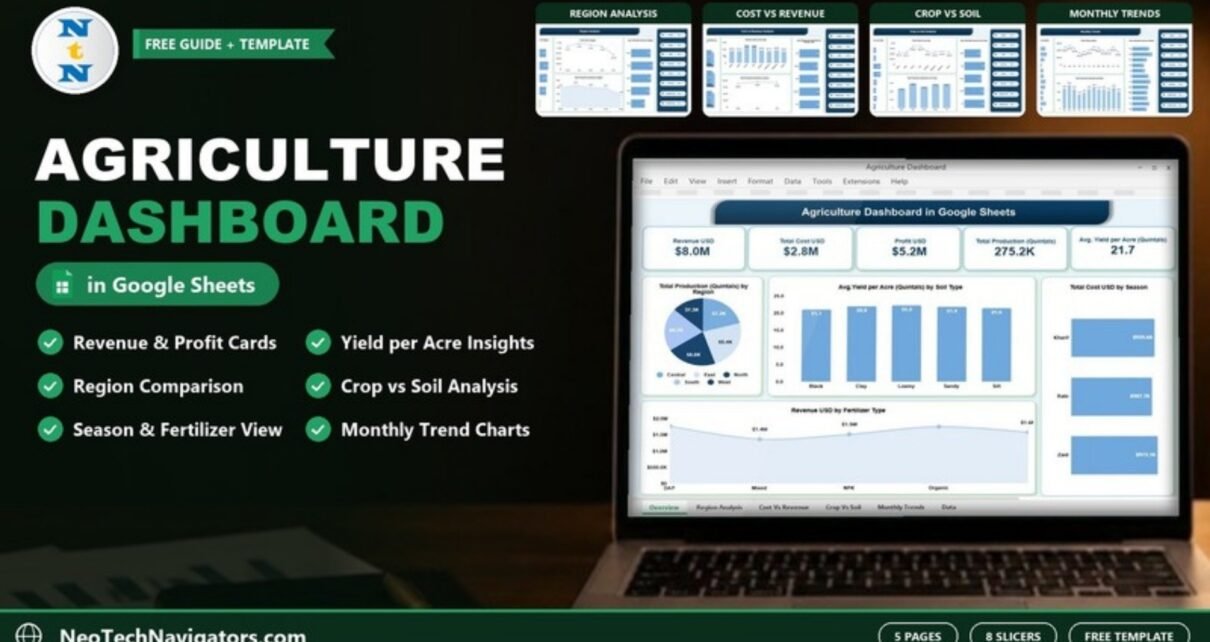
Agriculture Dashboard in Google Sheets
A five-page Agriculture Dashboard in Google Sheets that shows farm revenue, cost, profit, production and yield per acre by region, crop, soil, fertilizer, season and month, with eight slicers and a worked example.
Fashion KPI Scorecard in Google Sheets
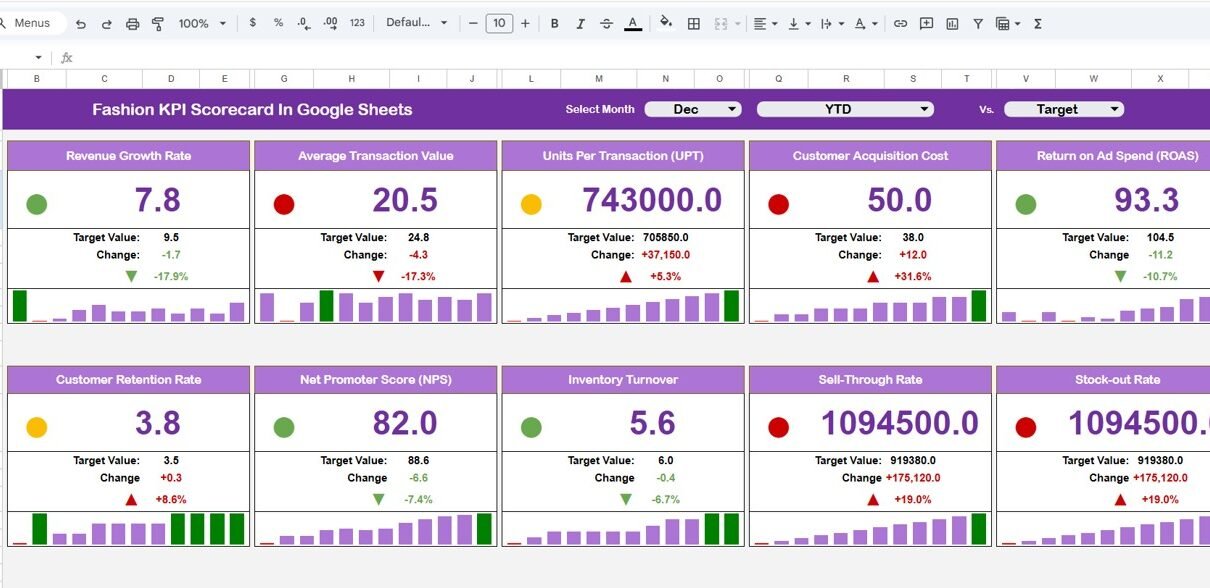
The fashion industry moves fast. Trends change every season. Moreover, customer demand shifts quickly. Therefore, fashion brands must track sales, margins, inventory, and customer performance in real time.Fashion KPI Scorecard in Google Sheets However, many fashion businesses still depend on scattered Excel sheets. As a result, managers struggle to compare monthly performance, track targets, and […]
Field Service KPI Dashboard in Google Sheets
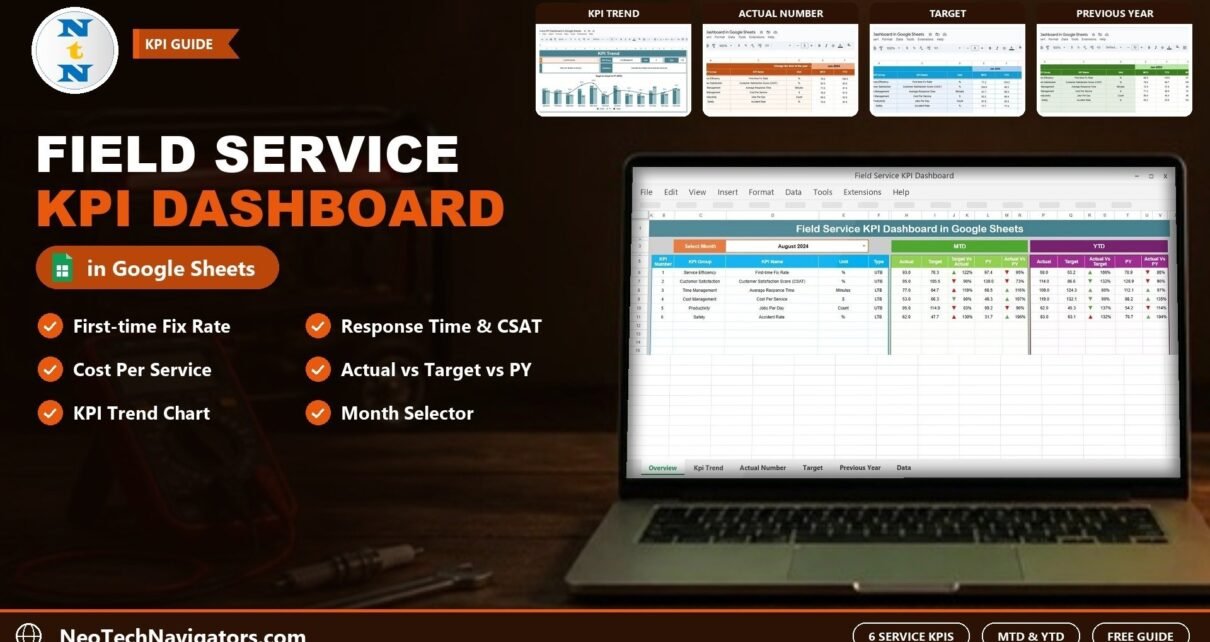
A Google Sheets KPI dashboard for field service teams that tracks First-time Fix Rate, CSAT, Average Response Time, Cost Per Service, Jobs Per Day and Accident Rate with MTD/YTD Actual vs Target vs Previous Year.
Mining KPI Scorecard in Google Sheets
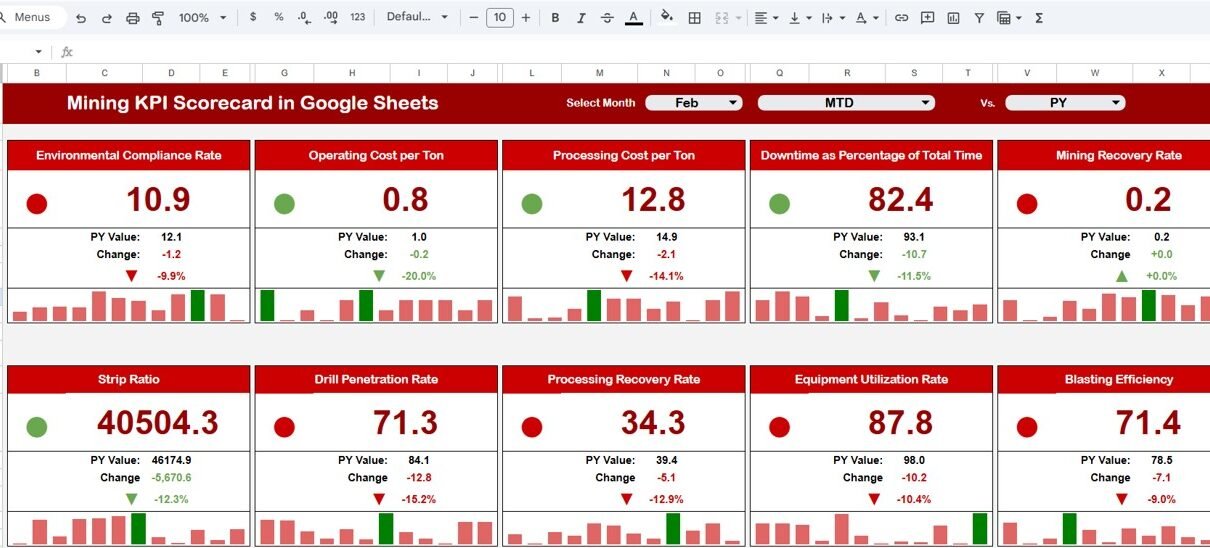
The mining industry runs on precision, safety, and performance control. Every day, companies extract materials worth millions. However, even small inefficiencies can reduce profit margins significantly. Therefore, mining companies must track production, safety, cost, and operational KPIs carefully. Yet, many mining operations still depend on scattered spreadsheets. As a result, management struggles to monitor performance […]
Returns Management KPI Dashboard in Google Sheets
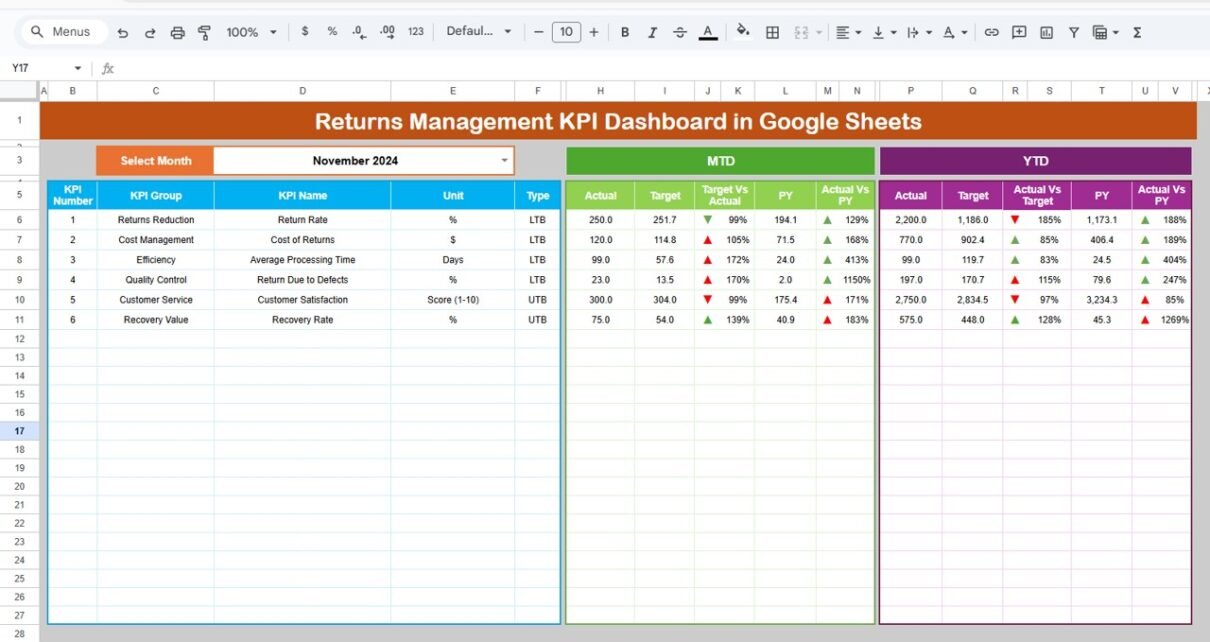
Managing returns is no longer just an operational task. Instead, it plays a direct role in customer satisfaction, cost control, and profitability. Companies handle product returns daily. However, many businesses still track return data in scattered spreadsheets. As a result, managers struggle to monitor return rates, processing time, and financial impact.Returns Management KPI Dashboard in […]
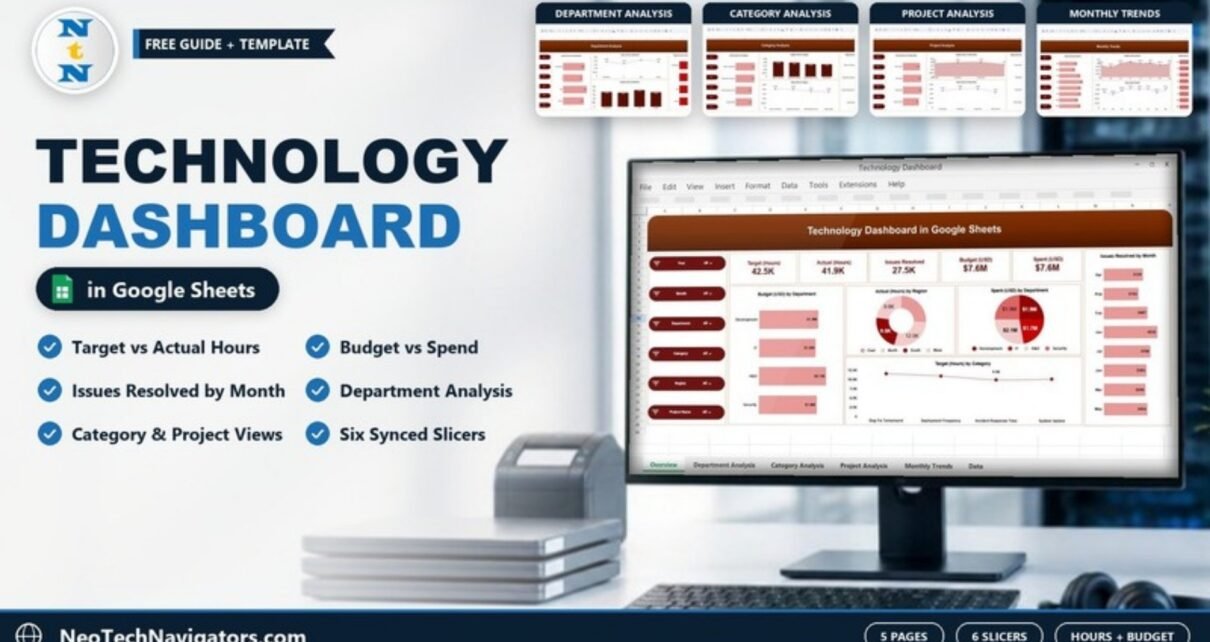
Technology Dashboard in Google Sheets
A five-page Technology Dashboard in Google Sheets that tracks target vs actual hours, issues resolved, budget and spend by department, category, project and month.