Mining operations involve high-risk activities. Therefore, safety monitoring is not optional—it is critical. However, many mining organizations still track safety KPIs using manual registers, static spreadsheets, or delayed reports. As a result, risks increase, compliance gaps appear, and corrective actions get delayed. That is exactly where a Mining Safety KPI Dashboard in Google Sheets becomes […]
Tag: Google Sheets Dashboard
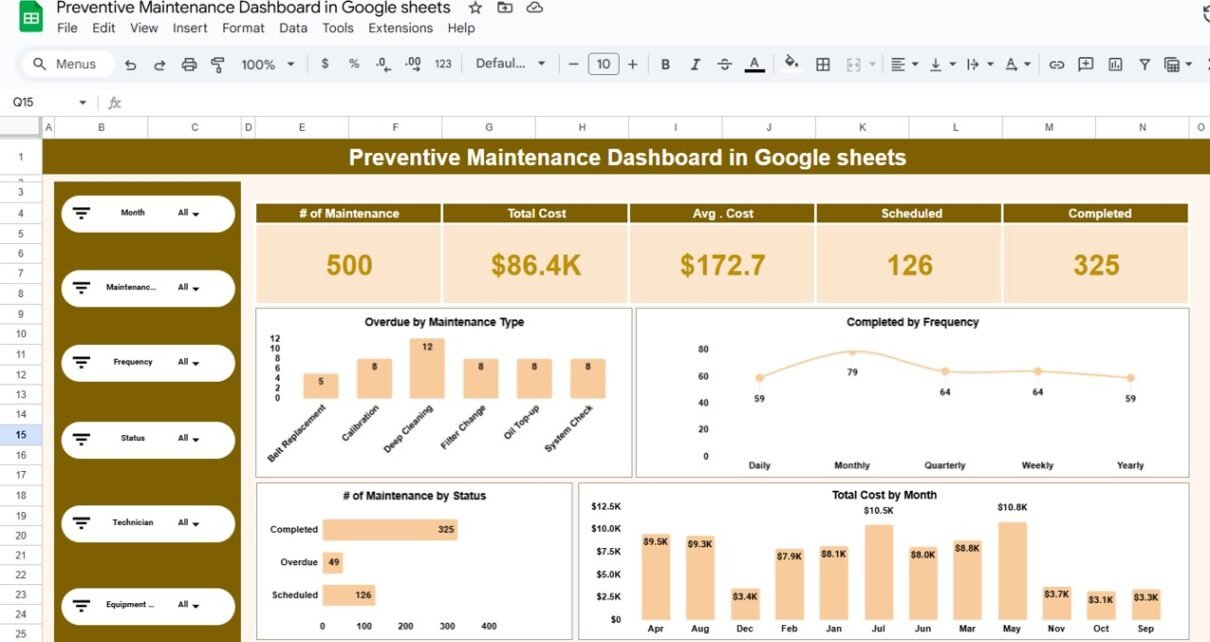
Preventive Maintenance Dashboard in Google Sheets
Preventive maintenance plays a critical role in reducing equipment breakdowns, controlling maintenance costs, and improving asset life. However, many organizations still track maintenance activities using manual logs, scattered spreadsheets, or static reports. As a result, overdue tasks increase, costs rise unexpectedly, and decision-making becomes reactive. That is exactly where a Preventive Maintenance Dashboard in Google […]
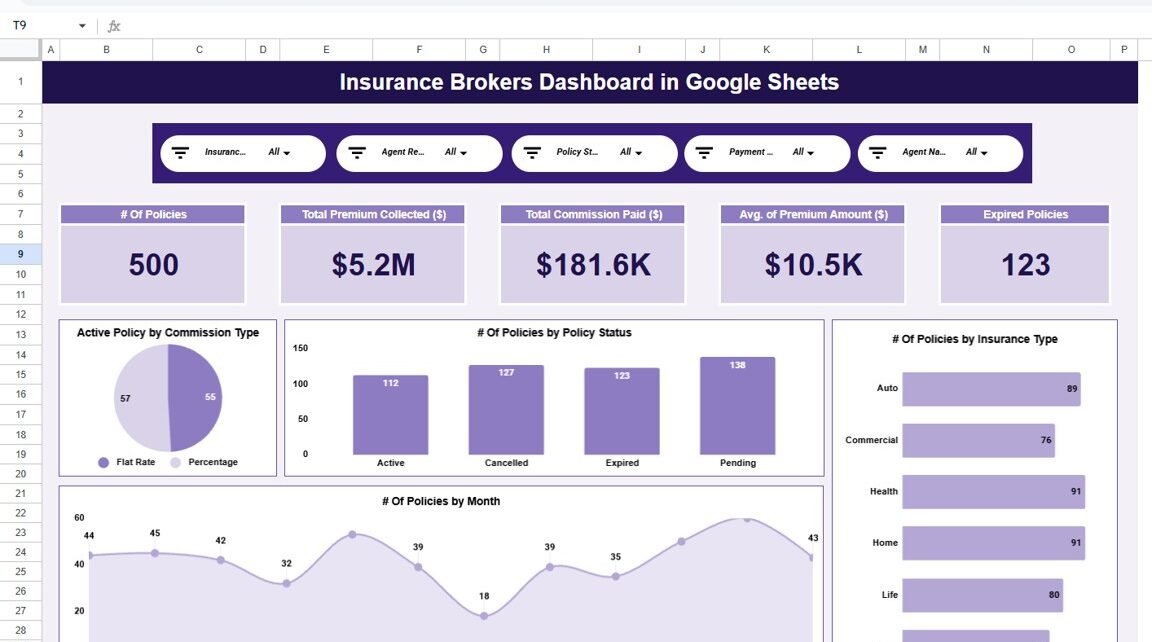
Insurance Brokers Dashboard in Google Sheets
Insurance brokers handle large volumes of policies, agents, commissions, and payments every single month. However, many brokers still depend on raw spreadsheets, manual summaries, and delayed reports. As a result, tracking performance becomes slow, error-prone, and reactive. That is exactly where an Insurance Brokers Dashboard in Google Sheets creates real value. Get the Insurance Brokers […]
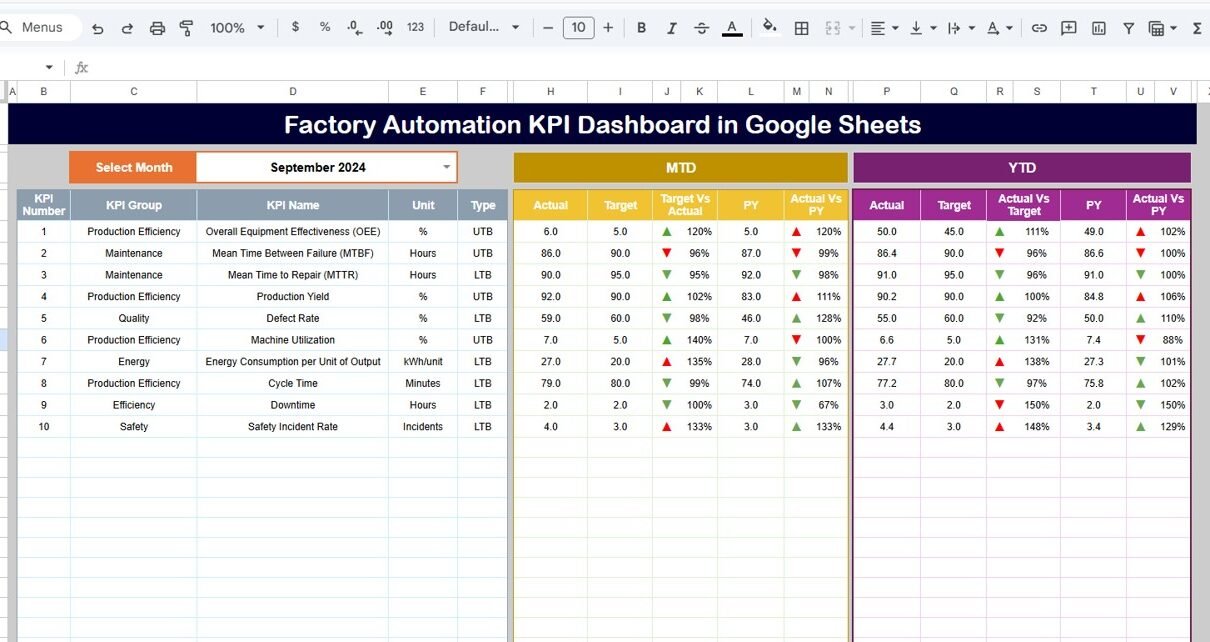
Factory Automation KPI Dashboard in Google Sheets
Factory automation has transformed modern manufacturing. Machines now work faster, systems run smarter, and production lines operate with minimal human intervention. However, automation alone does not guarantee success. Without proper performance tracking, even advanced factories struggle with inefficiencies, rising costs, and missed targets. That is exactly where a Factory Automation KPI Dashboard in Google Sheets […]
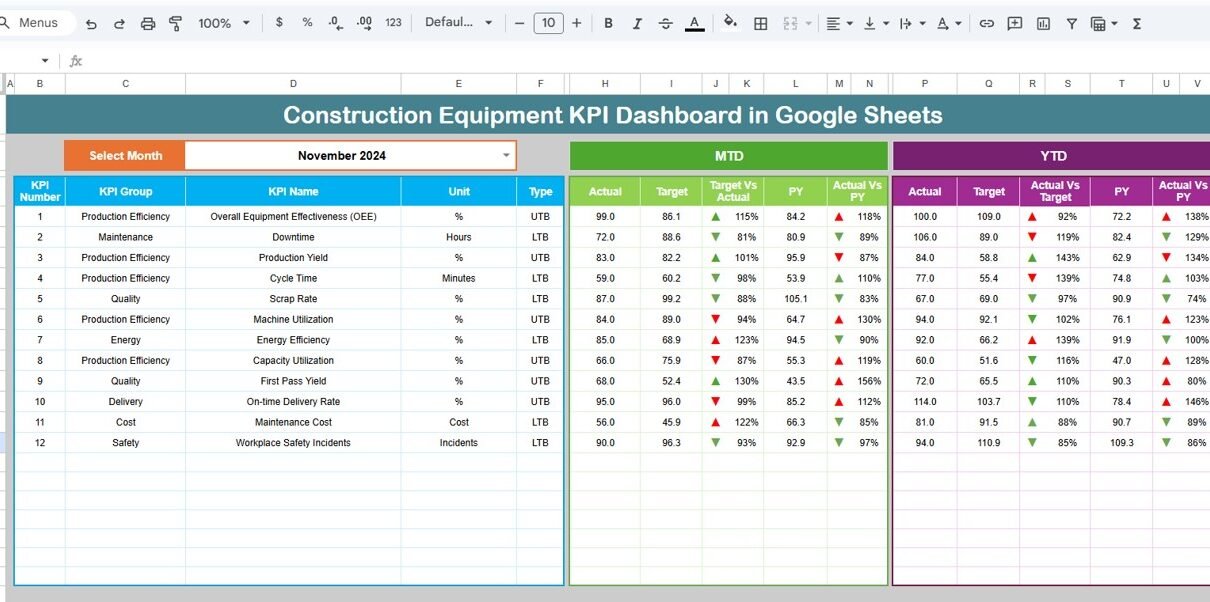
Construction Equipment KPI Dashboard in Google Sheets
Construction projects depend heavily on the availability, utilization, and performance of equipment. However, many construction companies still track equipment data using manual logs, isolated spreadsheets, or delayed MIS reports. As a result, equipment downtime increases, costs rise, and productivity suffers. That is exactly where a Construction Equipment KPI Dashboard in Google Sheets delivers real value. […]
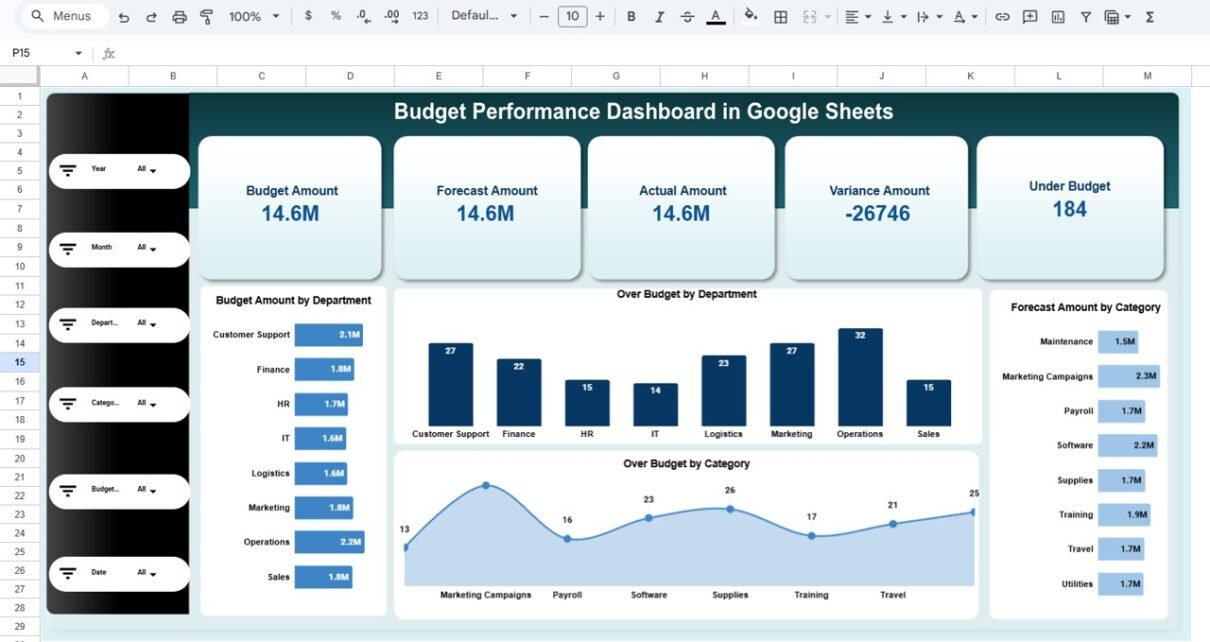
Budget Performance Dashboard in Google Sheets
Budget control plays a critical role in every organization’s financial health. However, many teams still manage budgets using multiple spreadsheets, manual calculations, and static reports. As a result, budget overruns remain unnoticed until it is too late, and decision-making becomes reactive instead of proactive. That is exactly where a Budget Performance Dashboard in Google Sheets […]
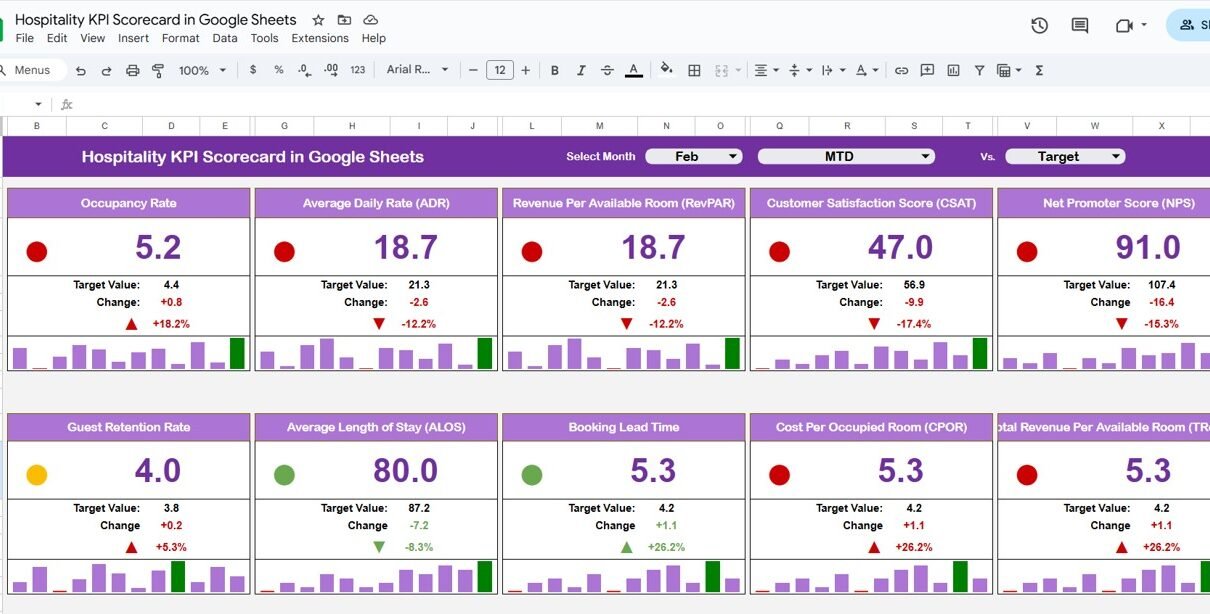
Hospitality KPI Scorecard in Google Sheets
The hospitality industry runs on guest experience, operational efficiency, and consistent performance. However, many hotels, resorts, and hospitality businesses still depend on manual reports and scattered spreadsheets. As a result, performance tracking becomes slow and unclear. That is exactly where a Hospitality KPI Scorecard in Google Sheets adds real value. In this detailed article, you […]
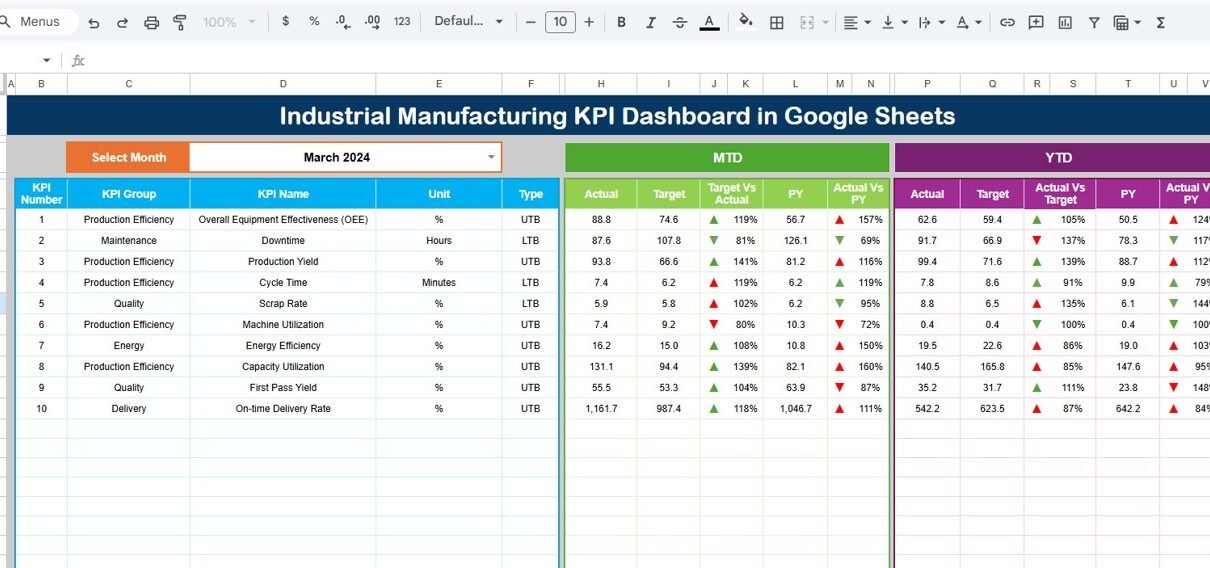
Industrial Manufacturing KPI Dashboard in Google Sheets
Industrial manufacturing organizations operate in a highly competitive and efficiency-driven environment. Production targets, quality standards, costs, safety, and delivery timelines must stay under constant control. However, many manufacturing teams still rely on manual spreadsheets and disconnected reports. As a result, visibility drops and decision-making slows down. That is exactly where an Industrial Manufacturing KPI Dashboard […]
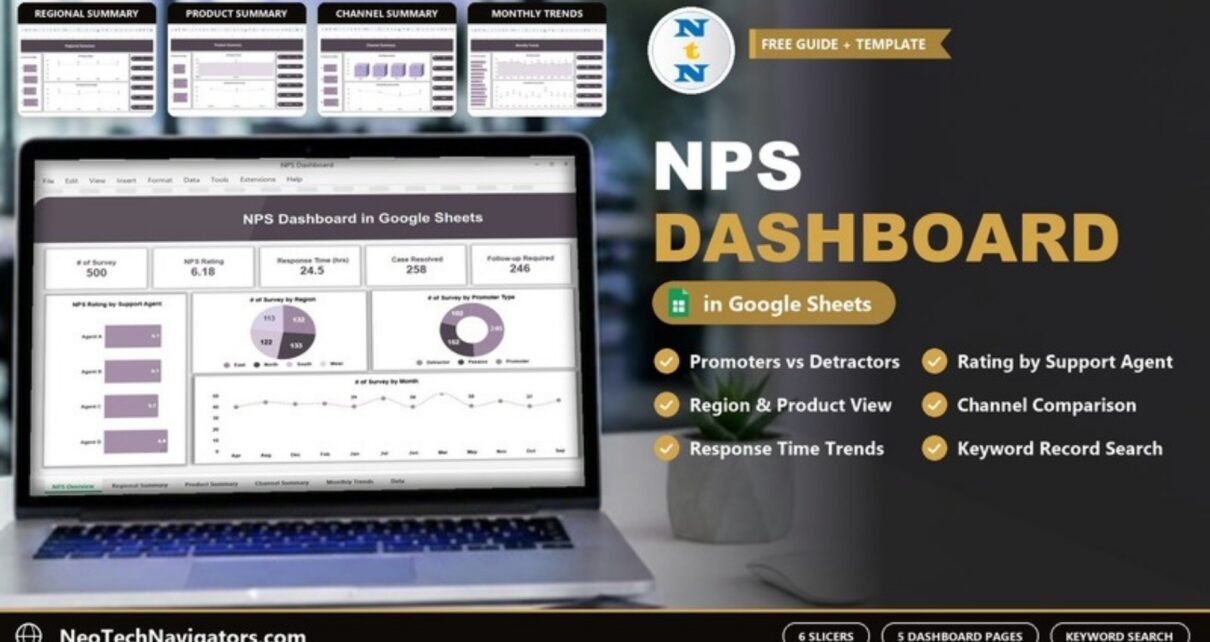
NPS Dashboard in Google Sheets
A page-by-page guide to the NPS Dashboard in Google Sheets: promoters vs detractors, average rating by agent, region, product and channel, response time trends, and how to calculate classic NPS from the data.
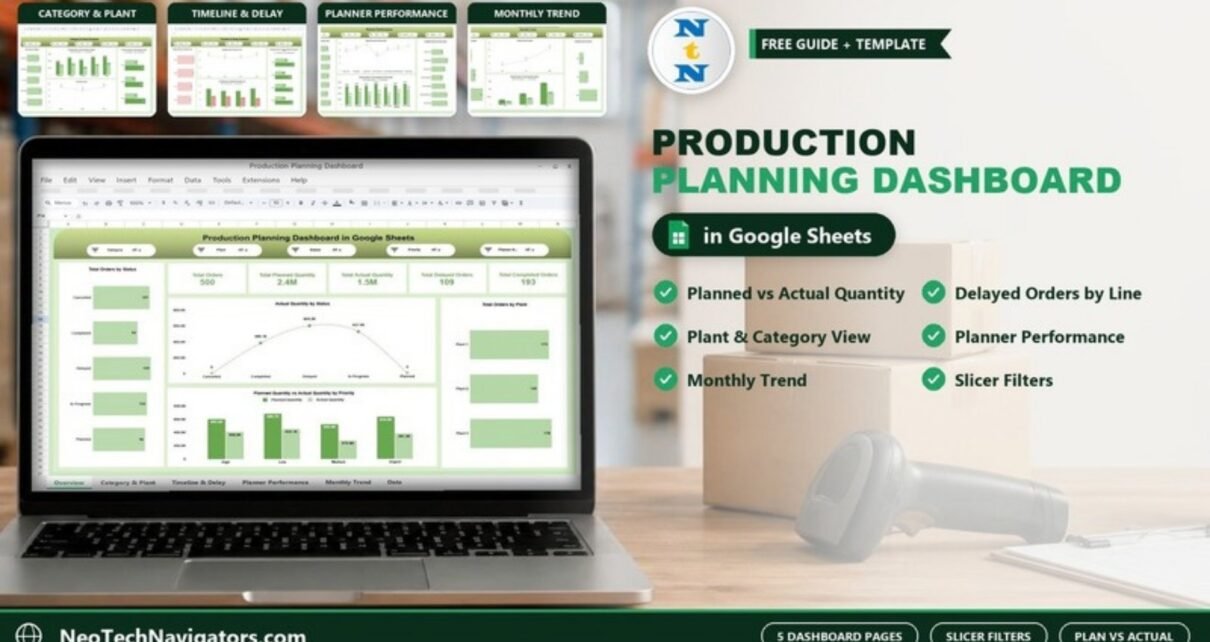
Production Planning Dashboard in Google Sheets
A page-by-page guide to the Production Planning Dashboard in Google Sheets: planned vs actual quantity, delayed orders by line, planner performance and monthly trend, with steps to load your own data.