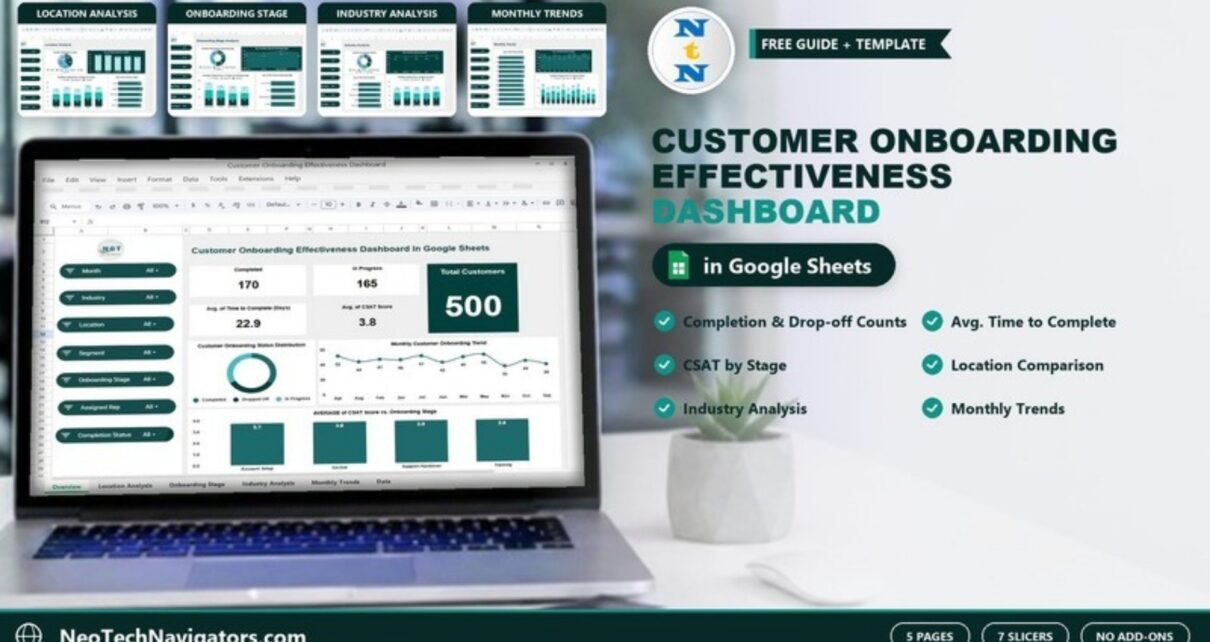
A five-page Google Sheets dashboard that tracks customer onboarding completion, drop-offs, time to complete and CSAT by location, stage, industry and month, with seven slicers for drill-down.
Online Tutorial for Data Analysis and Automation
A five-page Google Sheets dashboard that tracks customer onboarding completion, drop-offs, time to complete and CSAT by location, stage, industry and month, with seven slicers for drill-down.
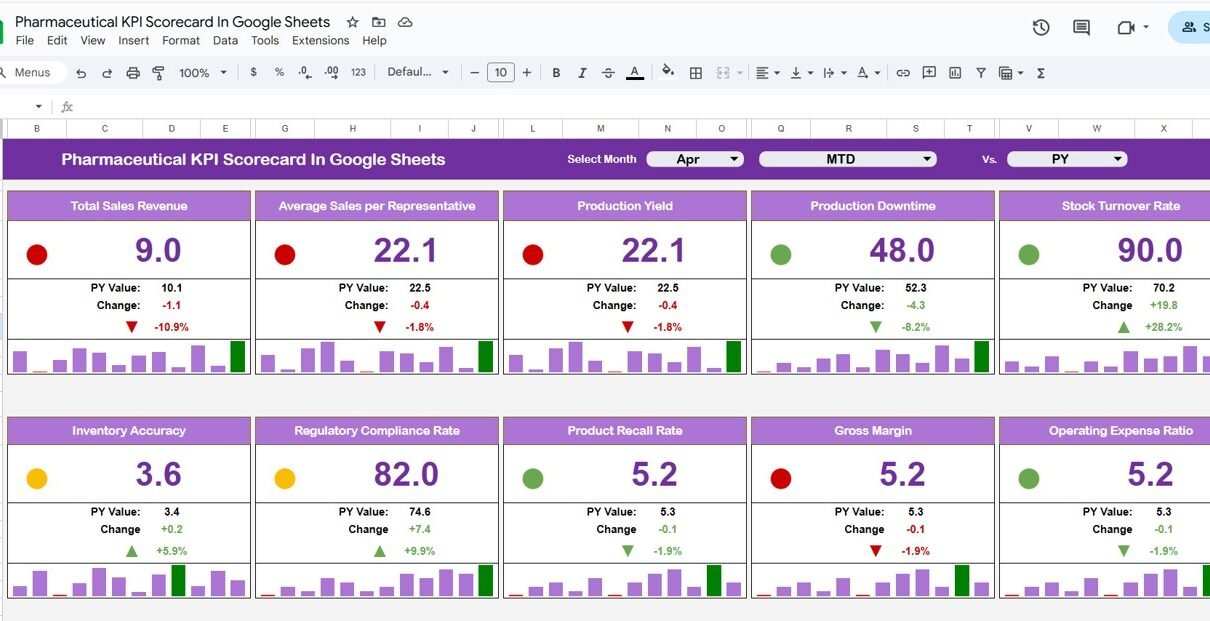
Tracking performance in the pharmaceutical industry requires precision, compliance, and speed. However, when KPIs stay scattered across reports and spreadsheets, performance monitoring becomes slow and unclear. That is exactly why the Pharmaceutical KPI Scorecard in Google Sheets becomes a powerful, ready-to-use solution. This Pharmaceutical KPI Scorecard in Google Sheets is designed as a monthly and […]
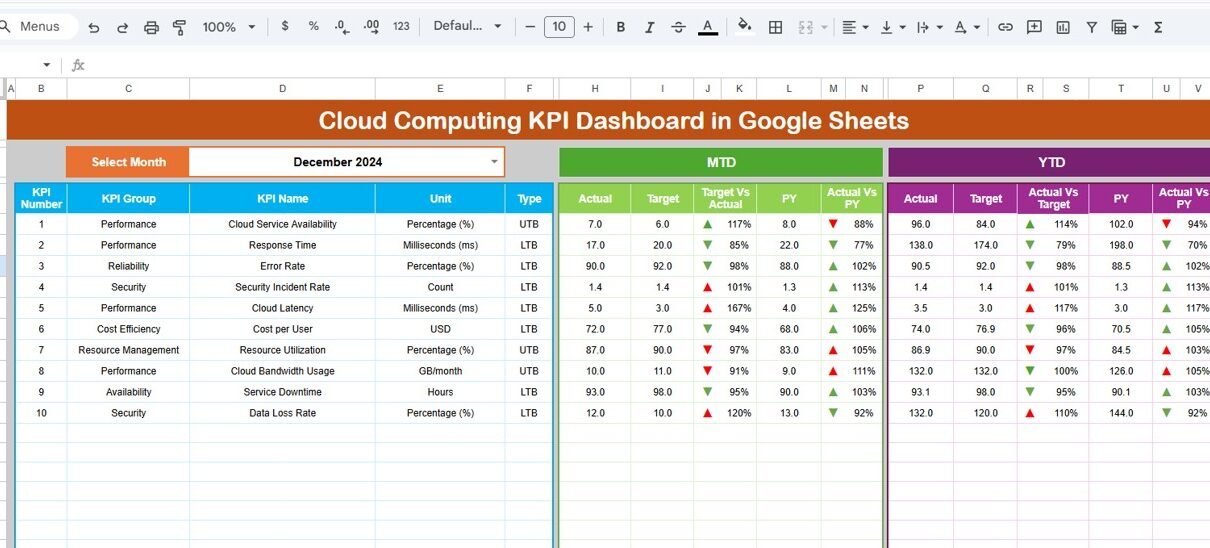
Cloud infrastructure powers modern digital businesses. However, without continuous monitoring, cloud costs, performance, and availability can quickly go out of control. That is exactly why a Cloud Computing KPI Dashboard in Google Sheets becomes essential. This ready-to-use Cloud Computing KPI Dashboard in Google Sheets helps organizations track operational, financial, performance, and reliability KPIs in one […]

Managing employee performance and reducing attrition are two of the biggest challenges for modern organizations. When employee data stays scattered across spreadsheets, HR systems, and reports, leaders struggle to identify trends and take timely action. That is exactly where the Employee Performance and Attrition Dashboard in Google Sheets becomes a powerful, ready-to-use solution. In this […]
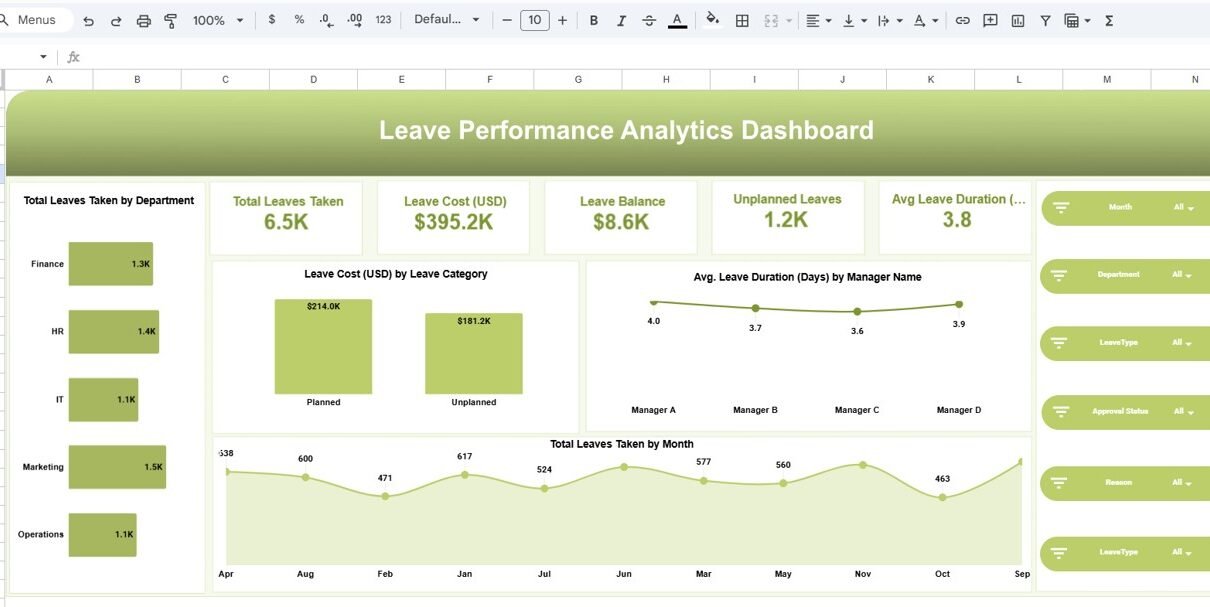
Managing employee leave efficiently plays a critical role in workforce productivity, cost control, and employee satisfaction. However, when leave data remains scattered across registers or raw spreadsheets, decision-making becomes slow and reactive. That is exactly why the Leave Performance Analytics Dashboard in Google Sheets becomes an essential solution. Get the Leave Performance Analytics Dashboard in […]

The media and entertainment industry runs on performance. Whether organizations manage television networks, OTT platforms, film production, digital content, or advertising revenue, they must track key metrics continuously. However, when teams rely on manual reports or disconnected spreadsheets, performance visibility reduces and decision-making slows down. That is exactly why a Media & Entertainment KPI Scorecard […]
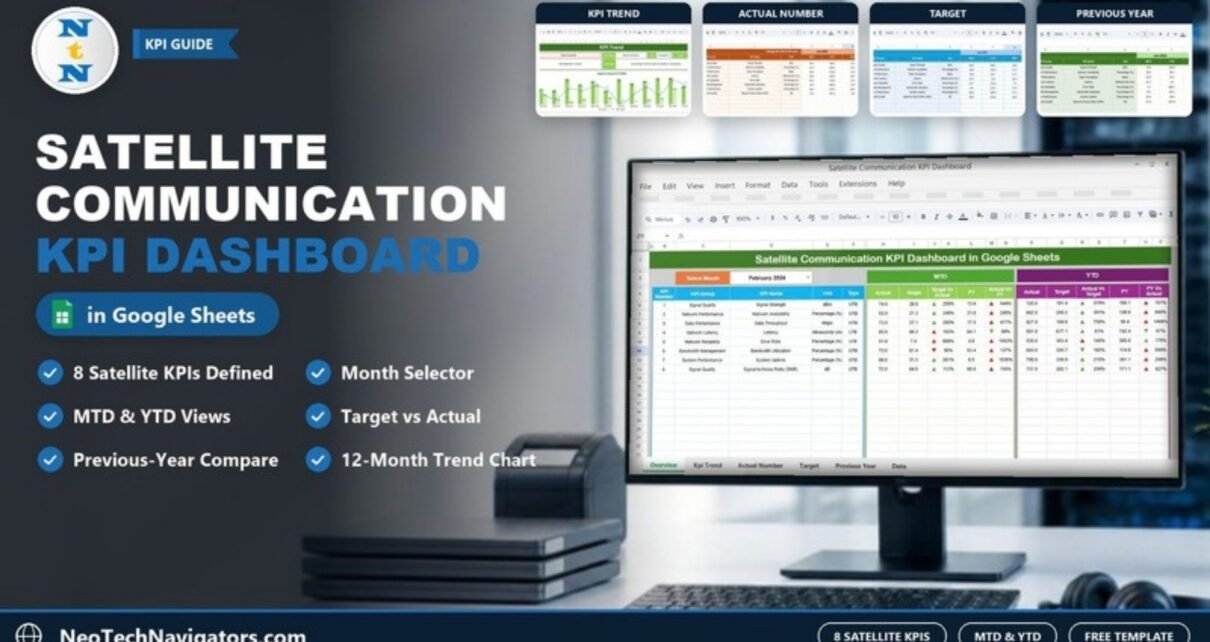
Track eight satellite KPIs, including Signal Strength, Latency, Error Rate and System Uptime, with MTD, YTD, target and previous-year comparisons in one Google Sheets dashboard. This guide covers all six sheets and a worked example.
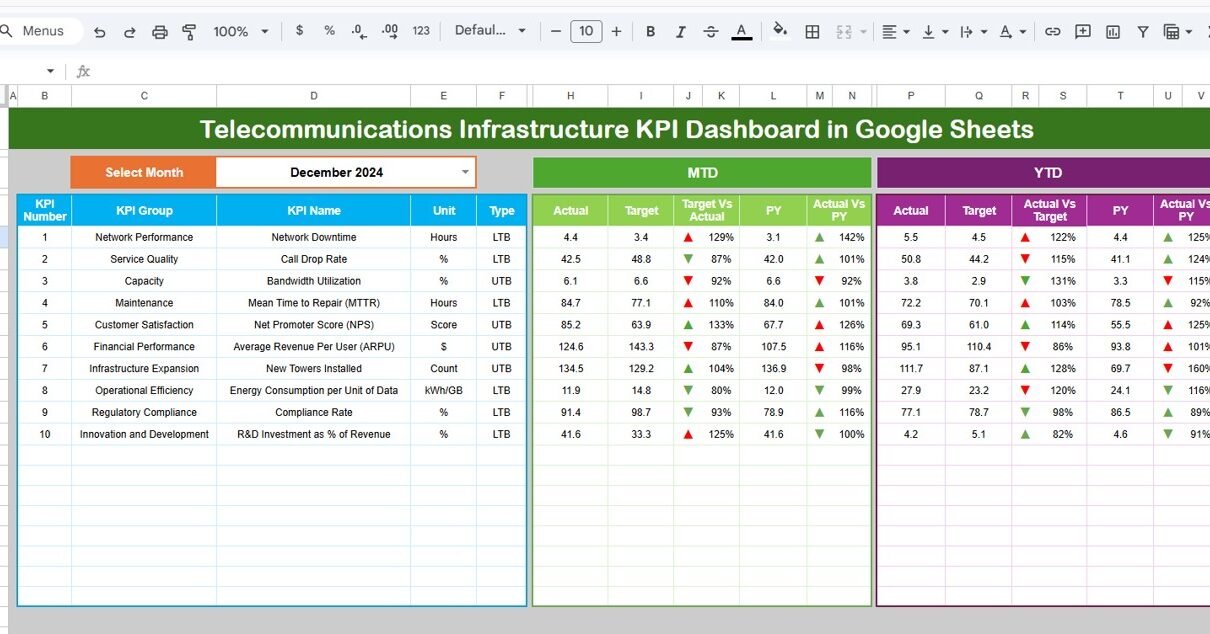
Telecommunications infrastructure forms the backbone of modern connectivity. Network availability, uptime, capacity, and service reliability directly impact customer satisfaction and business growth. However, when infrastructure KPIs remain scattered across multiple spreadsheets or reports, teams struggle to track performance accurately. As a result, network issues stay hidden, and corrective actions get delayed. That is exactly where […]
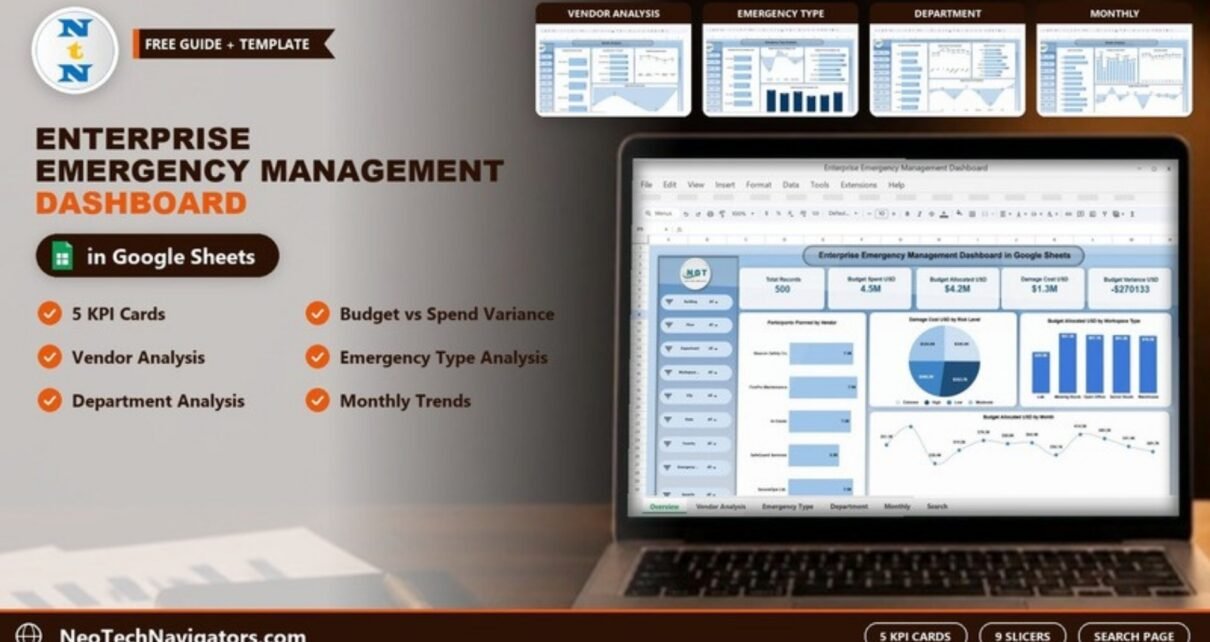
Track emergency drills, incidents, budgets, damage cost and vendor performance across sites in a Google Sheets dashboard with KPI cards, four analysis pages and slicers.
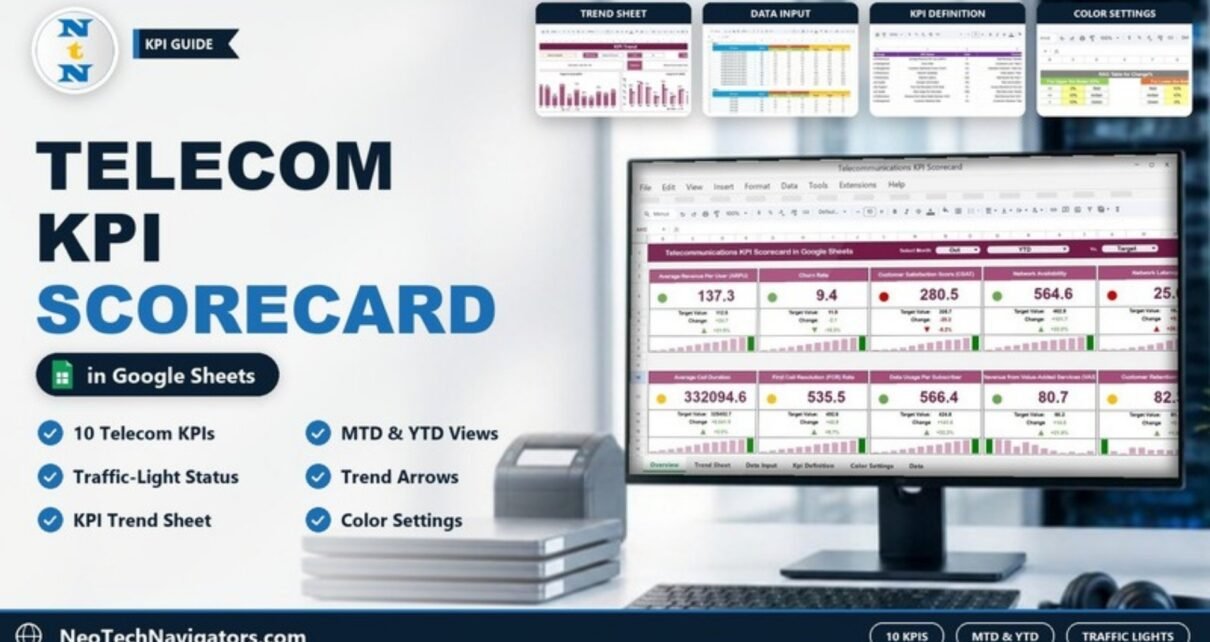
How the Telecommunications KPI Scorecard in Google Sheets works: 10 telecom KPIs on one page with Month, MTD/YTD and Vs. Target selectors, RAG traffic lights, a KPI Trend sheet, KPI definitions and step-by-step setup.