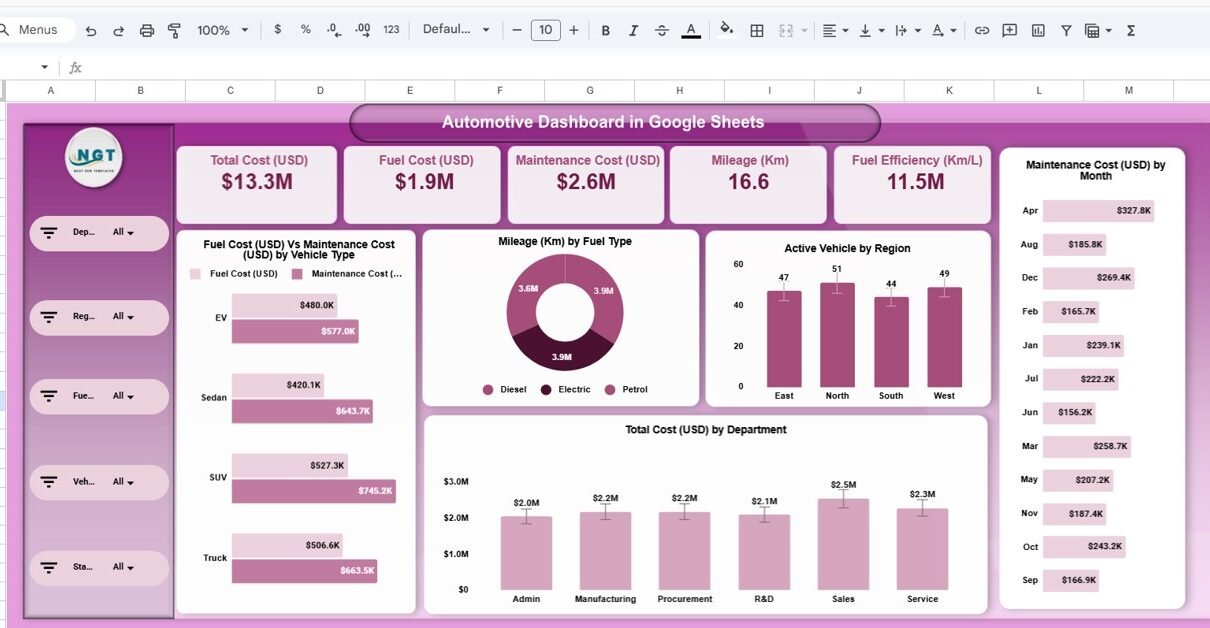
A five-page Automotive Dashboard in Google Sheets that tracks fuel cost, maintenance cost, mileage and vehicle status by department, region, vehicle type and month, plus a keyword search sheet.
Online Tutorial for Data Analysis and Automation
A five-page Automotive Dashboard in Google Sheets that tracks fuel cost, maintenance cost, mileage and vehicle status by department, region, vehicle type and month, plus a keyword search sheet.
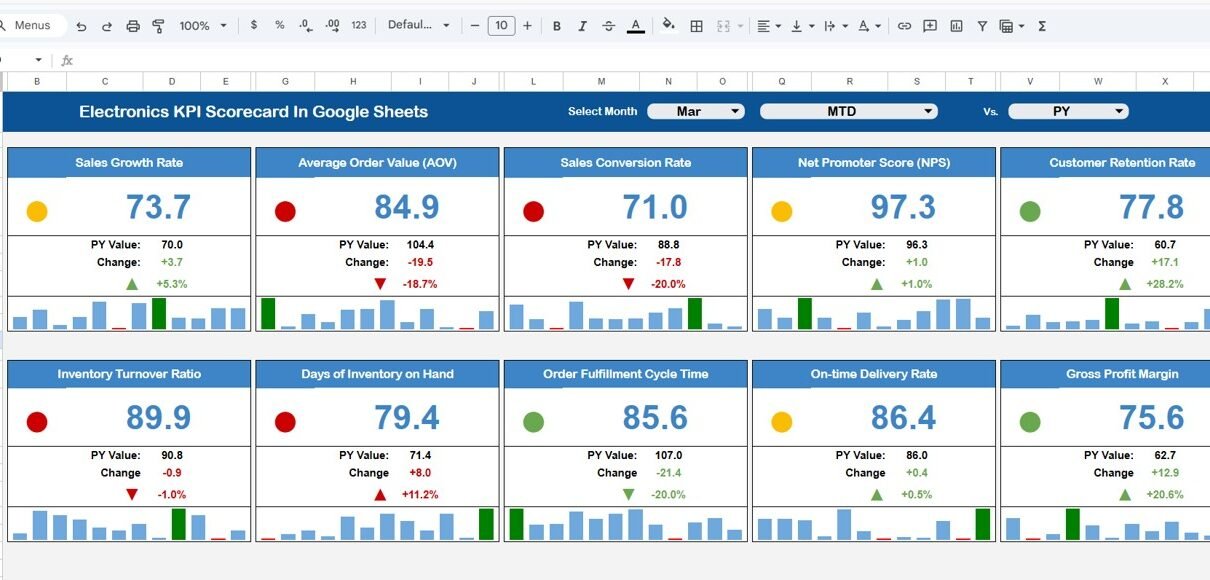
In today’s competitive electronics industry, companies must track performance with accuracy and speed. However, many businesses still rely on scattered spreadsheets and manual reports. As a result, managers struggle to monitor sales, production efficiency, inventory movement, and profitability in one place. Therefore, organizations need a centralized and dynamic KPI monitoring system. More importantly, they need […]
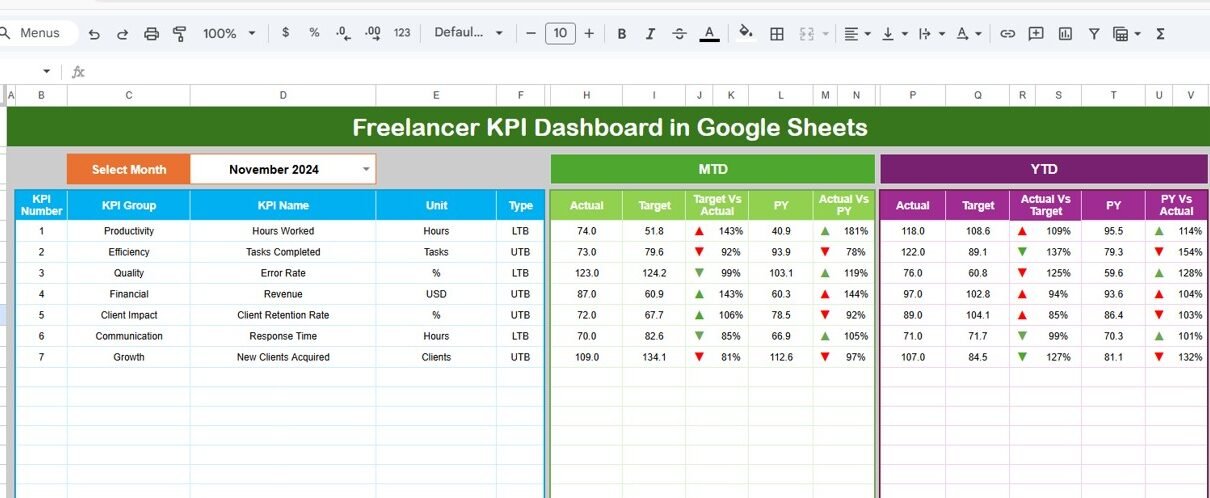
Freelancing gives you freedom. However, freedom without structure creates confusion. Many freelancers work hard every month, yet they still struggle to measure growth clearly. As a result, income becomes unstable, productivity drops, and long-term planning suffers. So, how can you manage your freelance business like a professional company? The answer is simple. You need a […]
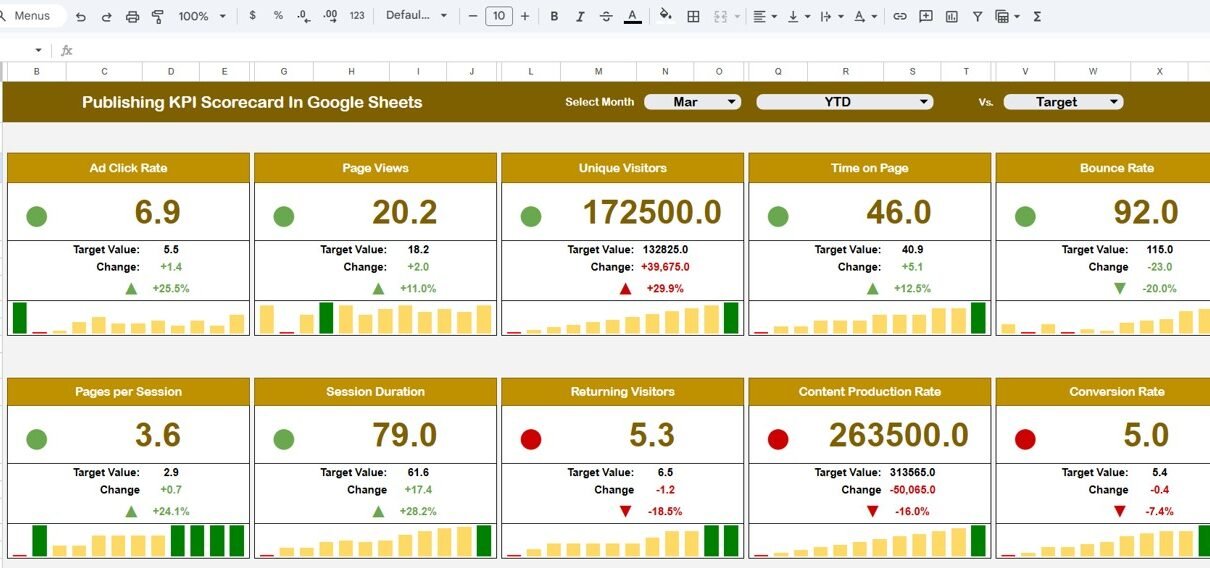
The publishing industry moves fast. Deadlines tighten. Content volume increases. Revenue targets grow every quarter. Meanwhile, editorial teams, marketing teams, and sales teams must align perfectly. However, many publishing businesses still rely on scattered spreadsheets and manual reports. As a result, leaders struggle to measure real performance. So, how can you track circulation, digital reach, […]
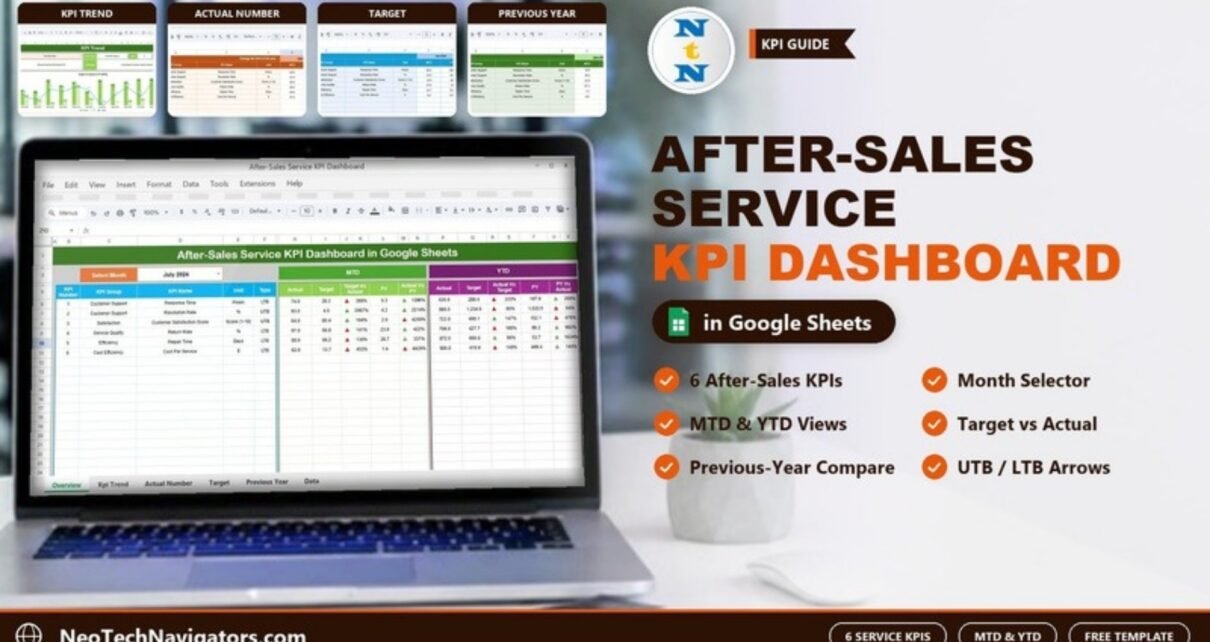
Track six after-sales KPIs (response time, resolution rate, satisfaction, return rate, repair time and cost per service) with MTD, YTD, target and previous-year comparisons in Google Sheets. Includes a sheet-by-sheet guide and worked example.
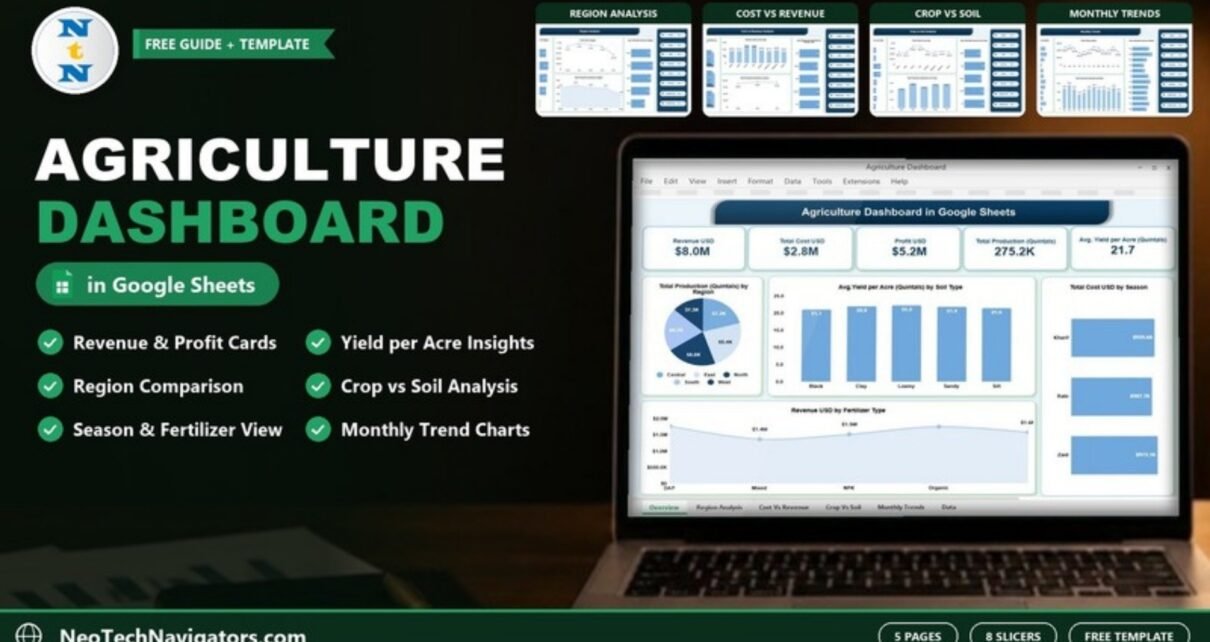
A five-page Agriculture Dashboard in Google Sheets that shows farm revenue, cost, profit, production and yield per acre by region, crop, soil, fertilizer, season and month, with eight slicers and a worked example.
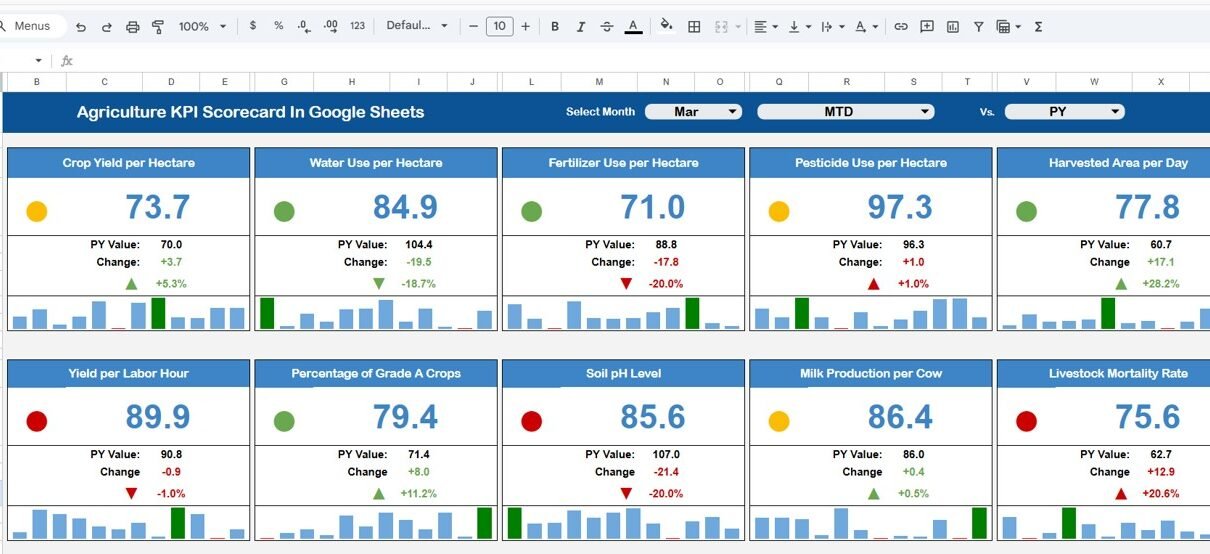
Modern agriculture runs on data. Farmers, agri-business owners, and farm managers track yield, cost, water usage, and productivity every month. However, many still use manual reports. As a result, they struggle to compare performance and detect problems early. So, how can you monitor agricultural KPIs clearly in one interactive system? The answer is simple. You […]
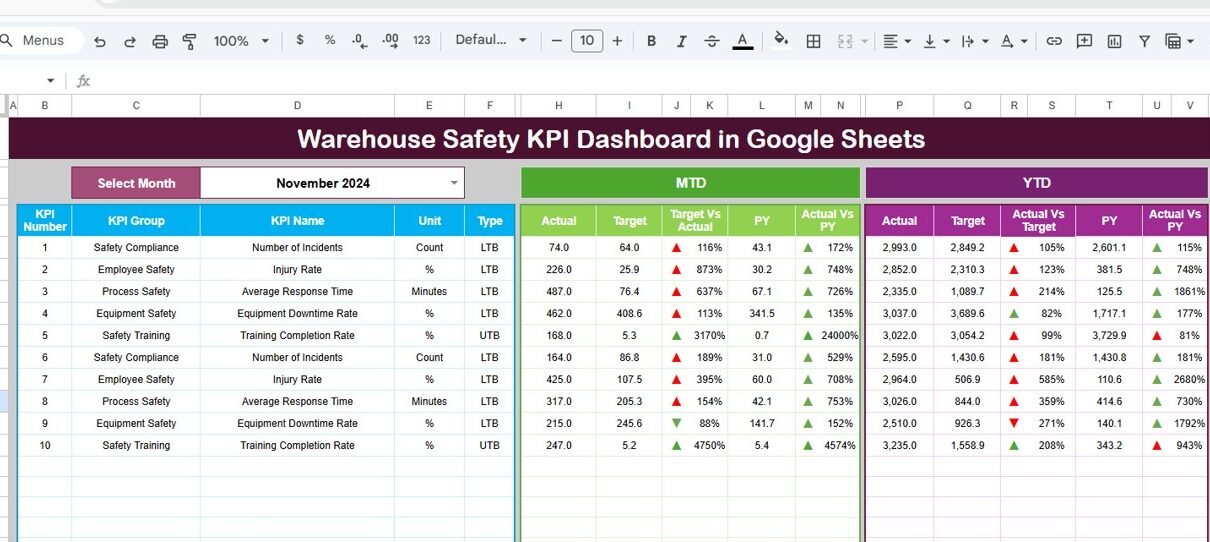
Warehouse operations move fast. However, safety risks move even faster. Forklifts operate daily. Workers handle heavy materials. Teams load and unload shipments under strict deadlines. Therefore, warehouse managers must track safety performance continuously. Yet many warehouses still rely on scattered spreadsheets. As a result, safety managers struggle to monitor incidents. Moreover, they fail to compare […]

The Legal KPI Scorecard in Google Sheets is a ready-to-use performance tracking template designed to help legal teams monitor, measure, and evaluate key legal KPIs in a clear and structured manner. Instead of managing scattered reports and manual calculations, this scorecard consolidates monthly and yearly legal performance metrics into one interactive Google Sheets scorecard. As […]

The CSR Program Performance & Impact Dashboard in Google Sheets is a ready-to-use analytics solution designed to help organizations track, measure, and evaluate the effectiveness of their Corporate Social Responsibility (CSR) initiatives.CSR Program Performance & Impact Dashboard in Google Sheets Instead of managing CSR data across multiple spreadsheets and reports, this dashboard consolidates projects, budgets, […]