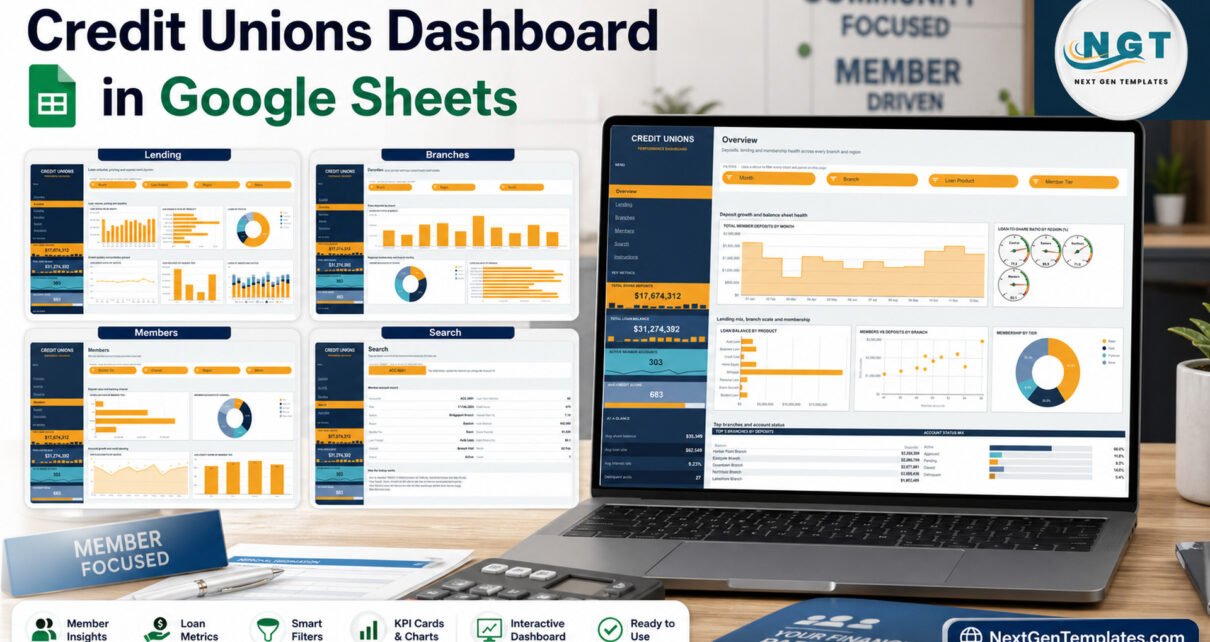
The Credit Unions Dashboard in Google Sheets turns 500 fictional member accounts into six tabs – Overview, Lending, Branches, Members, Search and Instructions – with 18 chart panels, 15 page-level slicers and four KPI cards that follow you from page to page. The sample file shows $17,674,312 in share deposits against a $31,274,392 loan book, and the Data tab has room for 1,000 accounts.
Most credit union teams already export account lists from their core system, then spend hours turning them into branch, lending and membership reports. This template gives that export a permanent home: paste the rows once and the pivots, charts and rankings rebuild themselves. It is a reporting template only – it processes no transactions, all shipped figures are sample data, and nothing in it is financial advice.
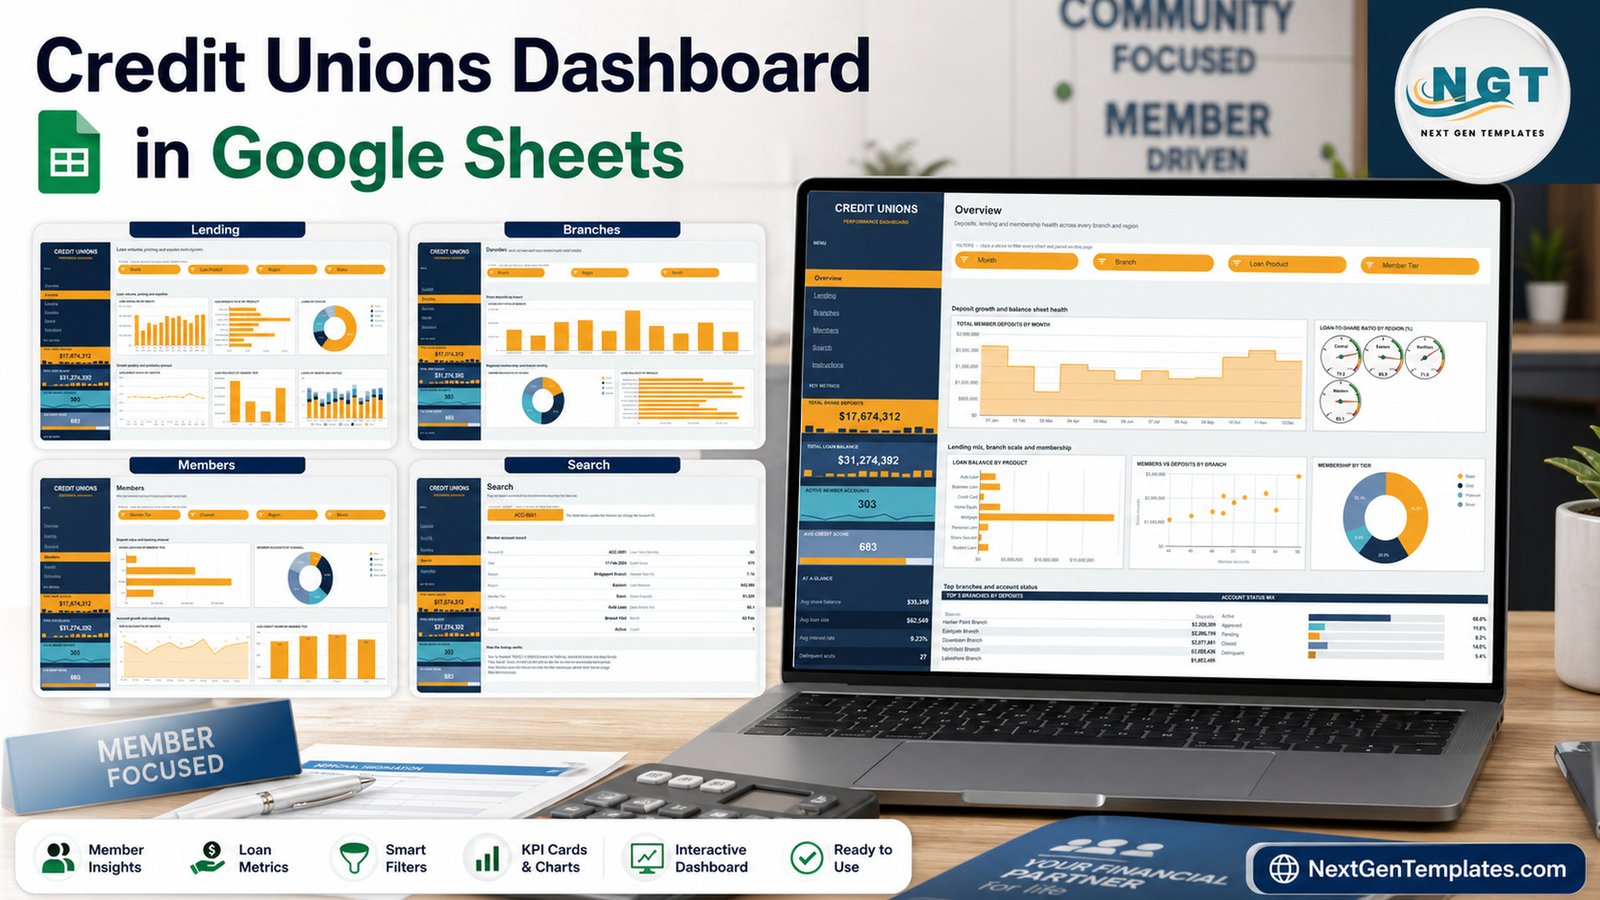
Key Features of the Credit Unions Dashboard in Google Sheets
- Persistent KPI rail. Total Share Deposits, Total Loan Balance, Active Member Accounts (303) and Avg Credit Score (683) sit in a navy rail on every page, above an At a Glance block with average share balance ($35,349), average loan size ($62,549), average interest rate (9.23%) and delinquent accounts (27).
- 15 slicers across four analysis pages. Each page filters independently using native Google Sheets slicers, so a branch manager and a lending analyst can hold different views in the same file.
- Loan-to-share ratio by region. Four gauges on the Overview page show how much each region lends against its member deposits – in the sample, Northern sits lowest at 71.6 and Eastern highest at 85.9.
- Top 5 tables and an Account Status Mix. Every analysis page ranks its leaders and shows the split between Active (60.6%), Approved, Pending, Closed and Delinquent (5.4%) accounts.
- Account lookup. The Search tab returns 16 fields for any Account ID through INDEX/MATCH and IFERROR formulas.
- No scripts. Everything is formulas, pivot tables and charts, so nothing needs authorising when you make a copy.
Dashboard Pages Explanation
Page 1: Overview
The Overview page covers deposits, lending and membership health across every branch and region, filtered by Month, Branch, Loan Product and Member Tier. Charts include Total Member Deposits by Month, Loan-to-Share Ratio by Region, Loan Balance by Product, Members vs Deposits by Branch and Membership by Tier (Basic 40.8%, Silver 30.4%, Gold 20.0%, Platinum 8.8%), followed by Top 5 Branches by Deposits, led by Harbor Point Branch at $2,926,309.

Page 2: Lending
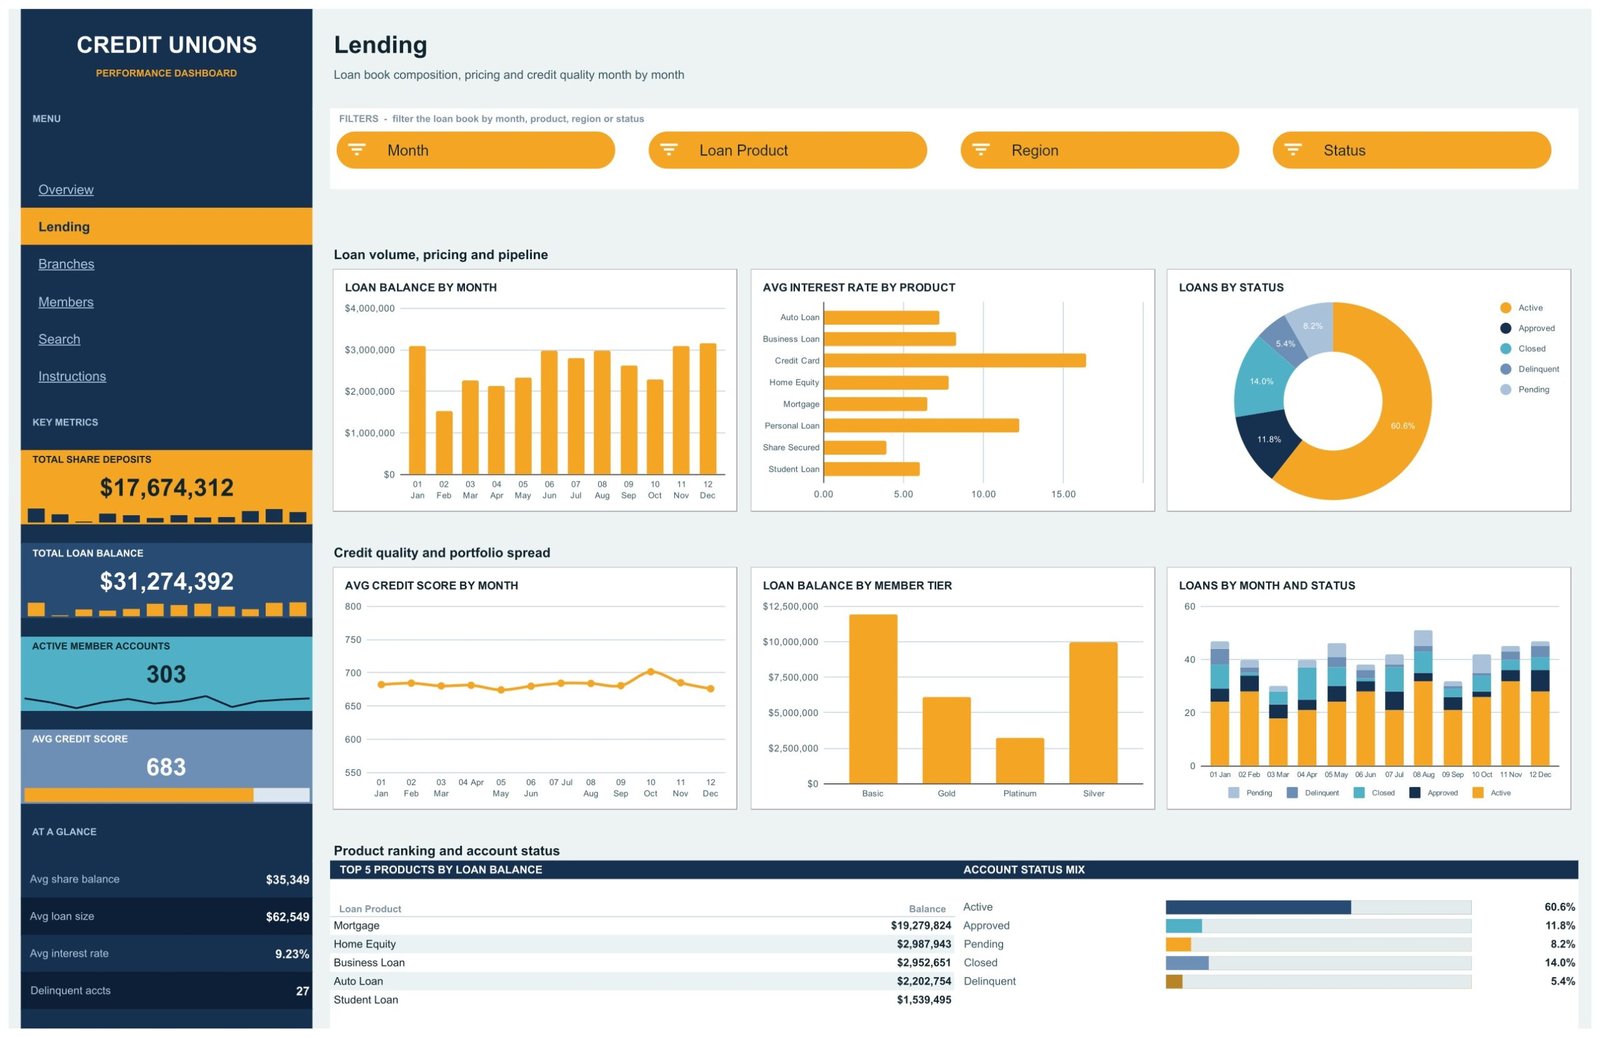
The Lending page explains loan book composition, pricing and credit quality month by month, filtered by Month, Loan Product, Region and Status. Charts include Loan Balance by Month, Avg Interest Rate by Product, Loans by Status, Avg Credit Score by Month, Loan Balance by Member Tier and Loans by Month and Status. The Top 5 Products by Loan Balance table shows Mortgage far ahead at $19,279,824, then Home Equity, Business Loan, Auto Loan and Student Loan.
Page 3: Branches
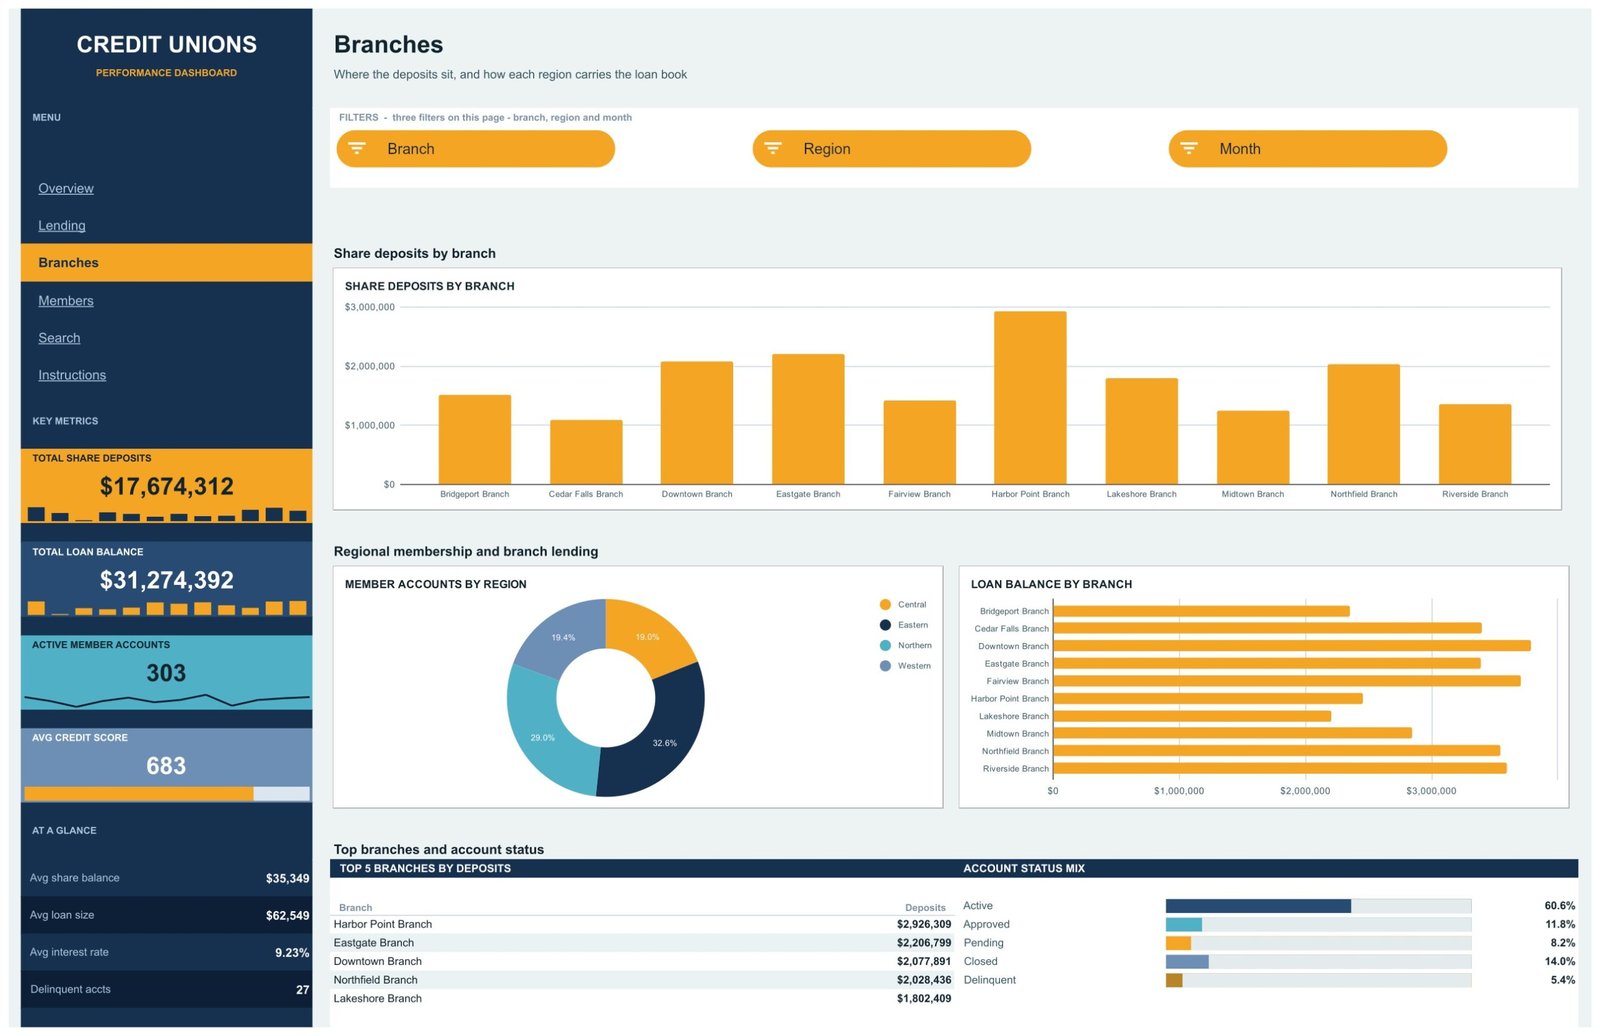
The Branches page shows where the deposits sit and how each region carries the loan book, with three slicers for Branch, Region and Month. Share Deposits by Branch and Loan Balance by Branch compare ten sample branches from Bridgeport to Riverside, while Member Accounts by Region shows Eastern holding the largest share at 32.6%.
Page 4: Members
The Members page answers who the members are, how they bank and what they hold, filtered by Member Tier, Channel, Region and Month. Charts include Share Deposits by Member Tier, Member Accounts by Channel (Mobile App 29.6% and Branch Visit 27.8% lead), Member Accounts by Month and Avg Credit Score by Member Tier, where Platinum averages 773 and Basic 634.

Page 5: Search
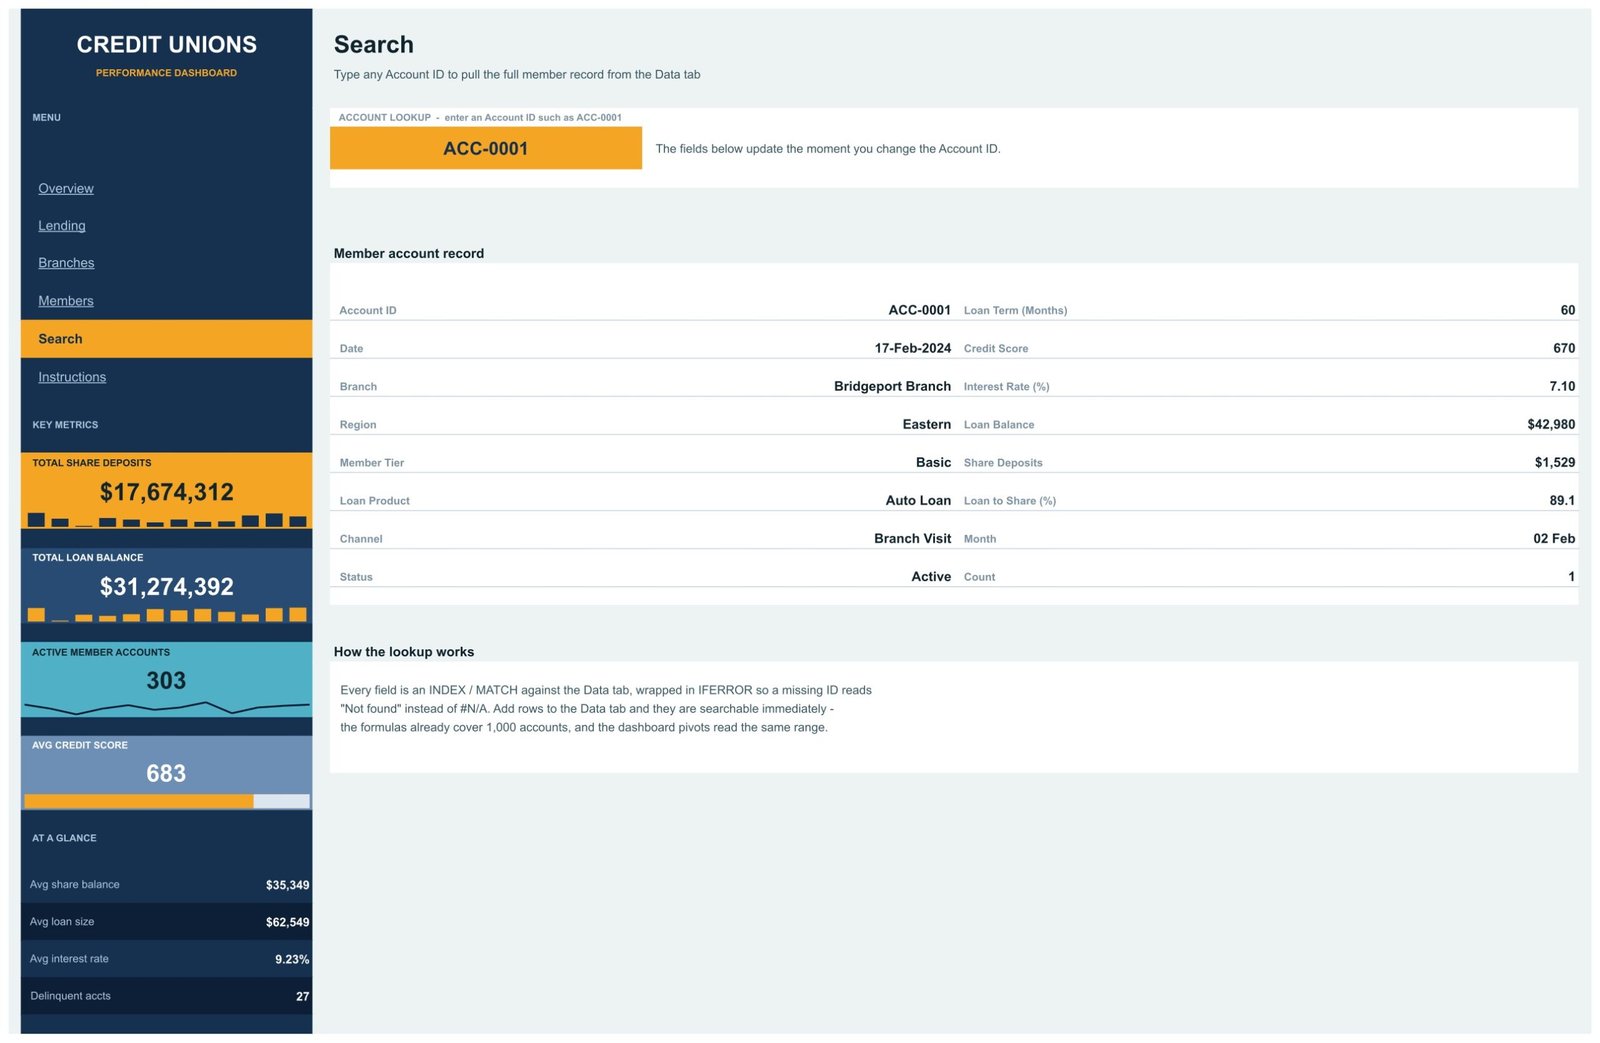
The Search page pulls one account record at a time. Type an ID such as ACC-0001 and it returns Date, Branch, Region, Member Tier, Loan Product, Channel, Status, Loan Term, Credit Score, Interest Rate, Loan Balance, Share Deposits, Loan to Share, Month and Count. A mistyped ID reads “Not found” rather than an error.
Page 6: Instructions
The Instructions page lists four steps: load your own data, use the filters, move around with the rail and make it yours. It also explains that the pivot tables feeding the charts start at column Z on each page, which matters when you want to add a chart of your own.

Behind these pages, a Data tab holds the 16-column account table that every chart, slicer and lookup reads.
Google Sheets vs. Excel vs. Paid BI Software – Feature Comparison
| Feature | This Google Sheets credit union dashboard | Microsoft Excel dashboard | Paid BI / analytics SaaS |
|---|---|---|---|
| Cost | ✅ $9.99 one-time (sale price) | Template price plus an Excel licence | Recurring per-user subscription |
| Platform | ✅ Google Sheets in any browser | Excel desktop | Vendor cloud app |
| Setup time | ✅ Make a copy, paste your rows | Open the file, paste your rows | Connectors, data model and user set-up |
| Real-time team collaboration | ✅ Built into Google Sheets sharing | Needs OneDrive or SharePoint co-authoring | Yes, for each licensed seat |
| Mobile access | ✅ Google Sheets app | Excel mobile app | Vendor mobile app |
| Customizable fields | ✅ Edit headers, pivots and charts directly | ✅ Full control | Limited by the vendor data model |
| Share with link | ✅ Standard Google share link | File sharing through OneDrive | Viewer seats usually required |
| Year-1 cost at 5 users | ✅ $9.99 in total | Template plus five Excel licences | Five recurring subscriptions |
| Loan-to-share gauges and account lookup | ✅ Included and ready | Depends on the workbook | Built by you or a consultant |
For credit union teams that want branch, lending and membership reporting without per-seat fees, this Google Sheets template sits in the sweet spot.
Who Should Use This Template
Perfect for:
- Branch and operations managers at community credit unions who review deposits, loans and member mix every month.
- Finance analysts building committee or board packs from an exported account list.
- Consultants, trainers and students who need a realistic, fictional credit union data model for pivot-table practice.
Not a fit if:
- You need core-banking, loan-origination or member-management software. This template analyses data you paste in; it does not run accounts. Our Credit Union Member Management System Web App walkthrough covers a record-keeping app instead.
- You need regulatory returns, audit trails or compliance workflows.
- You want financial or investment advice – the template offers none.
Real-World Use Cases
Maria, operations manager at a ten-branch community credit union (illustrative), filters the Branches page by Region before every monthly review. Comparing Share Deposits by Branch with Loan Balance by Branch shows her which branches lend heavily against a thin deposit base, and the Top 5 table goes straight into her slides.
David, a finance analyst, prepares the lending committee pack. He sets the Lending page Status slicer to Delinquent and Pending, reads Avg Interest Rate by Product and Loan Balance by Member Tier, and uses the Search tab whenever a committee member asks about one account.
Aisha teaches a banking analytics course. She shares a copy with her class so students can trace how one Data tab feeds 18 chart panels, 15 slicers and an INDEX/MATCH lookup, then asks them to add a new chart from the pivots at column Z.
Advantages of This Credit Union Reporting Template
- One purchase, whole team. The $9.99 sale price covers the template once, and Google Sheets sharing handles the rest – no per-user licence.
- Consistent monthly packs. Because every page reads the same Data tab, each month’s report uses identical definitions for deposits, loans and account status.
- Built-in structure. Eight loan products, ten branches, four regions, four member tiers, five channels and five account statuses are already modelled in the sample data, so the layout shows exactly how your own export should look.
- Privacy-friendly by design. The data model is keyed on Account ID and carries no member names or contact details.
Opportunities for Improvement
- Manual refresh of data. There is no live connection to a core-banking system; you paste an export into the Data tab each period.
- Slicers are page-scoped. A filter set on Overview does not carry over to Lending, which is intentional but means repeating selections across pages.
- 1,000-row ceiling out of the box. The pivots read A1:P1001; larger books need the source ranges widened.
- No forecasting or targets. The dashboard is descriptive. If you want targets and traffic lights, a KPI-style build such as the Loan Portfolio KPI Dashboard in Google Sheets is a better complement.
- One record at a time on Search. The lookup shows a single account; lists still live on the Data tab.
Best Practices
- Keep every Account ID unique and never blank – the pivots use it to ignore empty rows.
- Use one spelling for each branch, region, product and tier so slicers do not show near-duplicates.
- Save a dated copy at month end before pasting the next export, so you can compare periods.
- Strip personal identifiers from any export before it reaches a shared spreadsheet.
- Read Google’s guide to chart types in Google Sheets before adding new visuals from the pivots.
Explore Relevant Templates
- Credit Unions Dashboard in Excel and Credit Unions Dashboard in Power BI – separate builds of the same topic for Excel and Power BI users.
- Credit Unions KPI Dashboard in Power BI – a KPI scorecard view rather than an analytical dashboard.
- Loan Portfolio KPI Dashboard in Google Sheets and Banking KPI Scorecard in Google Sheets.
- Want a broader view? Read our Banking Dashboard in Google Sheets guide, or the Credit Union Dashboard in Google Sheets walkthrough for the earlier, separately built edition with different tabs.
- 💎 Need a wider finance toolkit? The CFO’s Financial Command Toolkit bundles ten Excel, Google Sheets and Power BI finance templates.
Frequently Asked Questions
What does this credit union dashboard track?
It tracks Total Share Deposits, Total Loan Balance, Active Member Accounts and Avg Credit Score in the rail, plus average share balance, loan size, interest rate and delinquent accounts. Four analysis pages add 18 chart panels, Top 5 rankings and an Account Status Mix covering Active, Approved, Pending, Closed and Delinquent.
How long does setup take?
Usually a few minutes. Make a copy from the link in the PDF, paste your account export into the Data tab under the 16 existing headers, and every card, chart, slicer and Top 5 table recalculates. There are no scripts, add-ons or authorisation prompts to deal with.
How does it compare to paid BI software?
Paid analytics platforms bill per user each month and need connectors plus a data model before you see a chart. This Google Sheets template costs $9.99 once, shares with a normal Google link and arrives with credit union pages already designed, which suits small teams avoiding seat fees.
Is it core-banking or regulatory reporting software?
No. It is a reporting template for data you paste in. It does not process transactions, originate loans, manage members or produce regulatory returns, and it offers no financial or investment advice. Every figure shipped in the file is fictional sample data meant to show how the pages work.
How is it different from the earlier Credit Union Dashboard in Google Sheets?
They are separate builds with different layouts. This edition adds a left navigation rail, loan-to-share gauges by region, an Account Status Mix panel on every analysis page, a 16-field Search tab and an Instructions tab. Compare the page screenshots and choose the one that matches your reporting.
How many member accounts can it hold?
The pivots read A1:P1001, so the Data tab holds up to 1,000 accounts without changes. The sample ships with 500 fictional accounts. For a larger book, widen the pivot source ranges and the Search formulas to the new last row.
About the Author
Built by PK – Microsoft Certified Professional with 15+ years of Excel, Google Sheets and Power BI experience. Founder of NextGenTemplates, reaching 300K+ subscribers across YouTube channels. Every template is hand-built and tested before release.
Conclusion
If your credit union already exports account data, this template turns it into a branch, lending and membership report in minutes, with loan-to-share gauges, Top 5 rankings and an account lookup ready to go.
👉 Click here to purchase the Credit Unions Dashboard in Google Sheets
✅ Instant download · One-time payment · No subscription
🎥 More tutorials: Youtube.com/@NeoTechNavigators
📅 Last updated: September 2026