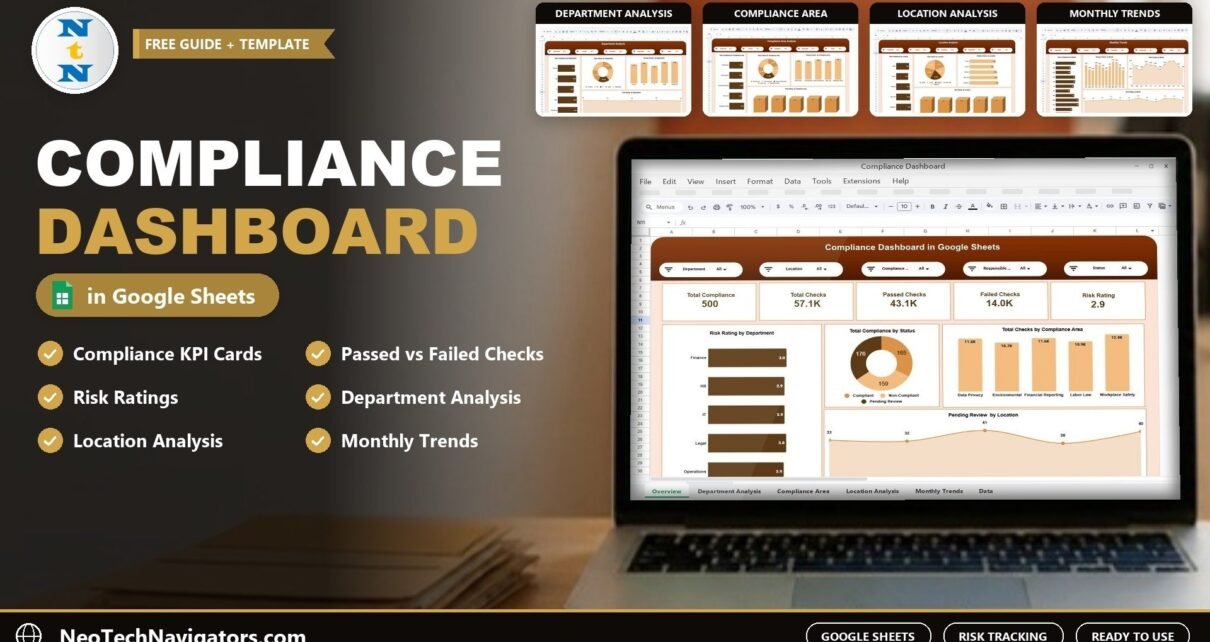
The Compliance Dashboard in Google Sheets tracks compliance records, total, passed and failed checks and risk ratings across departments, compliance areas, locations and months, with slicers for fast drill-down.
Online Tutorial for Data Analysis and Automation
The Compliance Dashboard in Google Sheets tracks compliance records, total, passed and failed checks and risk ratings across departments, compliance areas, locations and months, with slicers for fast drill-down.

Organizations today invest heavily in employee training, professional development, and skill enhancement programs. Because businesses operate in competitive environments, they must continuously improve employee knowledge and capabilities. Learning and development (L&D) initiatives help companies build stronger teams, improve productivity, and achieve long-term success.Learning & Development KPI Dashboard in Google Sheets However, simply running training programs […]
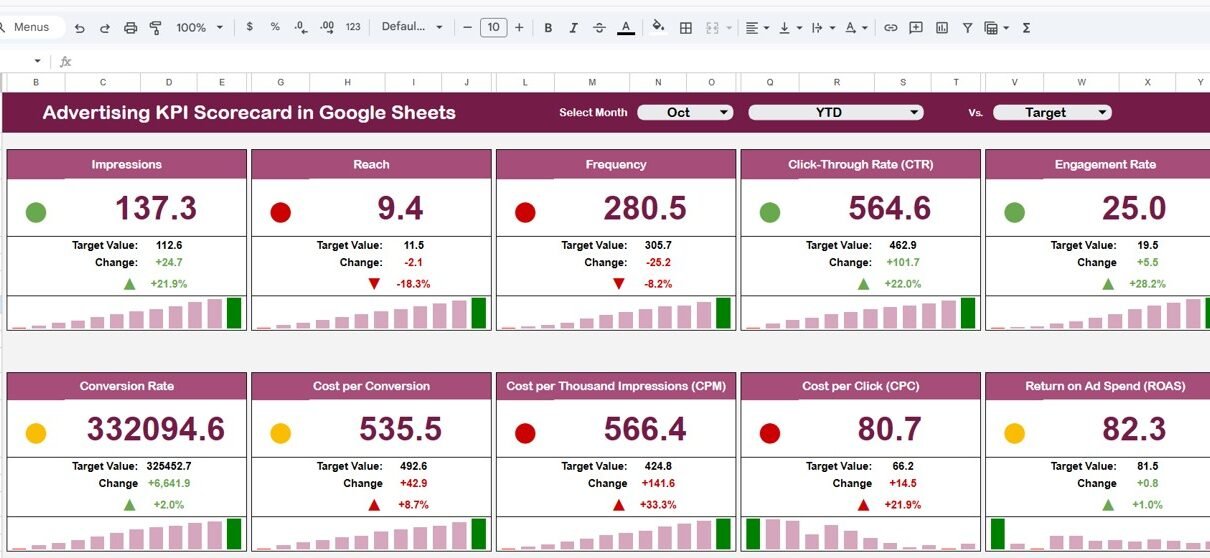
Advertising plays a crucial role in modern business growth. Companies invest heavily in digital advertising, social media campaigns, search engine marketing, and display ads to attract customers and generate revenue. However, running advertising campaigns alone does not guarantee success. Businesses must continuously track campaign performance to understand what works and what needs improvement. Many marketing […]
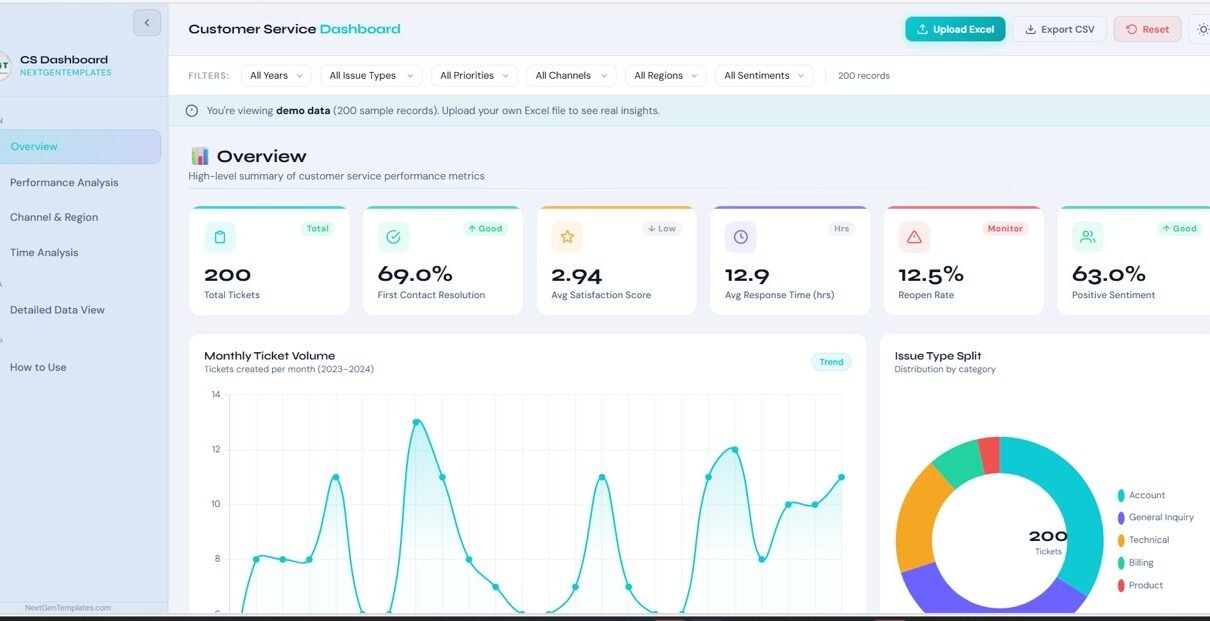
Customer service plays a critical role in shaping customer satisfaction, brand loyalty, and long-term business success. However, many organizations still struggle to monitor support performance because data is scattered across spreadsheets, CRM tools, and ticketing platforms. As a result, managers find it difficult to track response times, agent performance, ticket volumes, and customer satisfaction metrics. […]
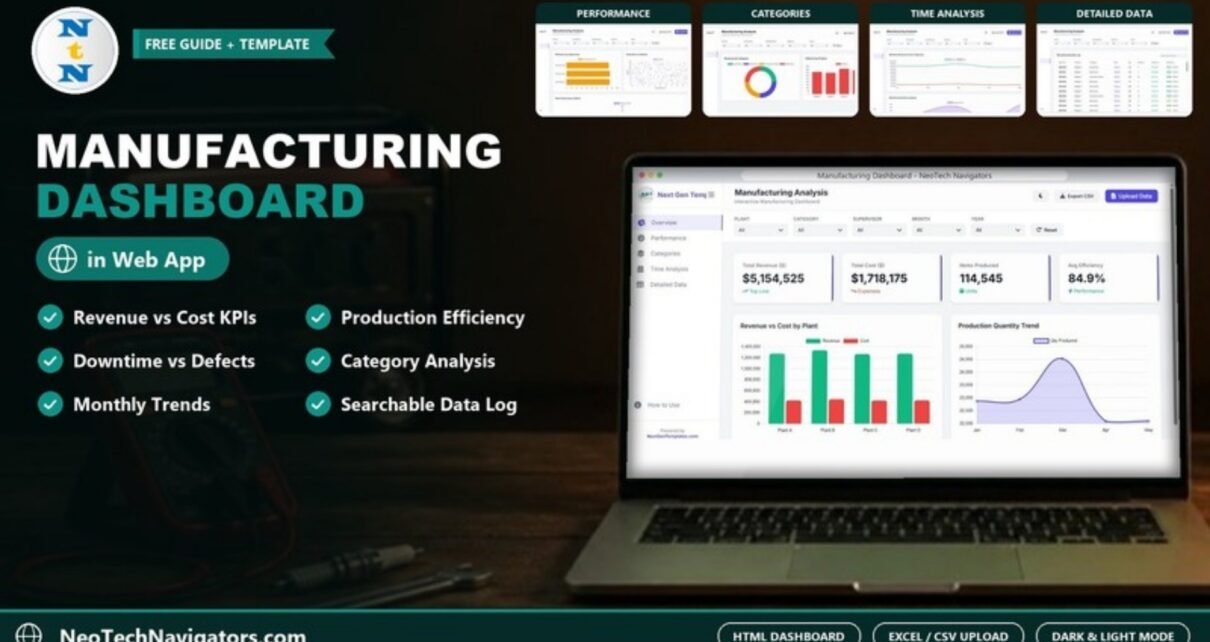
A browser-based Manufacturing Dashboard in HTML that turns an Excel or CSV production log into charts on revenue, cost, output, efficiency, downtime and defects by plant, supervisor and product.
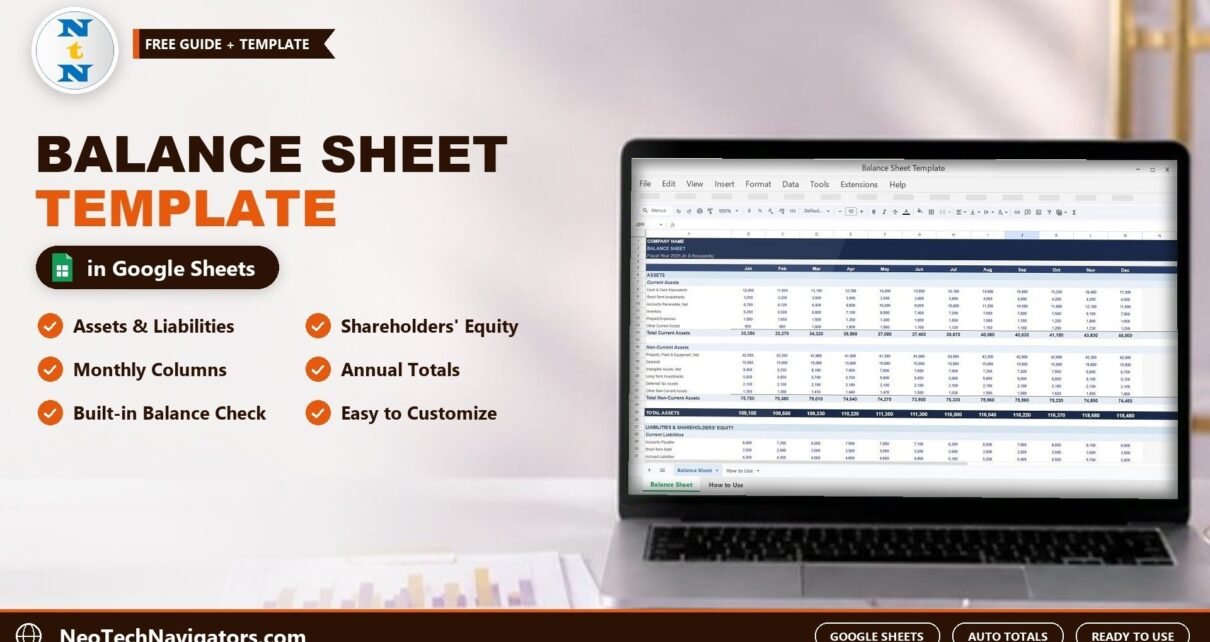
The Balance Sheet Template in Google Sheets tracks assets, liabilities and equity month by month from January to December, calculates every total and checks that the accounting equation balances.
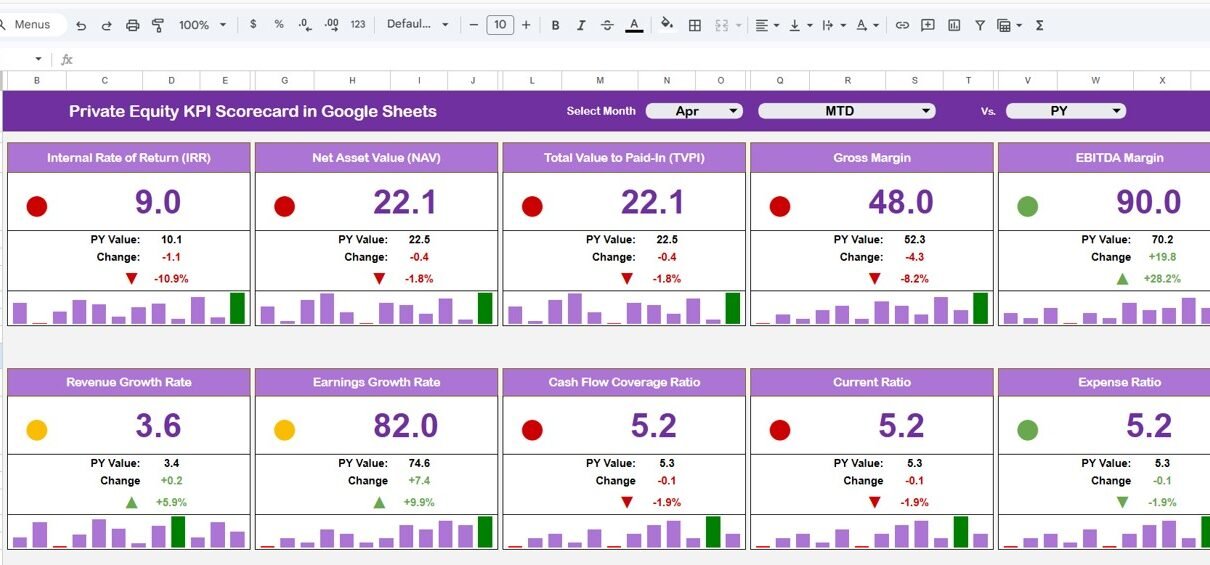
Private equity firms operate in a highly competitive and performance-driven environment. Investors expect clear visibility into portfolio growth, returns, operational efficiency, and fund performance. However, many firms still track performance using scattered spreadsheets or manual reports. As a result, managers struggle to analyze investment performance quickly and accurately. A Private Equity KPI Scorecard in Google […]
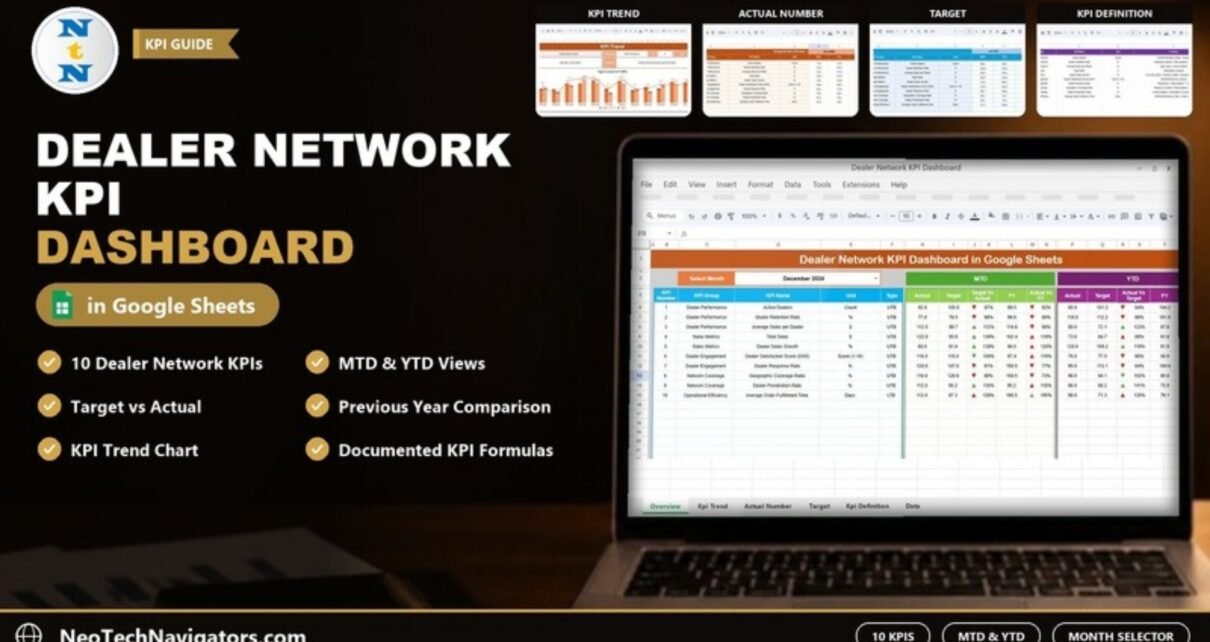
A six-sheet Google Sheets KPI dashboard that tracks 10 dealer network KPIs month-to-date and year-to-date against targets and the previous year, with a month selector, KPI trend chart and documented KPI formulas.
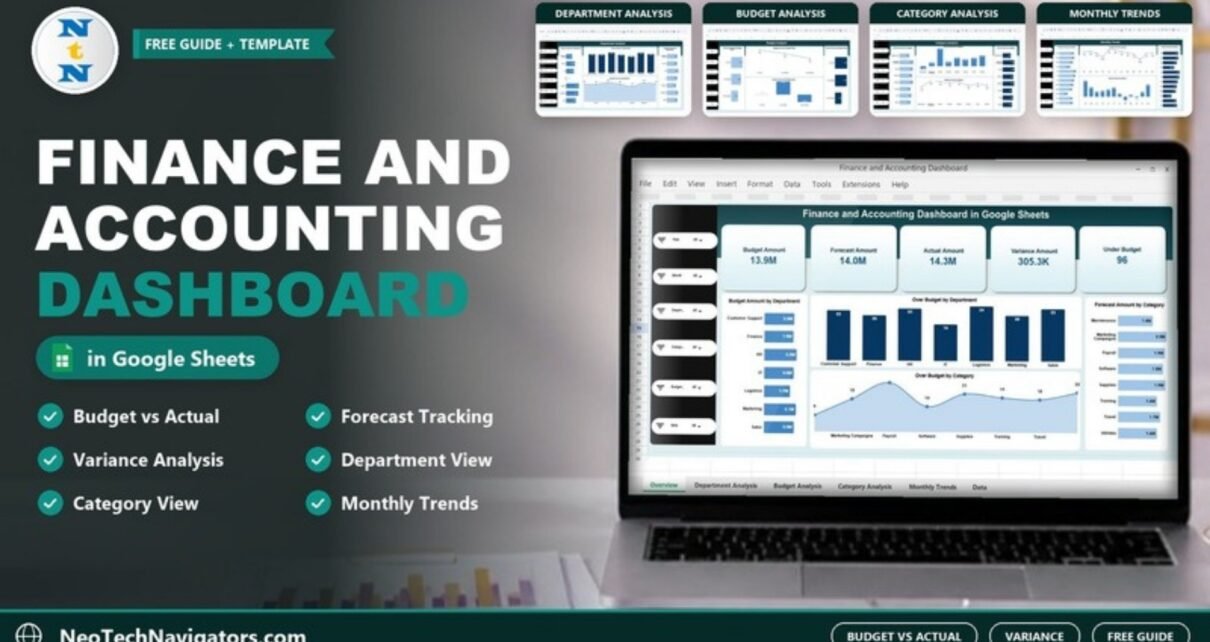
A practical guide to the Finance and Accounting Dashboard in Google Sheets: five pages tracking budget, forecast, actual and variance by department, category, budget status and month, with setup steps and a worked variance example.
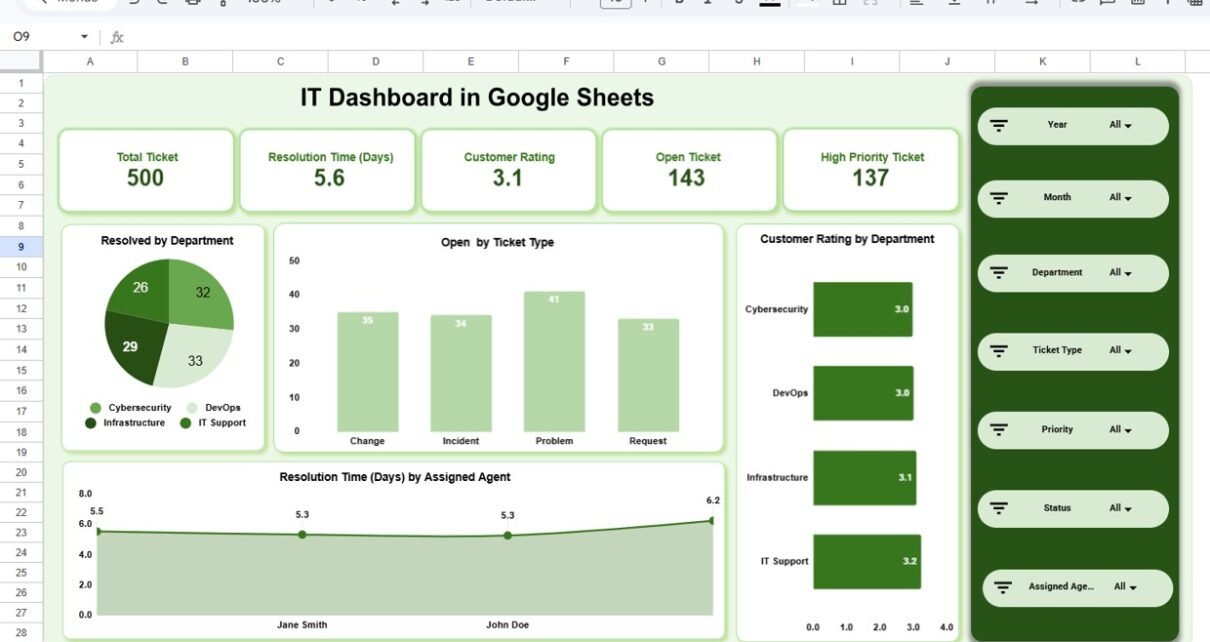
Managing IT operations without structured reporting creates confusion, delays, and performance gaps. However, many organizations still depend on scattered spreadsheets and manual reports. As a result, IT managers struggle to monitor ticket volume, resolution time, SLA compliance, and agent productivity in one place. Therefore, businesses need a centralized and interactive reporting system. The IT Dashboard […]