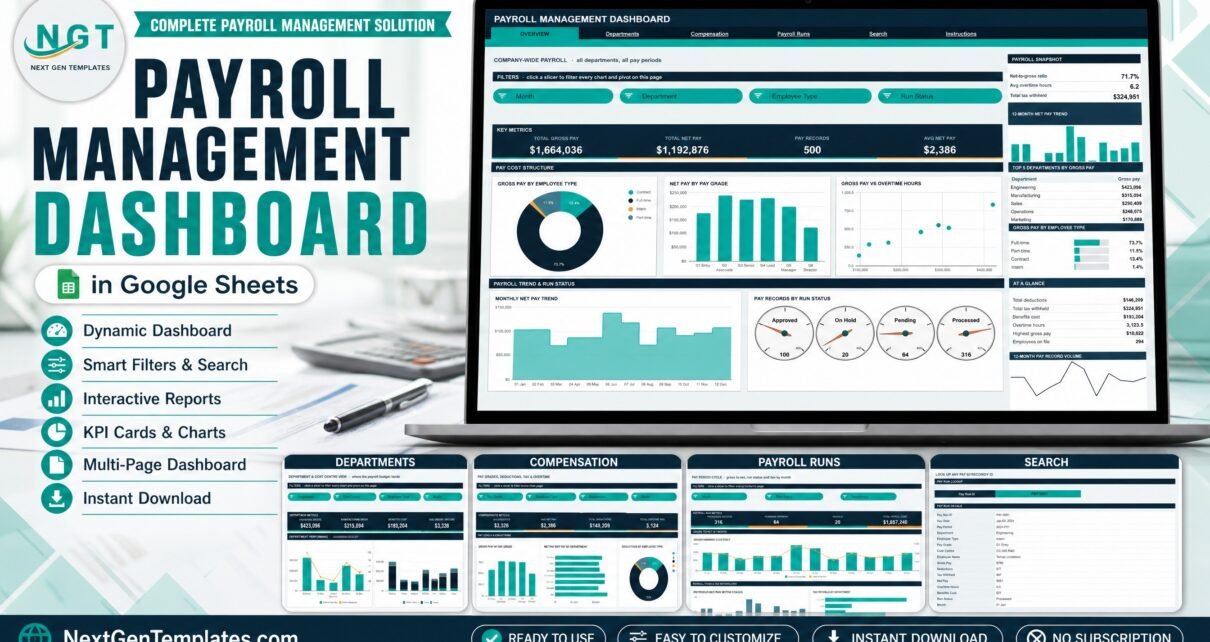
The Payroll Management Dashboard in Google Sheets turns a 500-row pay register into six tabs, 16 KPI cards, 21 charts and 15 slicers – a pivot-and-slicer reporting layer over the payroll system you already run. Reporting only: it does not calculate pay or file any statutory tax.
Blog
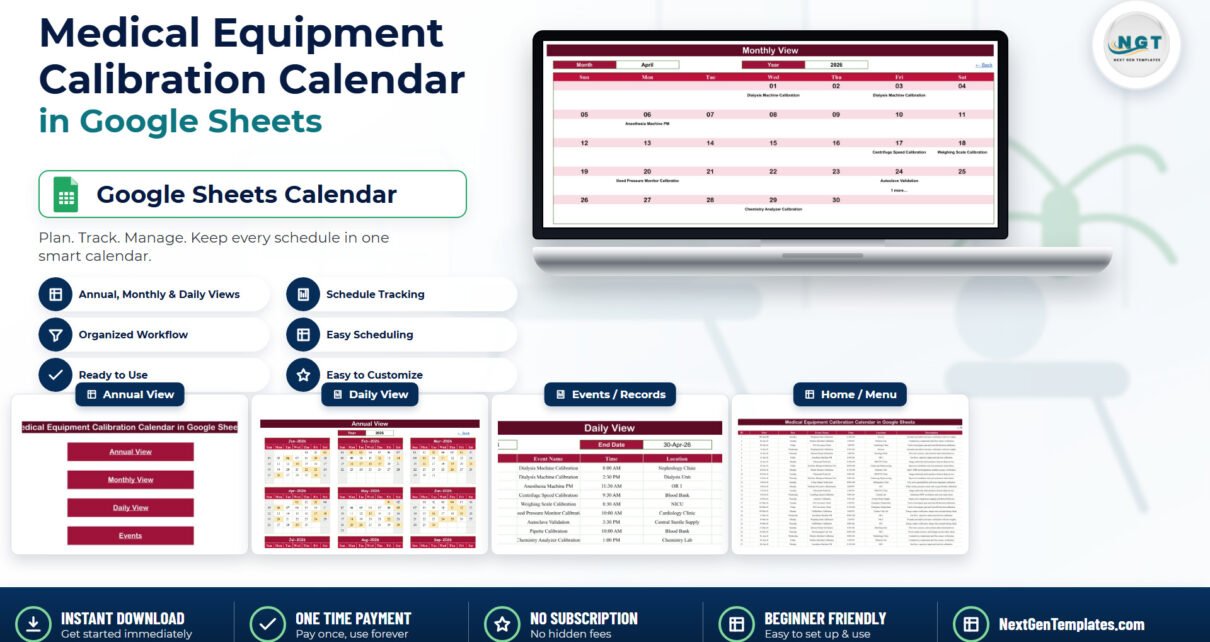
Medical Equipment Calibration Calendar in Google Sheets
A shared Google Sheets calendar for medical equipment calibration and preventive maintenance: six tabs, Annual, Monthly and Daily views over one 100-row table, and a clear account of what a spreadsheet can and cannot do in a regulated department.
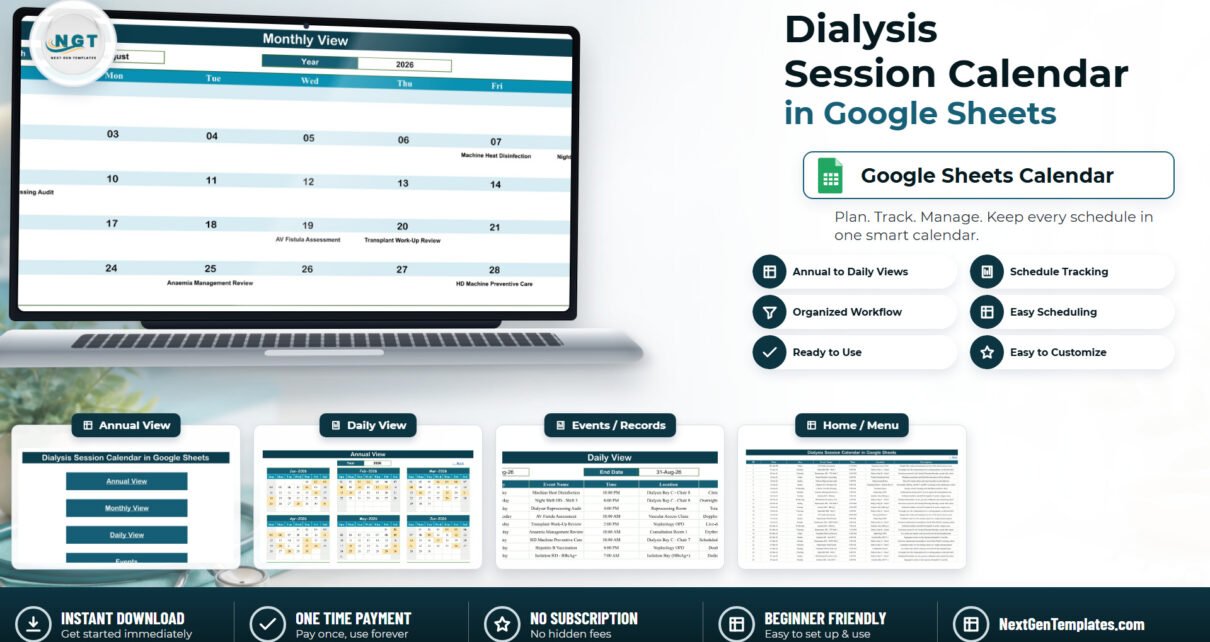
Dialysis Session Calendar in Google Sheets
The Dialysis Session Calendar in Google Sheets is a ready-to-copy scheduling workbook with six tabs, three linked calendar views and 100 sample entries loaded across 2026, covering 20 session and unit-task labels in 25 named chairs, bays and rooms. It is a scheduling spreadsheet only – not a patient record, not an EHR/EMR and not a dialysis management system – and it stores no patient identifiers at all.
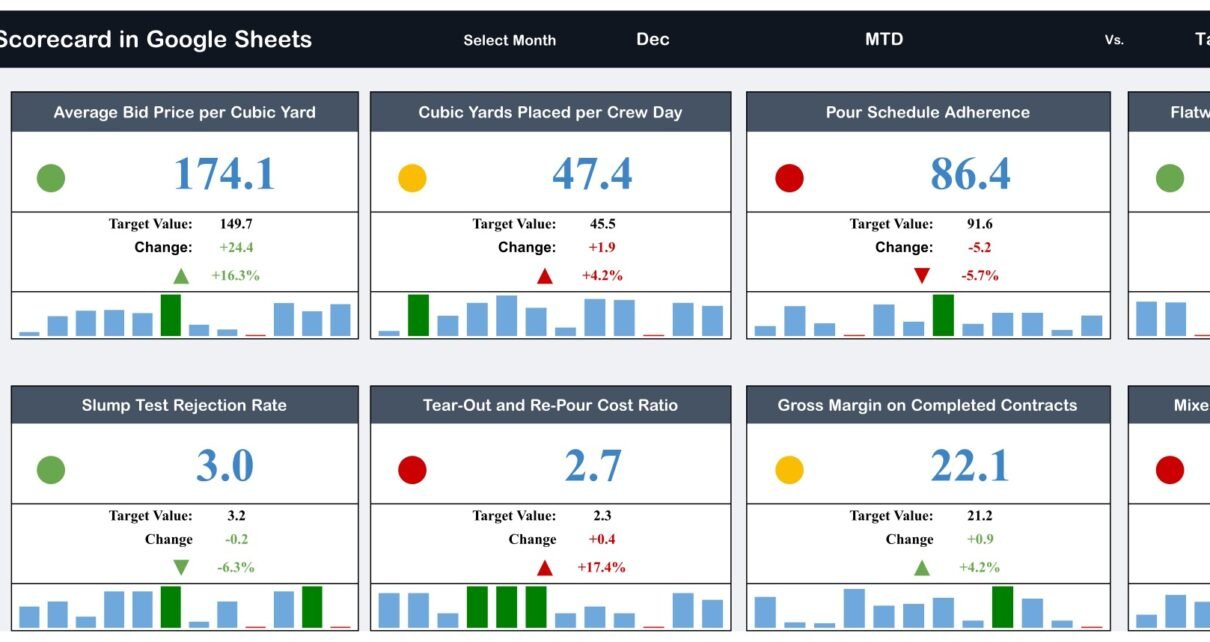
Concrete Contractor KPI Scorecard in Google Sheets
Track ten concrete contractor KPIs on one screen in Google Sheets – month picker, red/amber/green traffic lights, MTD and YTD against target and prior year, plus a KPI trend page and written formulas for every metric.
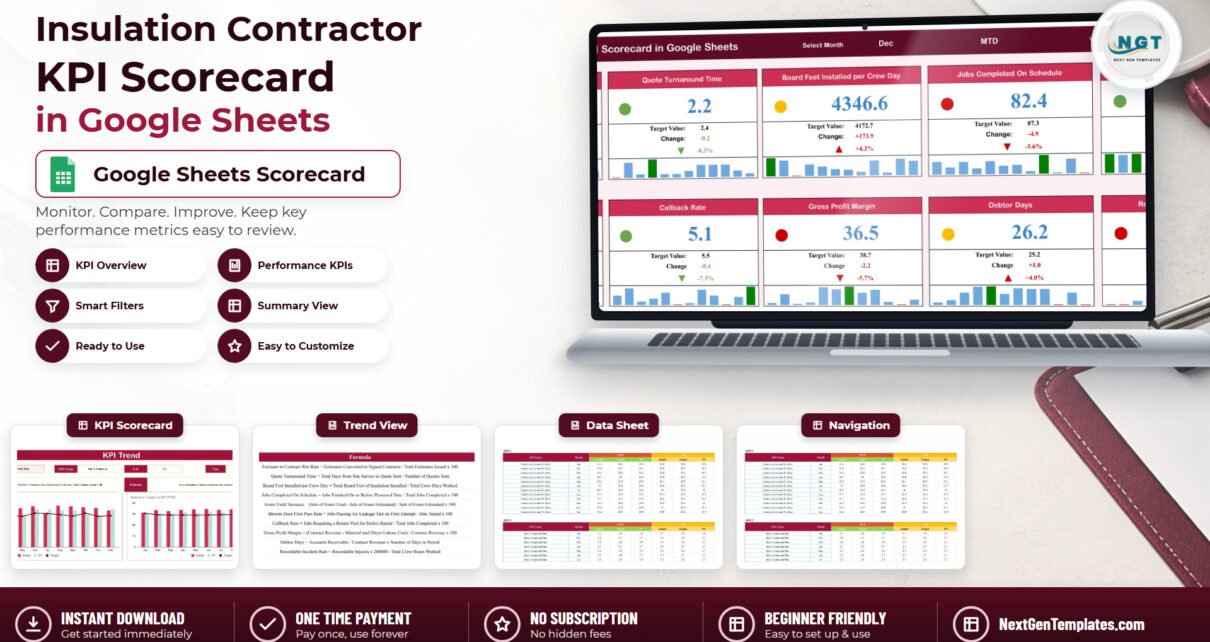
Insulation Contractor KPI Scorecard in Google Sheets
Track ten insulation KPIs – board feet per crew day, foam yield variance, blower door first-pass rate, callback rate, gross margin and more – on one page in Google Sheets, with MTD/YTD traffic lights scored against your own targets.
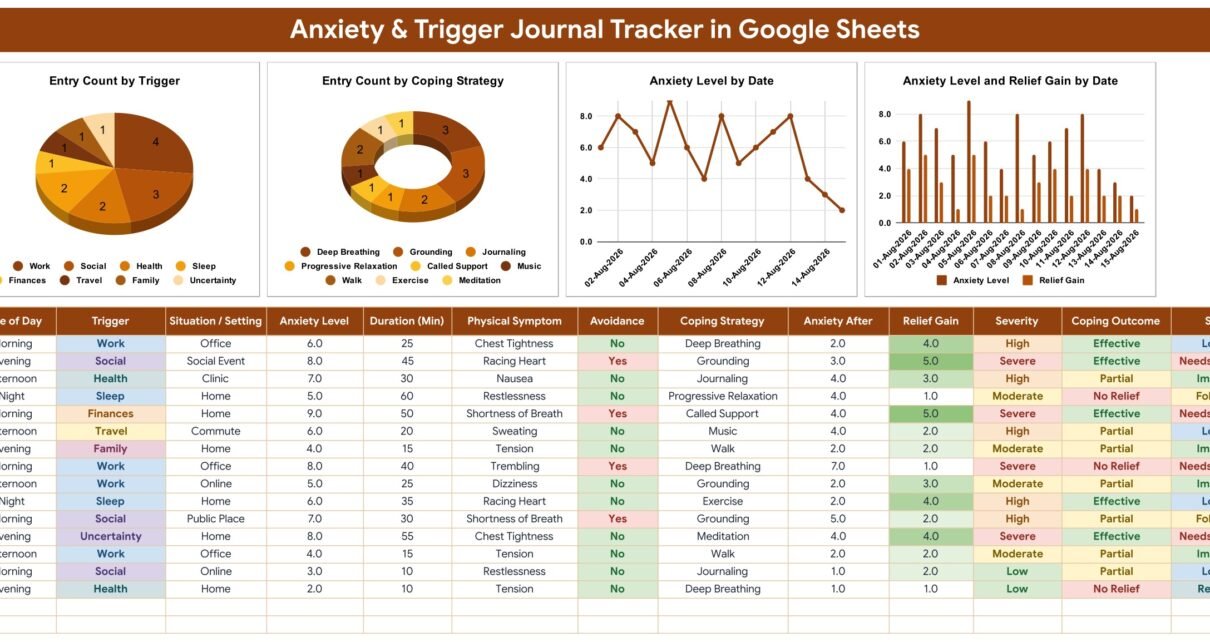
Anxiety & Trigger Journal Tracker in Google Sheets
A Google Sheets anxiety journal that logs one episode per row across 16 columns, calculates Relief Gain, Severity and Coping Outcome for you, and charts which triggers and coping strategies keep coming back. A personal self-reflection tool – not medical advice.
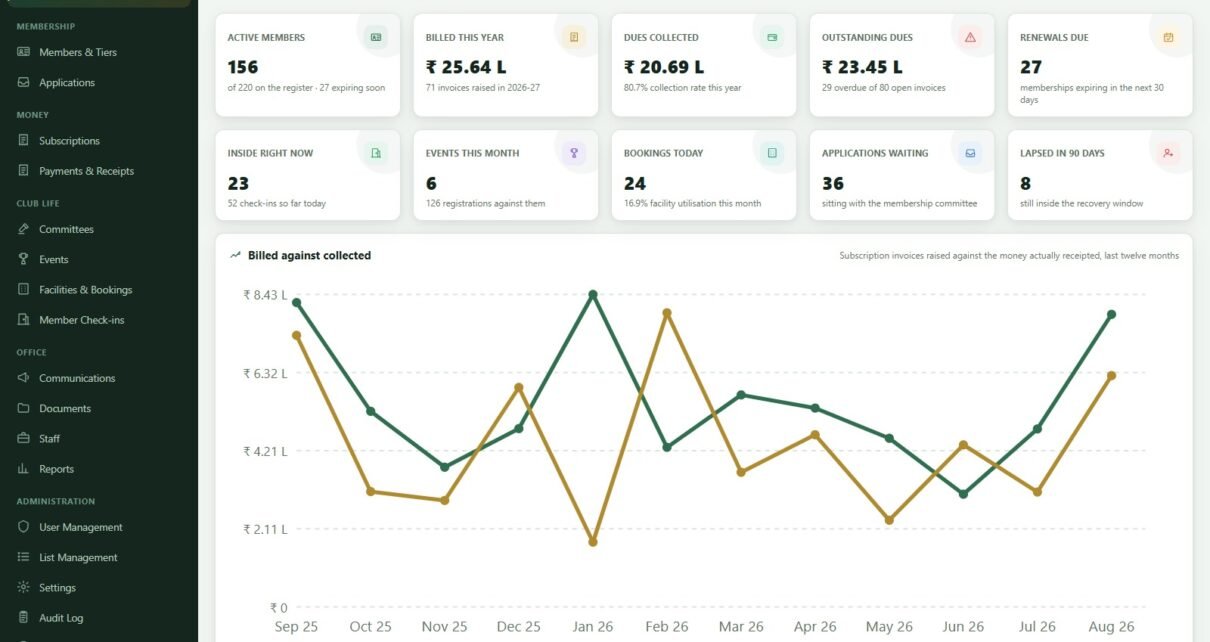
Club & Association Membership Management System Web App
A Google Apps Script web app that runs a whole club, society or association from one place – 220 members on 8 tiers, 300 dependents, 900 subscription invoices, 1,135 receipts, 80 events, 1,750 facility bookings and 10 minuted committees seeded on first run, across 19 pages, 17 reports and 6 server-checked roles. Self-hosted in your own Google account, with a live demo you can sign into right now.
Flooring Installation KPI Dashboard in Google Sheets
Track 15 flooring installation KPIs in Google Sheets – jobs, square feet, margin, crew productivity, rework, waste and lead time – with MTD and YTD achievement, traffic lights, a 12-month trend page and a group analysis page, all driven by one month dropdown.
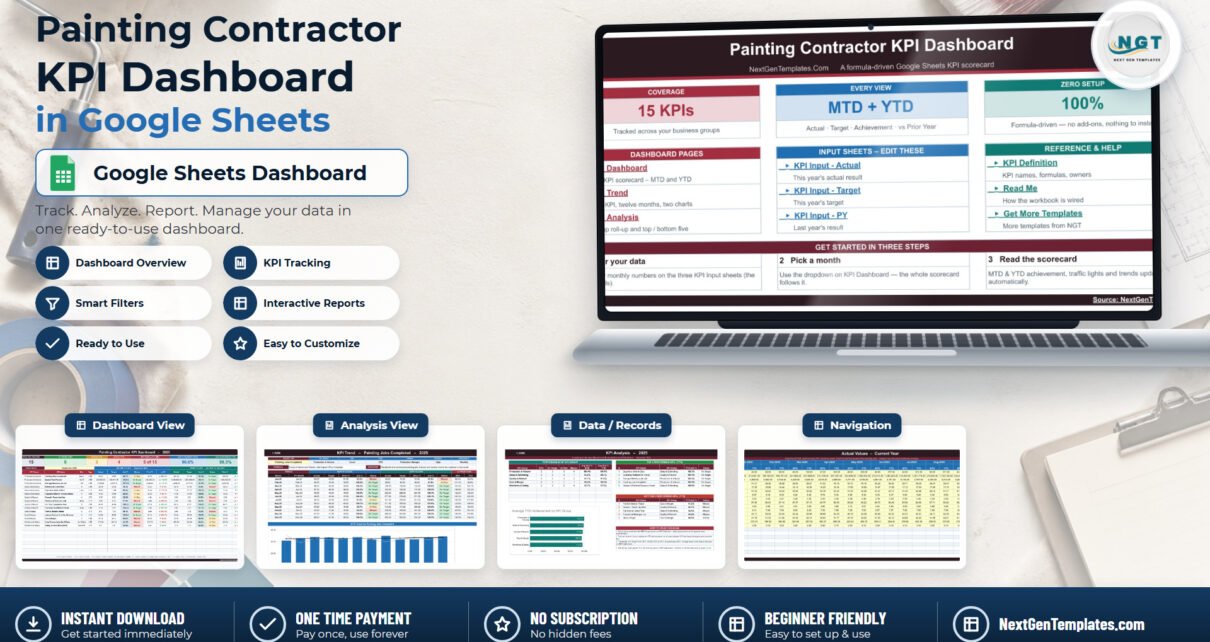
Painting Contractor KPI Dashboard in Google Sheets
Track 15 painting contractor KPIs in Google Sheets with MTD and YTD achievement, prior-year comparison and traffic-light status. One month dropdown drives the scorecard, the KPI Trend page and the group analysis – formula-driven, nothing to install.
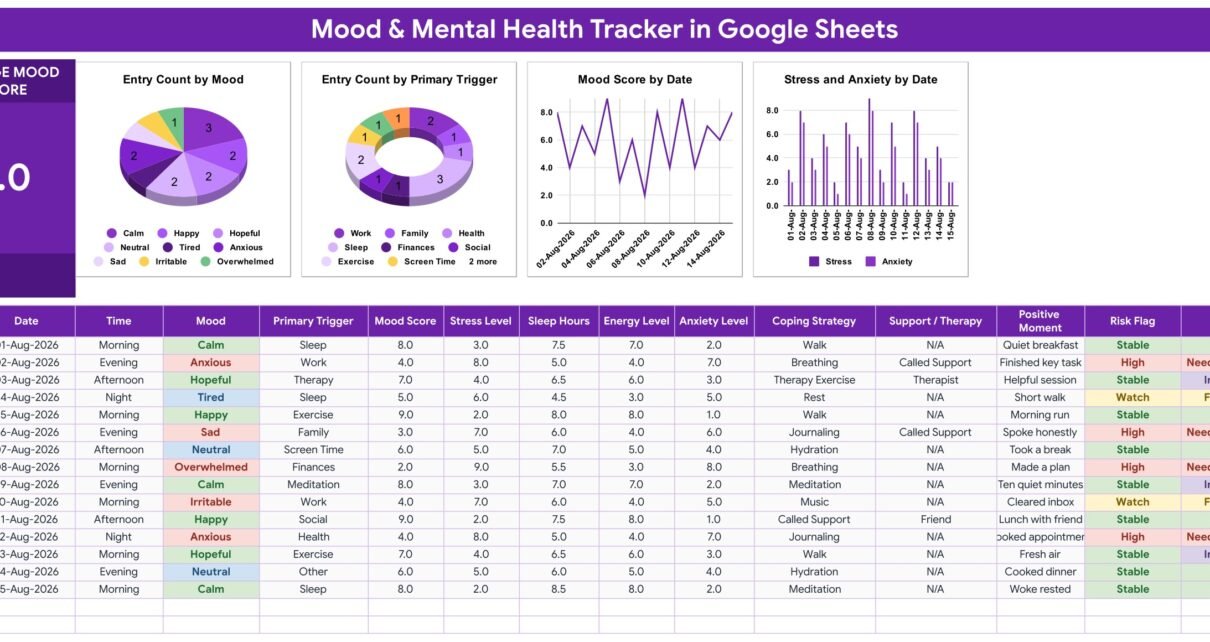
Mood & Mental Health Tracker in Google Sheets
One Google Sheet with 15 columns per check-in, four dropdowns from a single List tab, two self-filling formula columns, an Average Mood Score card and four live charts for logging mood, triggers, sleep, stress and anxiety. A personal log – not a medical device, not diagnostic, and not a substitute for professional care.