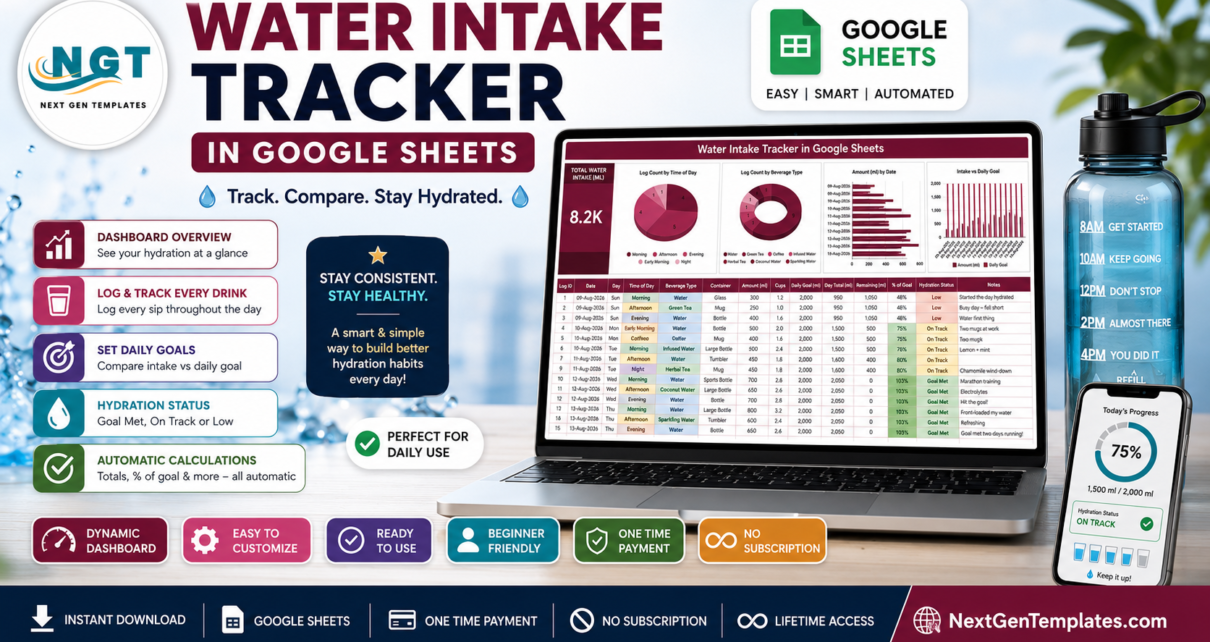
A full walkthrough of the Water Intake Tracker in Google Sheets – the one-page drink log, its four charts, the seven formula columns, and how to set it up in about five minutes. A logging and charting tool, not medical advice.
Online Tutorial for Data Analysis and Automation
A full walkthrough of the Water Intake Tracker in Google Sheets – the one-page drink log, its four charts, the seven formula columns, and how to set it up in about five minutes. A logging and charting tool, not medical advice.
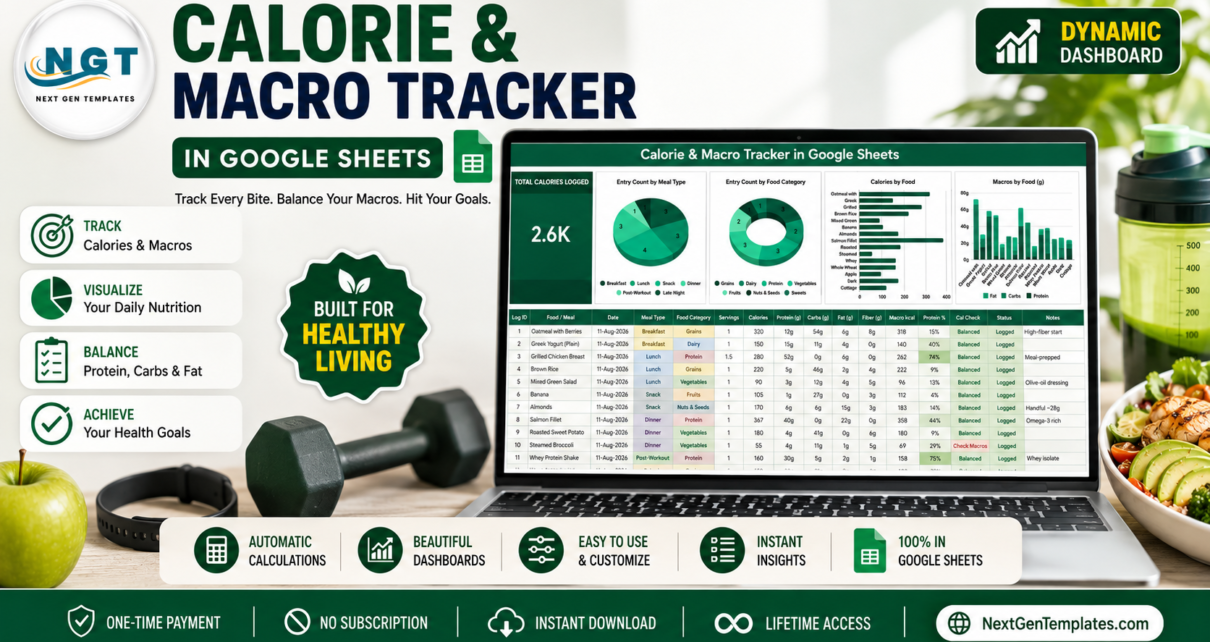
A one-page Calorie & Macro Tracker in Google Sheets: log food, servings, calories, protein, carbs, fat and fiber in a 16-column table while a Total Calories Logged card and four live charts redraw underneath. Logging tool only – not medical or nutritional advice.
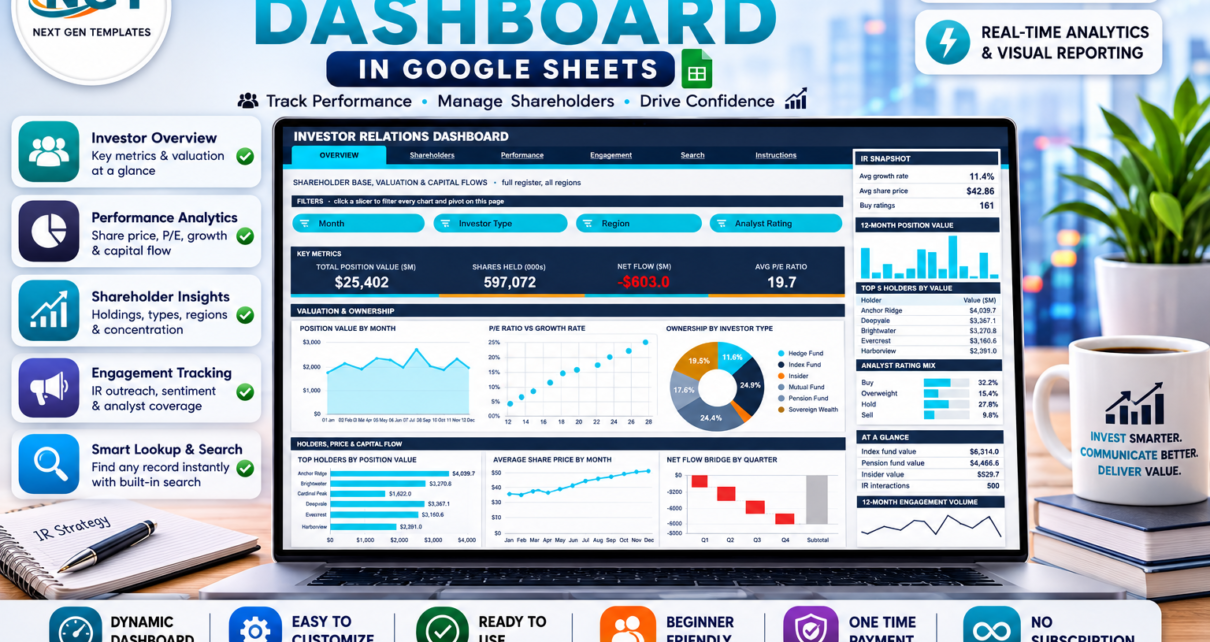
A six-page Investor Relations Dashboard in Google Sheets built on native pivot tables and 15 slicers. Track your shareholder register, share price, capital flows and IR meetings in one file – a reporting tool only, with demo data you replace with your own.
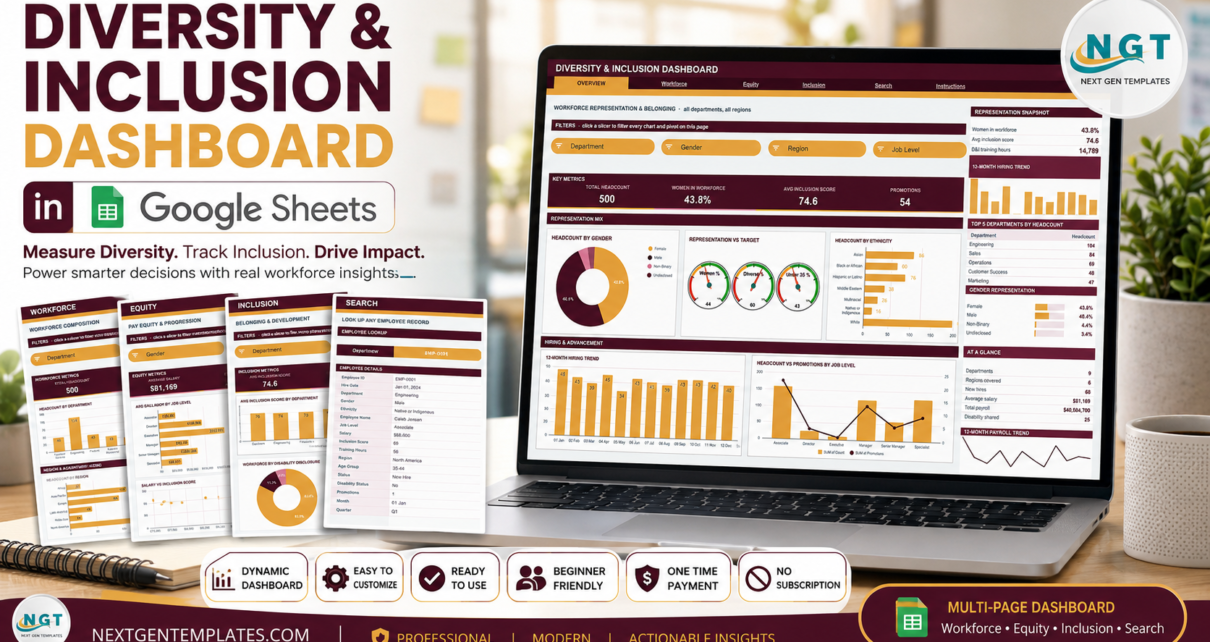
A six-tab Google Sheets workbook that charts workforce representation, pay and inclusion-survey scores from 500 sample employee records using native pivot tables and 16 slicers. A reporting tool only – it charts what you enter and gives no HR or legal advice.
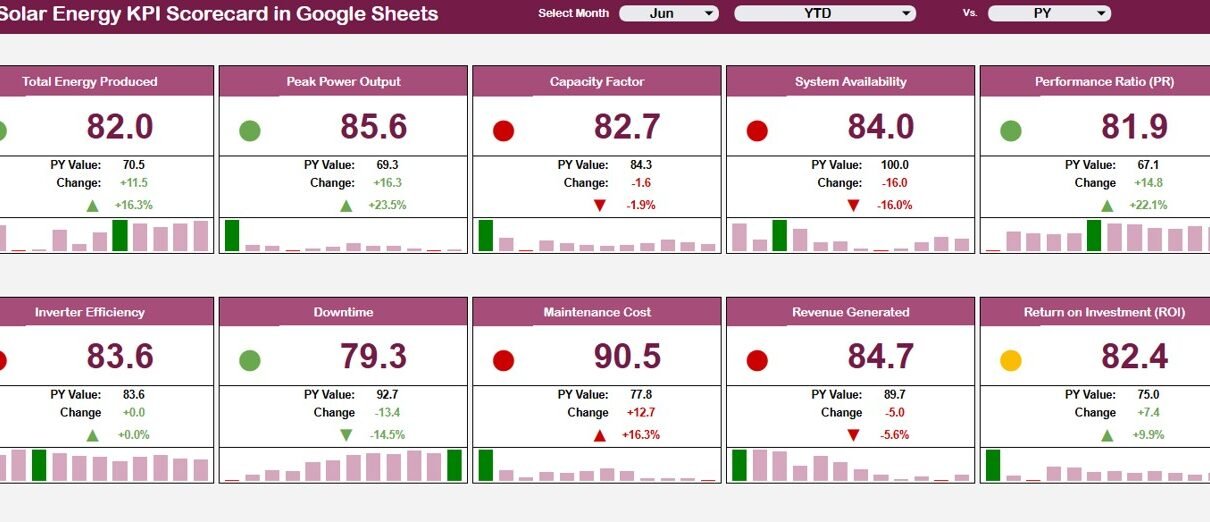
Review the Solar Energy KPI Scorecard in Google Sheets, a practical template for tracking solar production, availability, performance ratio, downtime, maintenance cost, revenue, and ROI.
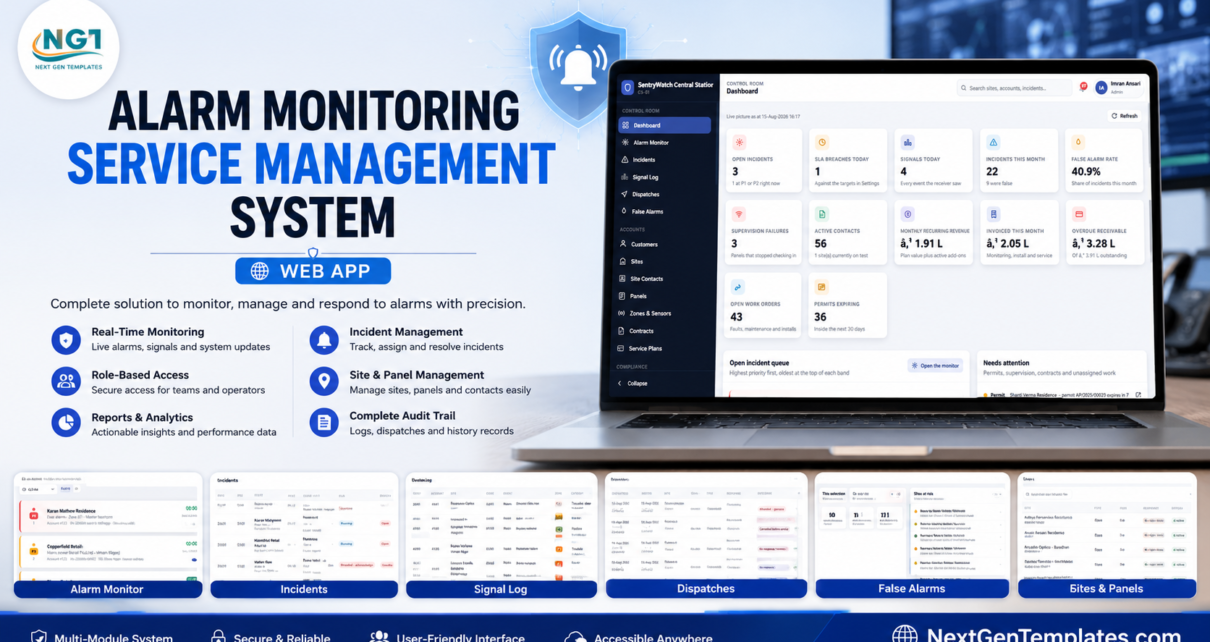
A complete alarm monitoring and central station management system built on Google Apps Script and Google Sheets – live alarm monitor with SLA countdowns, keyholder calls, authority dispatch, a false alarm register with fines, contracts and recurring revenue, a one-pass monthly billing run, and the whole service side. Seeded with 60 customers, 85 sites, 85 panels and six months of history, with nine logins across seven roles and a live demo you can sign into now.
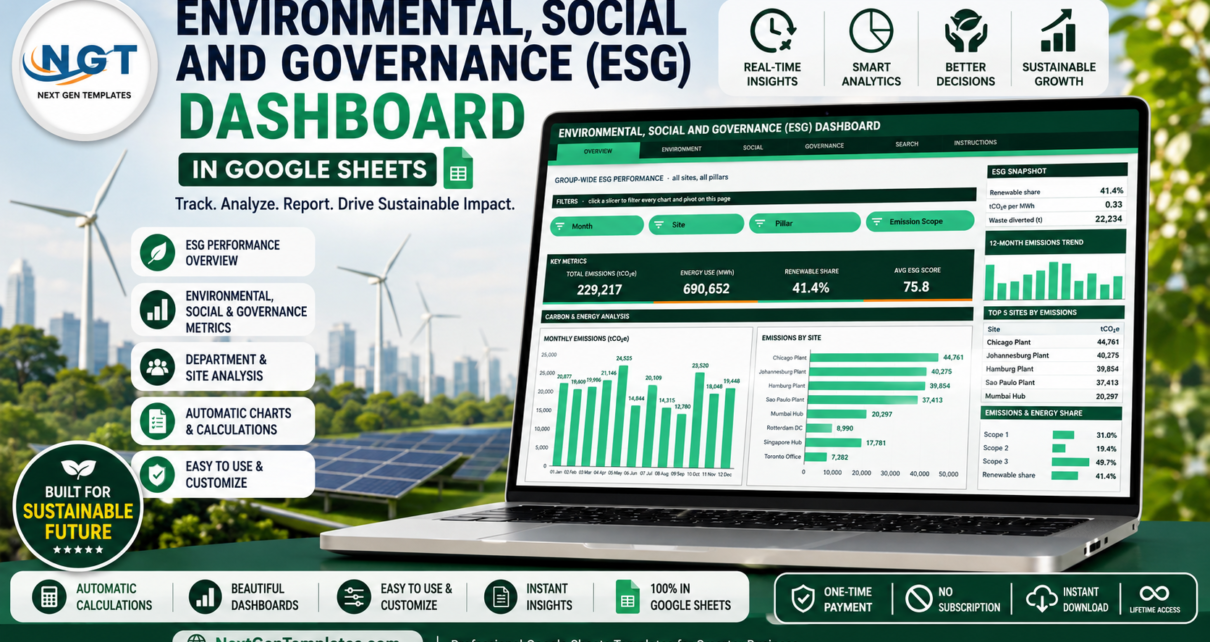
A six-page ESG tracking and reporting dashboard built on native Google Sheets pivot tables and slicers – Environment, Social and Governance each get their own page, plus a record lookup and a built-in user guide.
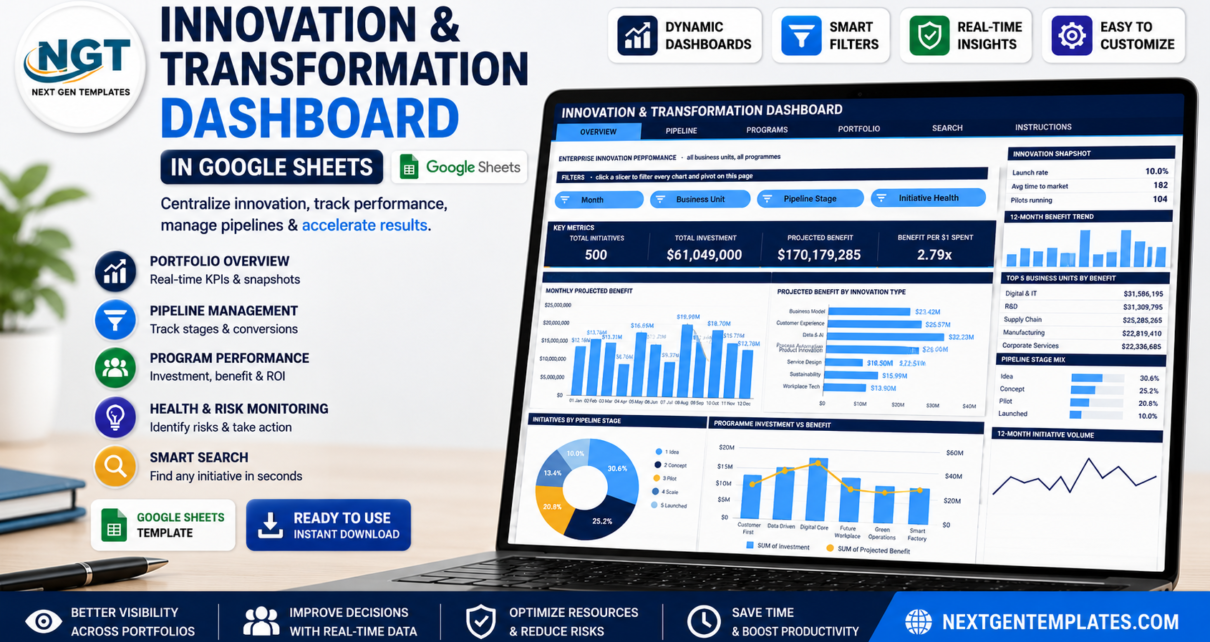
A six-tab Google Sheets dashboard that tracks 500 innovation initiatives, $61,049,000 of investment and $170,179,285 of projected benefit across a five-stage pipeline – built entirely on native pivot tables and slicers.
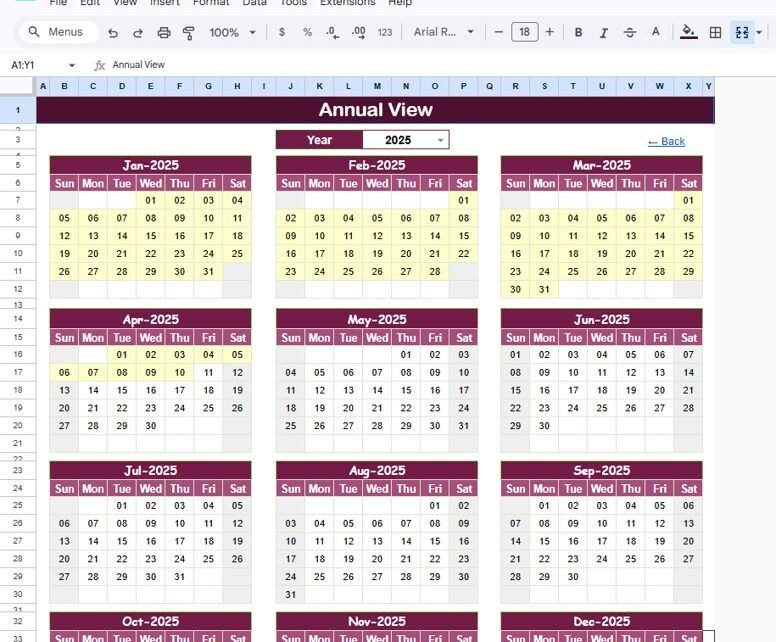
Plan open houses, property tours, auctions, and investor meetings with a 5-sheet Google Sheets calendar template for real estate teams.
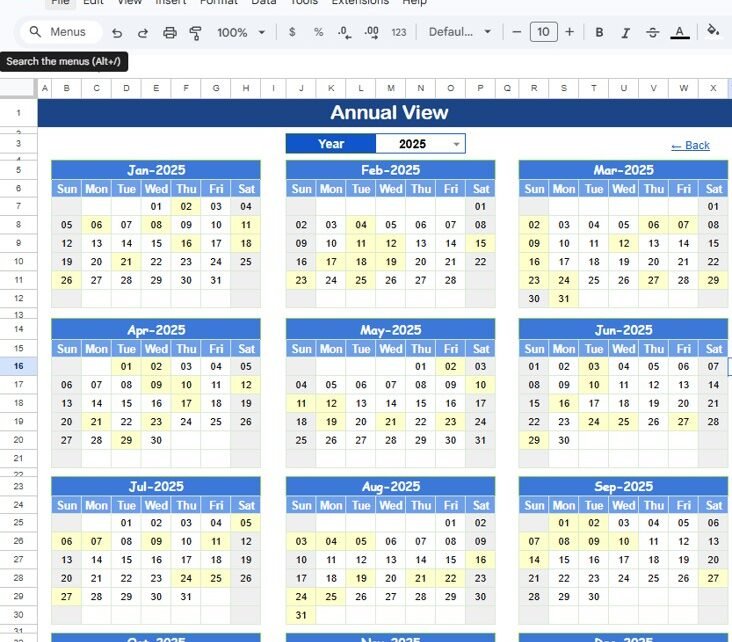
Plan CSR events, sustainability campaigns, volunteering days, and awareness programs in one shared Google Sheets calendar template.