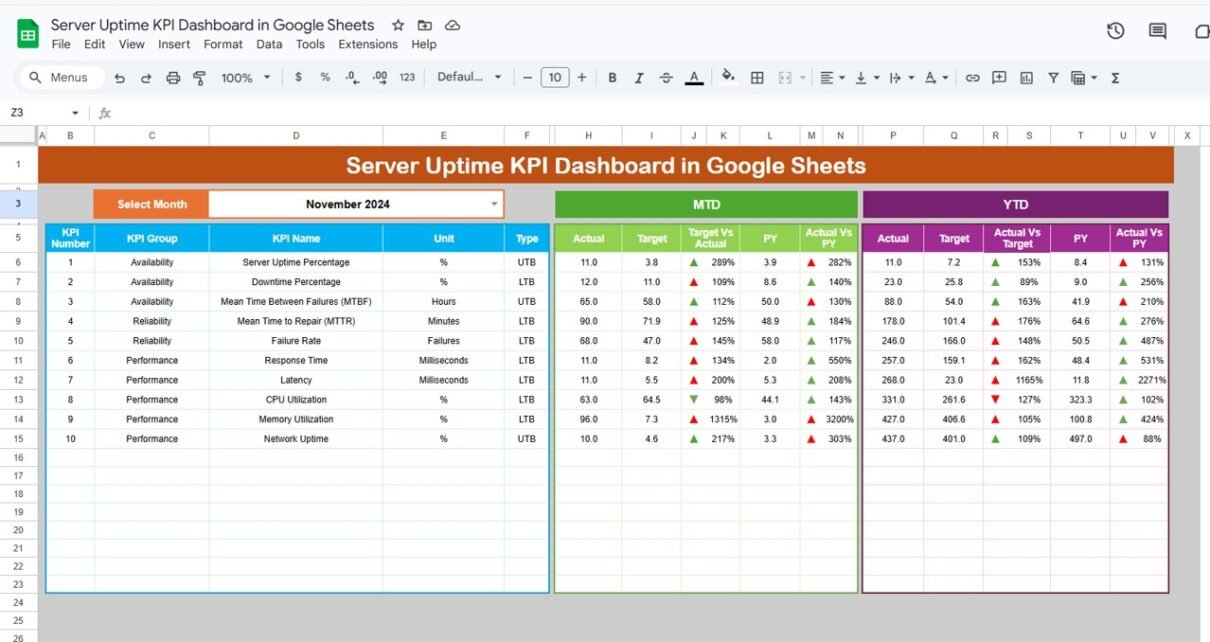
In today’s digital-first world, businesses depend heavily on servers and IT infrastructure. Whether you run a website, SaaS platform, or enterprise system, server uptime directly impacts performance, revenue, and user experience. However, when organizations fail to track uptime metrics properly, they often face unexpected downtimes, system failures, and customer dissatisfaction. So, how can you effectively […]
Blog
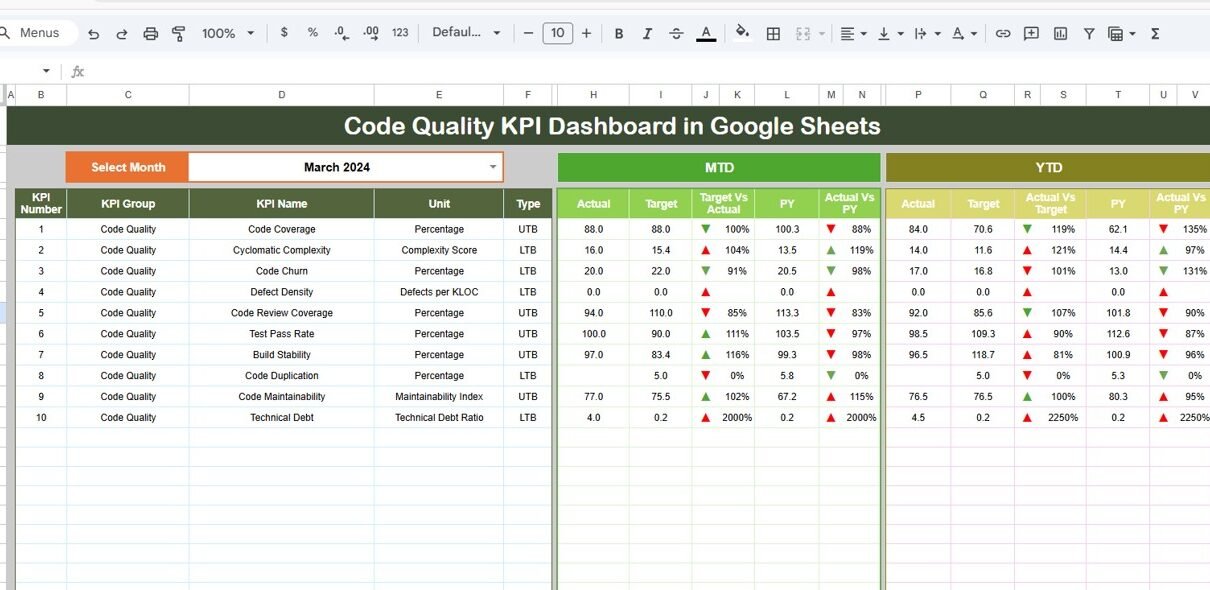
Code Quality KPI Dashboard in Google Sheets
A six-sheet Code Quality KPI Dashboard in Google Sheets that tracks ten KPIs such as Code Coverage, Defect Density and Technical Debt with MTD, YTD, target and previous-year comparisons.
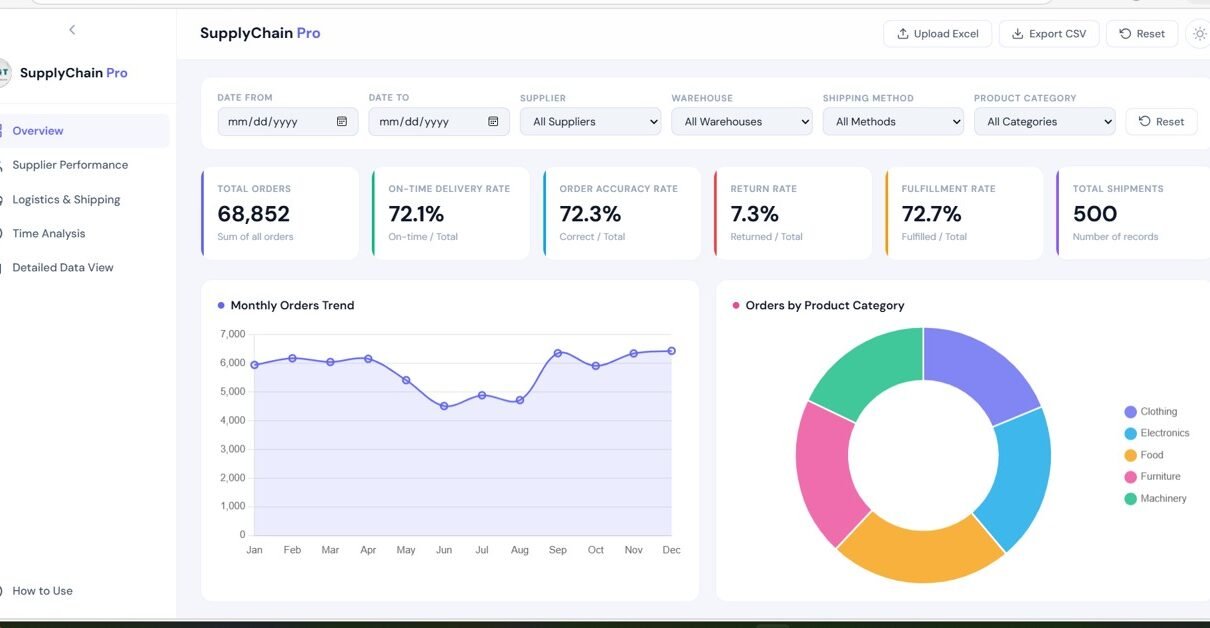
Supply Chain Analytics Dashboard in HTML
In today’s fast-paced business environment, managing supply chain operations efficiently is more important than ever. Companies deal with multiple suppliers, warehouses, shipping methods, and product categories. However, when this data is scattered across spreadsheets, it becomes difficult to gain meaningful insights. That’s exactly where the Supply Chain Analytics Dashboard in HTML comes in. This powerful, […]
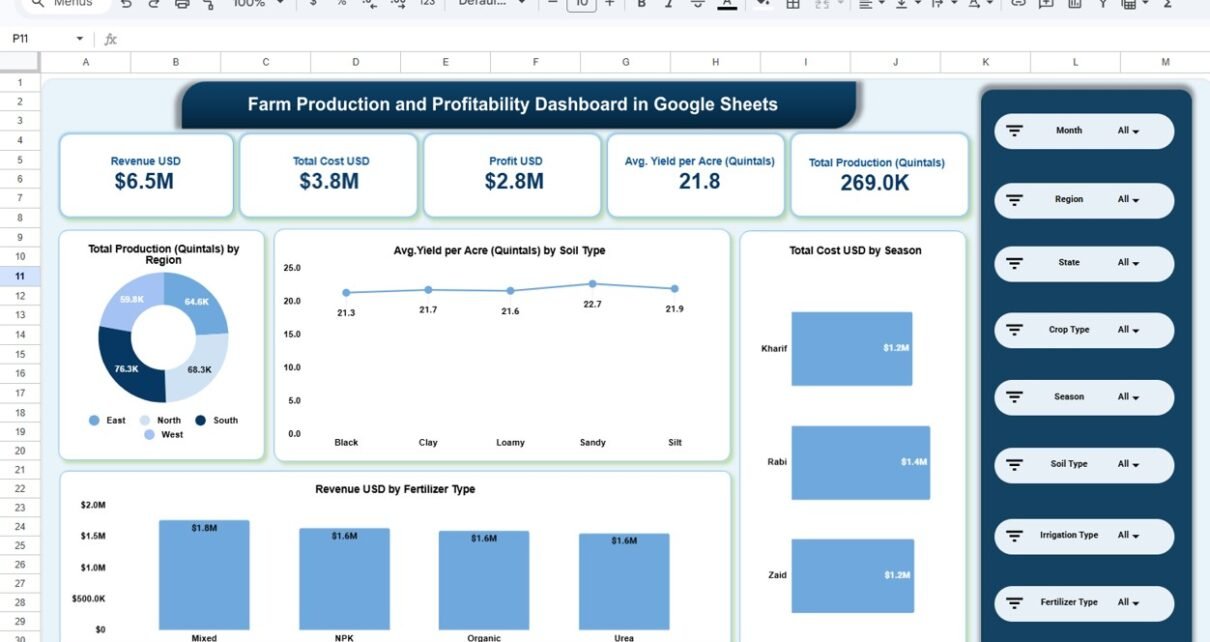
Farm Production and Profitability Dashboard in Google Sheets
A five-page Farm Production and Profitability Dashboard in Google Sheets that tracks revenue, cost, profit, yield per acre and production by region, crop, soil, season, fertilizer and month.
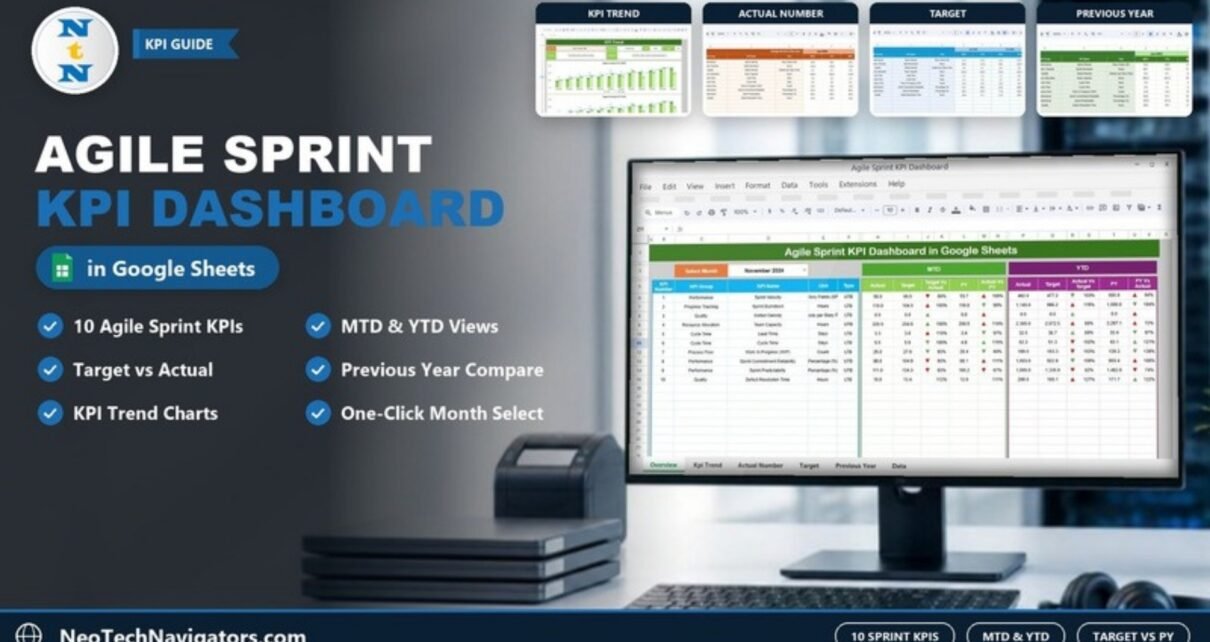
Agile Sprint KPI Dashboard in Google Sheets
A sheet-by-sheet guide to the Agile Sprint KPI Dashboard in Google Sheets: ten sprint KPIs with formulas, MTD and YTD target and previous-year comparison, and steps to load your own data.
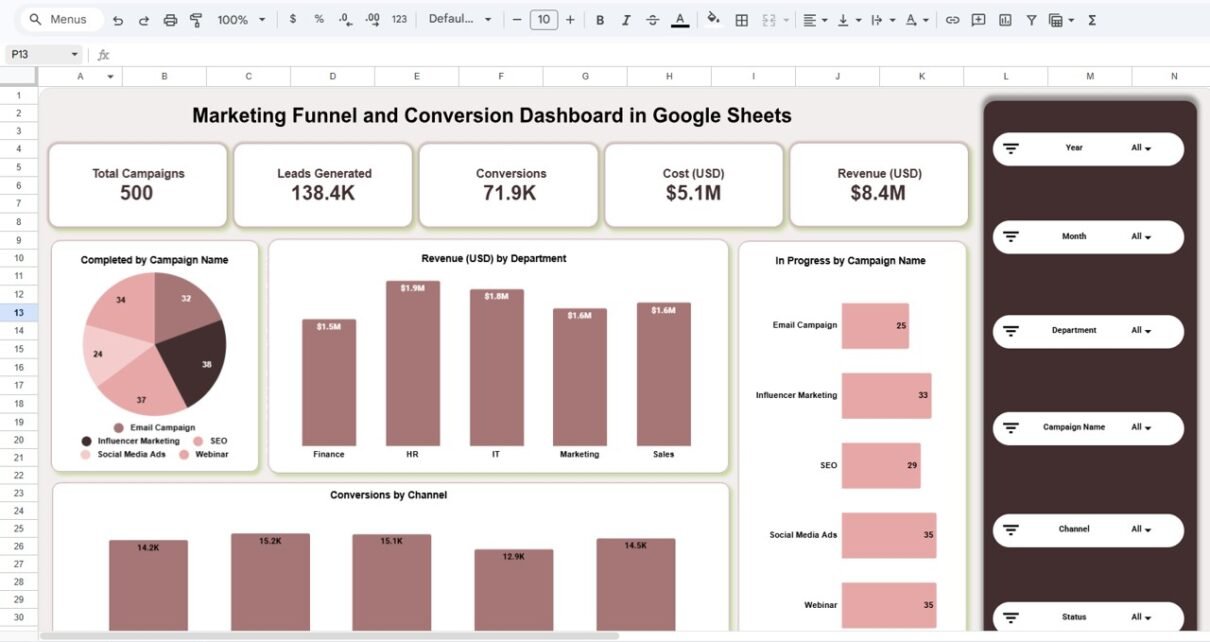
Marketing Funnel and Conversion Dashboard in Google Sheets
In today’s competitive digital landscape, businesses rely heavily on marketing campaigns to generate leads, drive conversions, and increase revenue. However, managing multiple campaigns across different channels can become complex. Many organizations still depend on scattered spreadsheets and manual reports. As a result, they struggle to track performance accurately.Marketing Funnel and Conversion Dashboard in Google Sheets […]
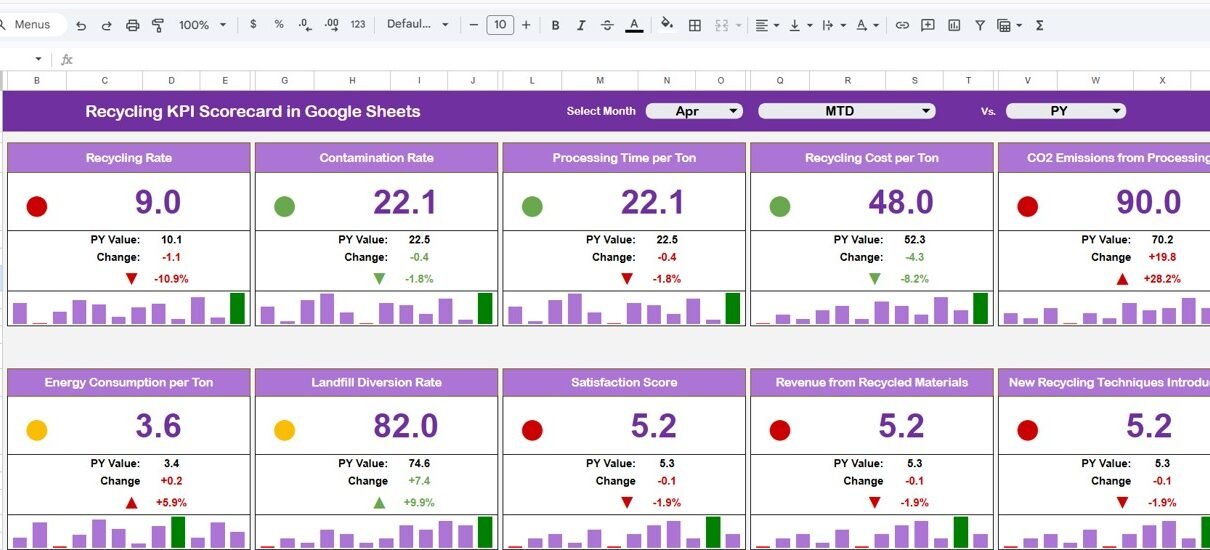
Recycling KPI Scorecard in Google Sheets
In today’s world, sustainability and environmental responsibility play a crucial role in business operations. Organizations, municipalities, and recycling centers must track recycling performance to ensure efficient waste management and environmental compliance. However, many organizations still rely on manual reports and scattered spreadsheets. As a result, they struggle to measure recycling efficiency and identify improvement areas. […]
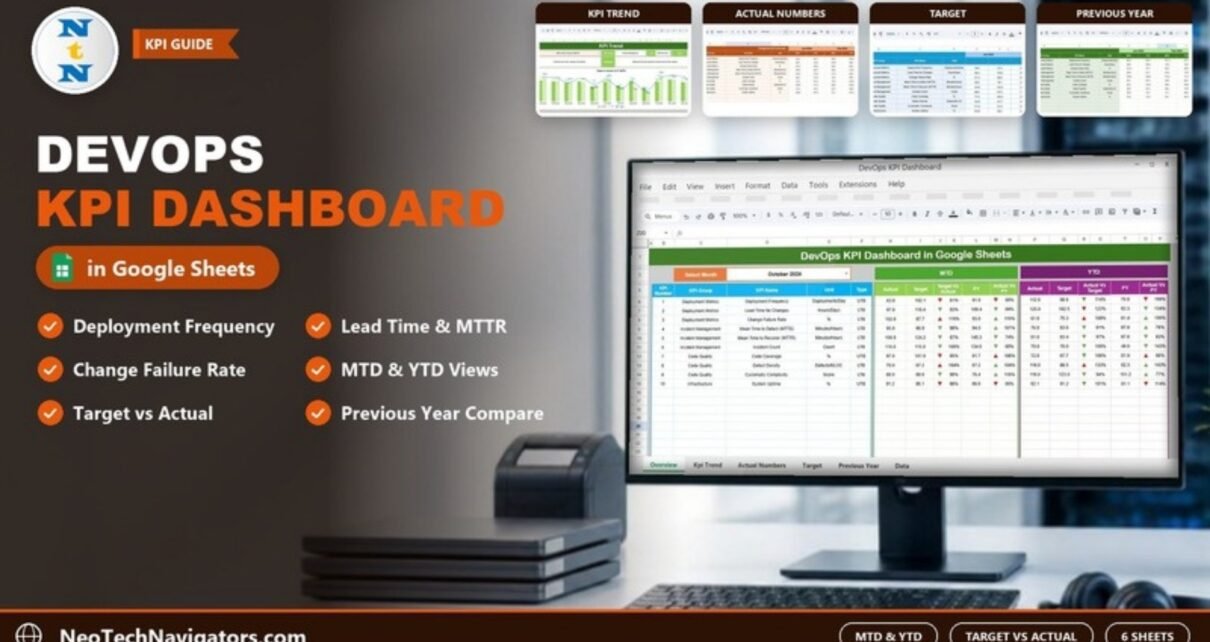
DevOps KPI Dashboard in Google Sheets
A practical guide to the DevOps KPI Dashboard in Google Sheets: 10 DevOps KPIs across deployment, incident management, code quality and infrastructure, MTD/YTD actual vs target and previous year, a KPI Trend sheet and step-by-step setup.
Contract Expiry and Compliance Dashboard in Google Sheets
Managing contracts is a critical responsibility for every organization. Businesses sign hundreds or even thousands of contracts with vendors, partners, employees, and clients. These agreements include expiration dates, renewal terms, compliance requirements, approval workflows, and financial commitments. However, many organizations still track contracts manually through scattered spreadsheets or emails. As a result, companies often miss […]
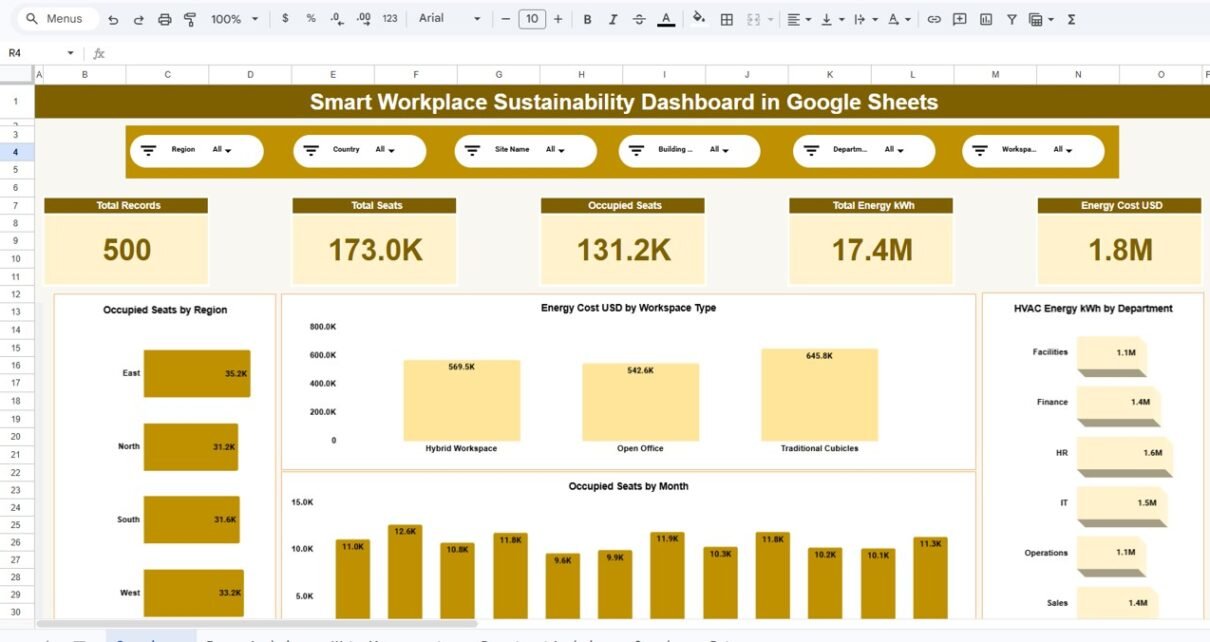
Smart Workplace Sustainability Dashboard in Google Sheets
Sustainability has become a major priority for modern organizations. Companies now focus on reducing environmental impact, optimizing energy consumption, managing water usage, and improving workspace efficiency. However, managing sustainability across multiple offices, departments, and facilities can become complex without proper analytics tools. Many organizations still rely on scattered spreadsheets and manual reports to track sustainability […]