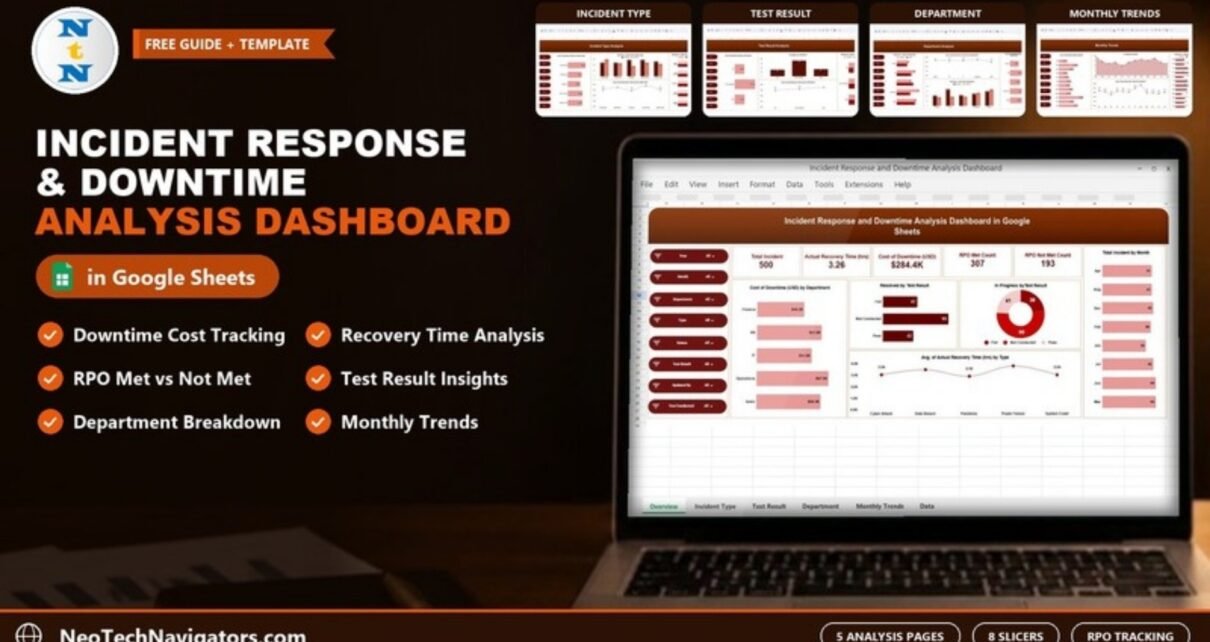
A page-by-page guide to the Incident Response and Downtime Analysis Dashboard in Google Sheets: incidents, recovery time, downtime cost and RPO results by type, test result, department and month.
Online Tutorial for Data Analysis and Automation
A page-by-page guide to the Incident Response and Downtime Analysis Dashboard in Google Sheets: incidents, recovery time, downtime cost and RPO results by type, test result, department and month.
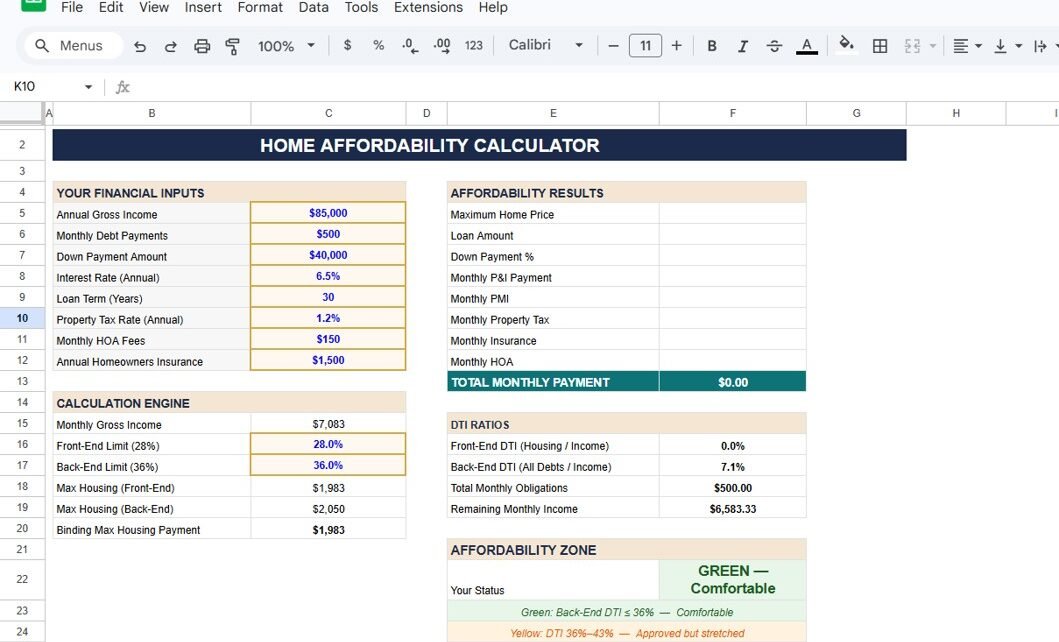
Buying a home is one of the biggest financial decisions you will ever make. However, many people struggle to understand how much house they can truly afford. Without proper calculations, you may either overspend or miss better opportunities.Home Affordability Calculator in Google Sheets So, how can you confidently determine your home budget, monthly payments, and […]
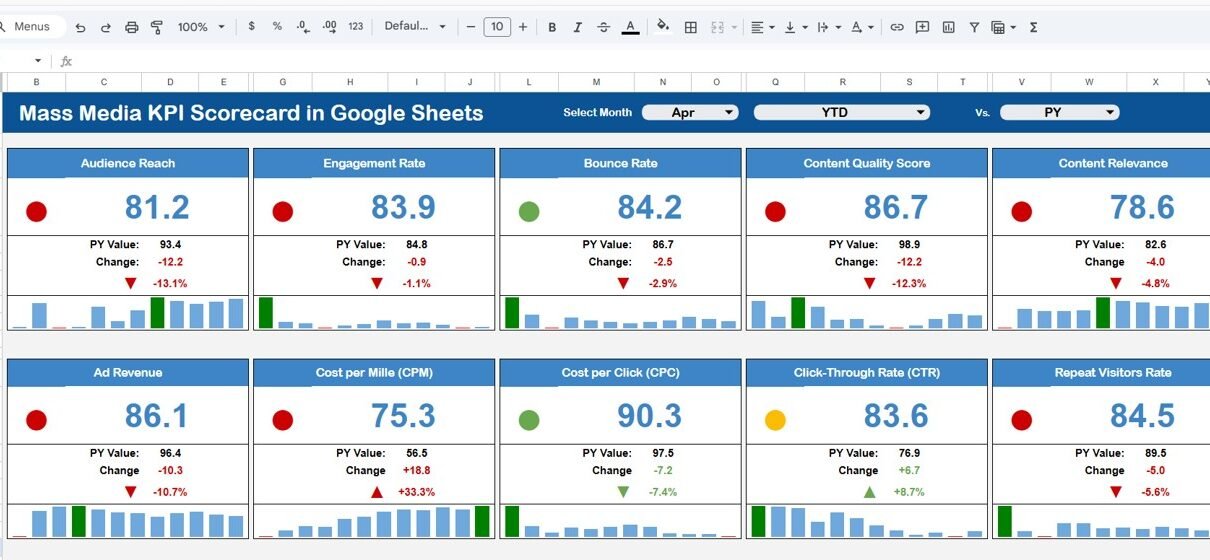
In today’s fast-paced media industry, tracking performance is more important than ever. Whether you manage digital campaigns, television broadcasting, radio channels, or online media platforms, you deal with massive amounts of performance data daily. However, when this data is scattered across multiple sheets, it becomes difficult to analyze trends and make informed decisions.Mass Media KPI […]
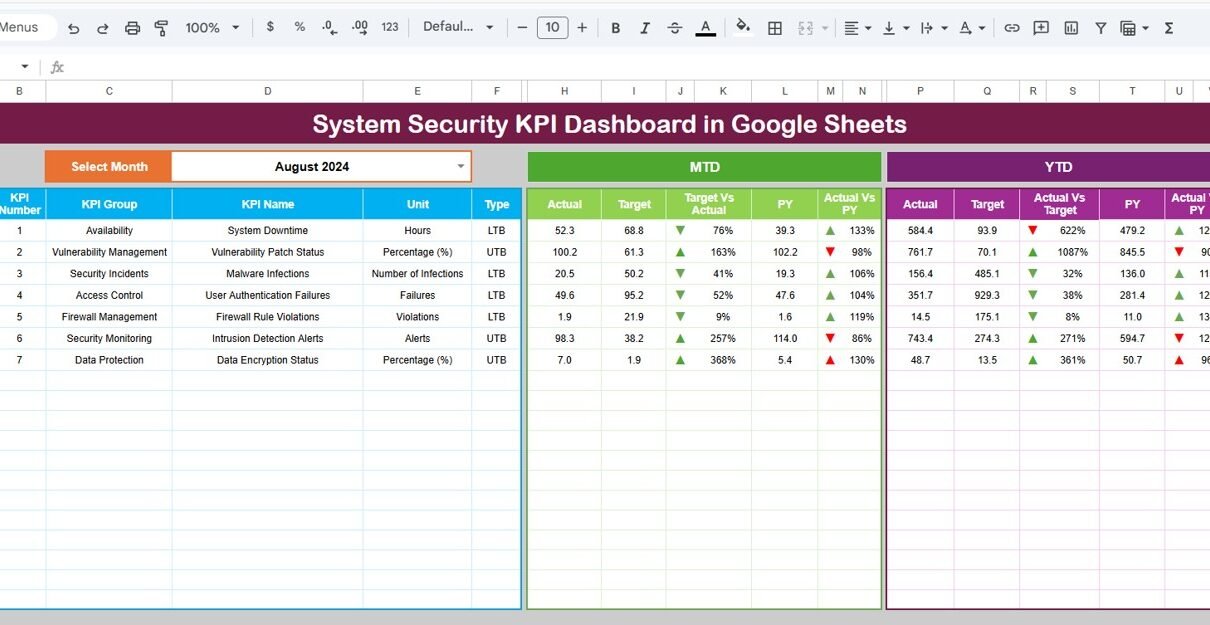
In today’s digital world, system security has become more important than ever. Organizations face constant threats such as cyberattacks, data breaches, and unauthorized access. However, many companies struggle to track their security performance effectively because their data remains scattered across multiple tools and reports.System Security KPI Dashboard in Google Sheets So, how can you monitor […]
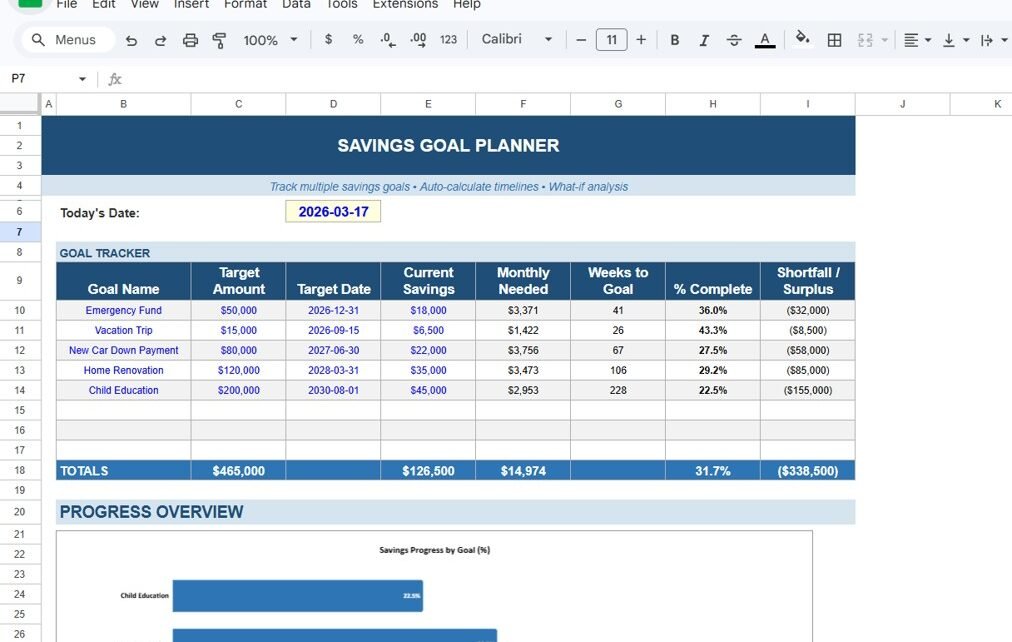
A Savings Goal Planner in Google Sheets that turns each goal into a monthly amount, weeks left, % complete and shortfall, with totals and a progress chart for all your goals.
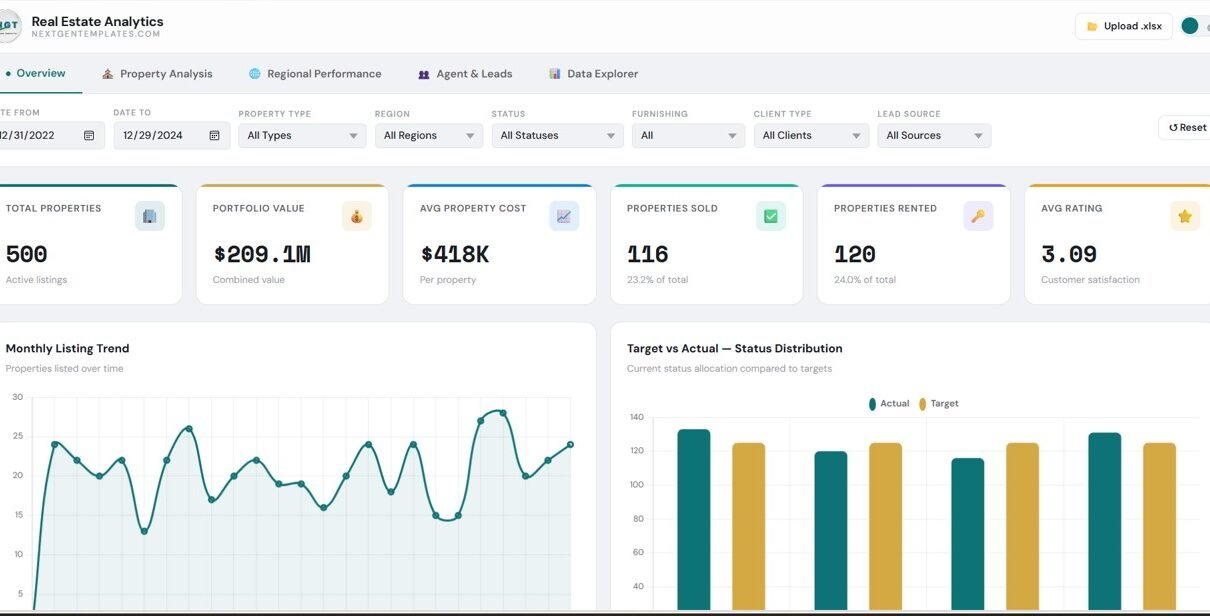
In today’s fast-paced real estate industry, data plays a critical role in decision-making. From tracking property listings and analyzing regional performance to managing agents and monitoring leads, businesses handle large volumes of data daily. However, when this data stays scattered across spreadsheets, it becomes difficult to analyze and act quickly. So, how can real estate […]
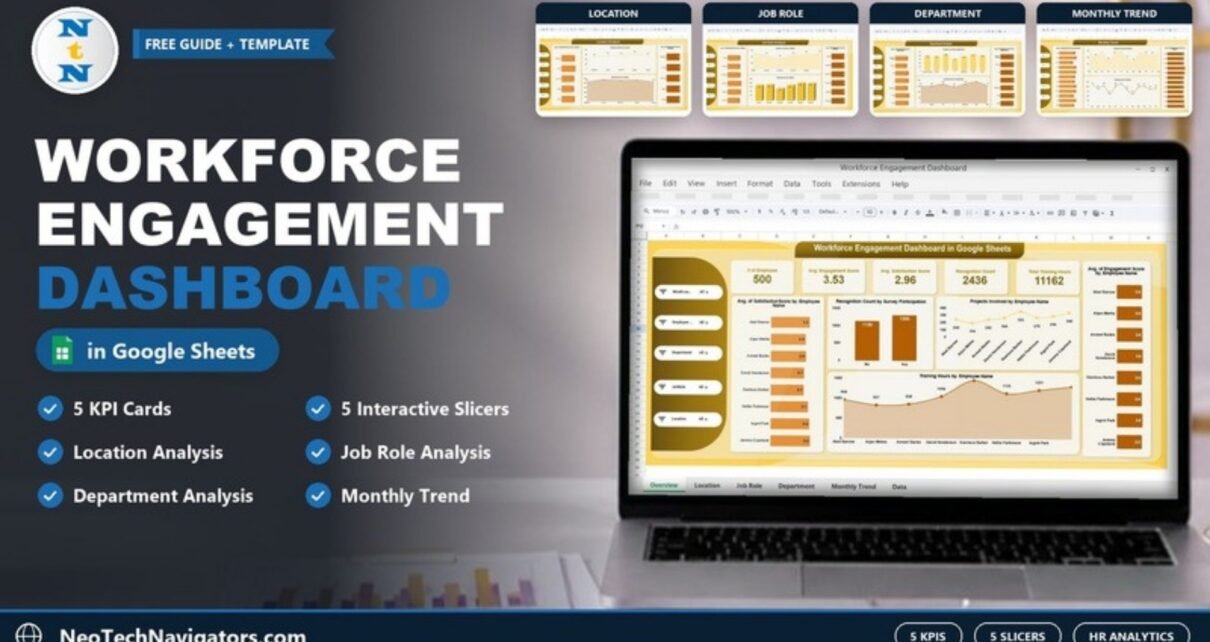
A practical guide to the Workforce Engagement Dashboard in Google Sheets: five KPI cards, five slicers and analysis pages for location, job role, department and month, all driven by one data sheet.
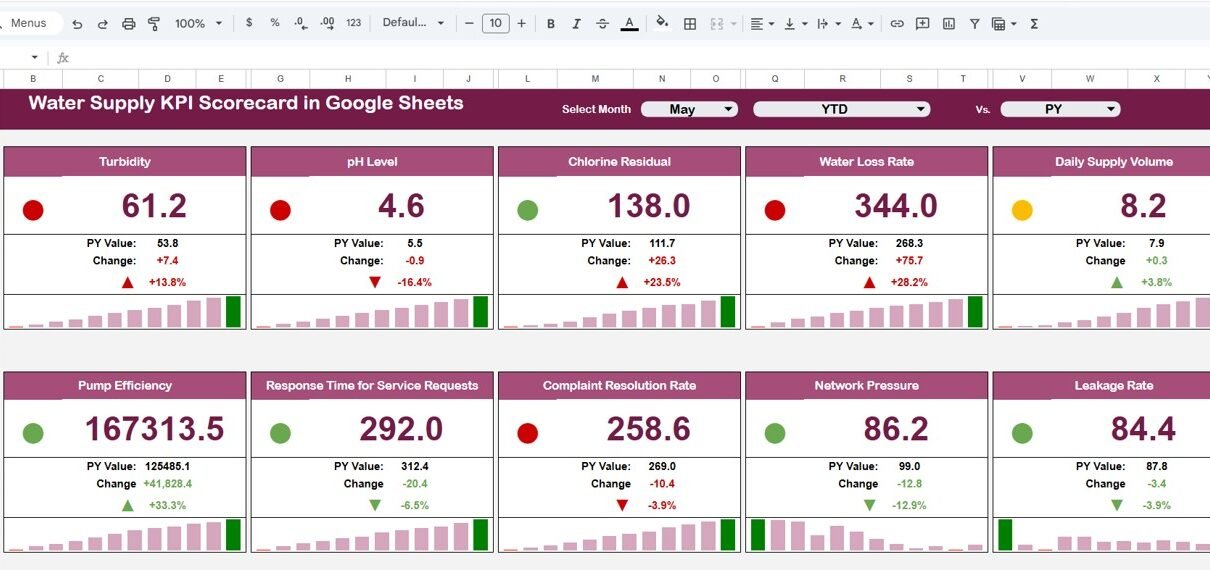
In today’s fast-growing urban environment, managing water supply efficiently becomes more important than ever. Municipal authorities, utility companies, and infrastructure teams handle massive amounts of operational data daily. However, when this data remains scattered, it becomes difficult to track performance and make timely decisions.Water Supply KPI Scorecard in Google Sheets So, how can water supply […]
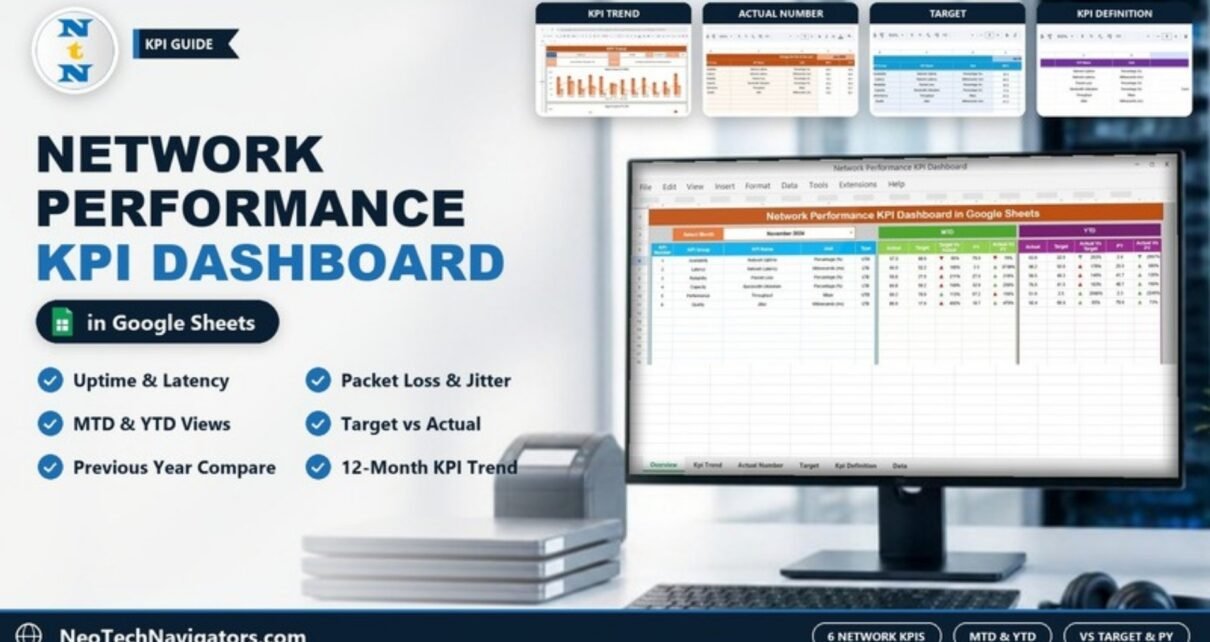
A practical guide to the Network Performance KPI Dashboard in Google Sheets: six KPIs (uptime, latency, packet loss, bandwidth, throughput, jitter) with MTD/YTD, target and previous-year comparisons.
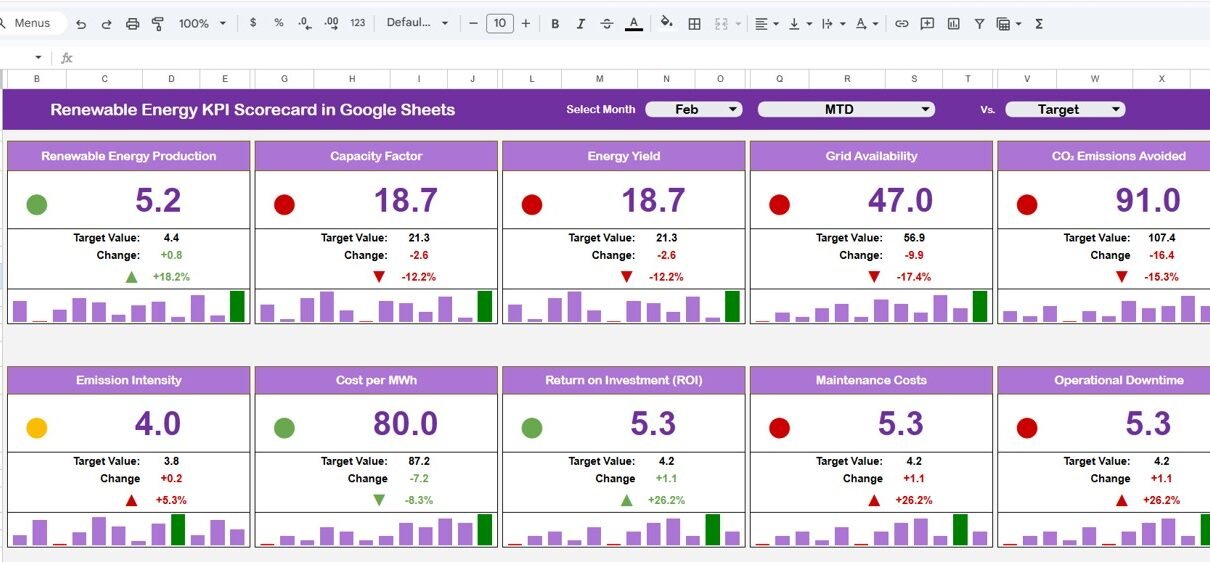
In today’s rapidly evolving Renewable Energy KPI Scorecard in Google Sheets landscape, renewable energy companies must continuously monitor performance to stay competitive. Whether you manage solar farms, wind projects, or hydroelectric plants, tracking key performance indicators (KPIs) plays a crucial role in ensuring efficiency and profitability. However, when organizations rely on scattered spreadsheets or manual […]