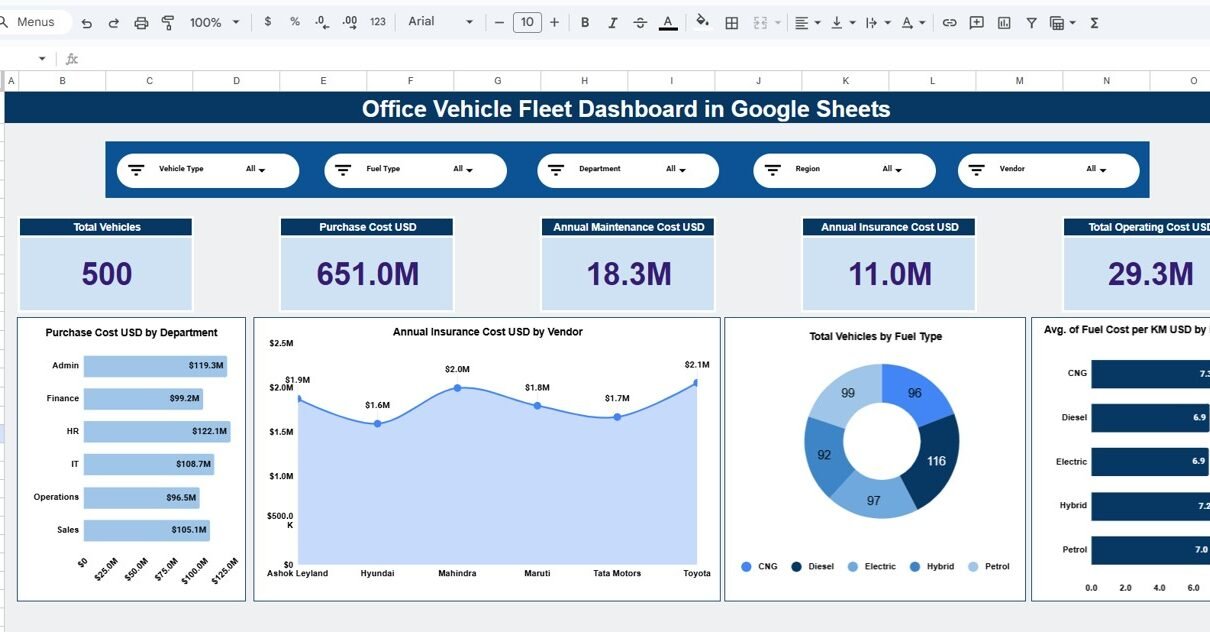
Managing an office vehicle fleet involves tracking multiple cost drivers such as vehicle purchases, fuel expenses, insurance, maintenance, utilization, and downtime. However, when this information is scattered across spreadsheets or manual reports, fleet management becomes inefficient and error-prone.Office Vehicle Fleet Dashboard in Google Sheets That is exactly why the Office Vehicle Fleet Dashboard in Google […]
Dashboard
Google-Sheets-Dashboard
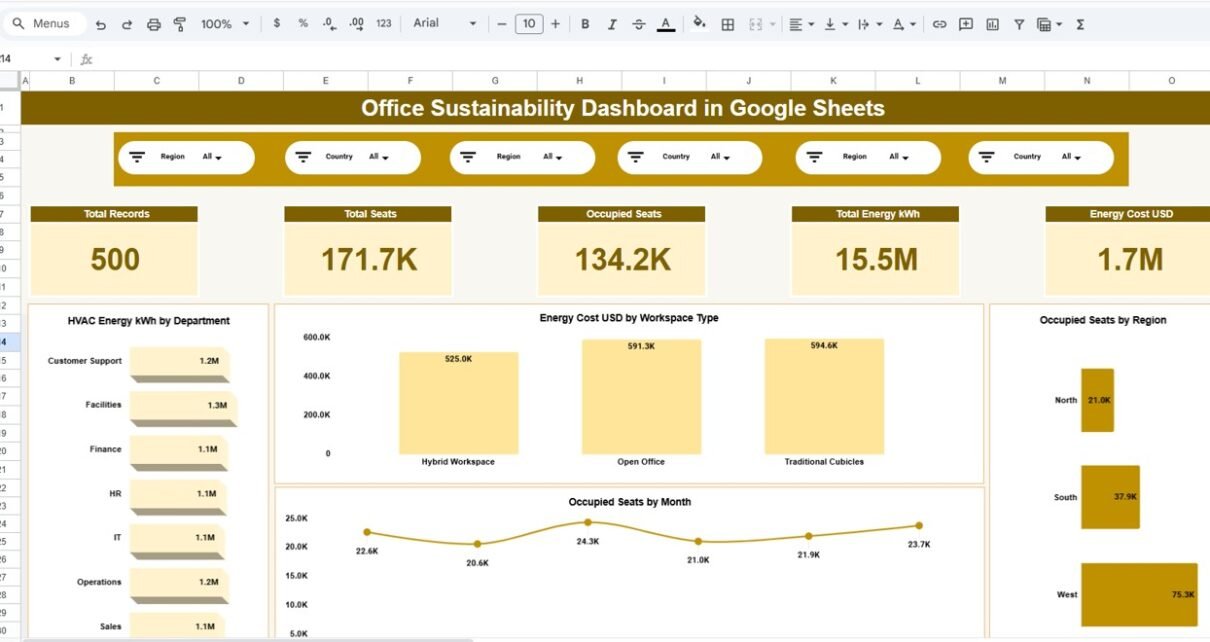
Office Sustainability Dashboard in Google Sheets
Organizations today face increasing pressure to reduce operational costs, optimize workspace utilization, and meet sustainability goals. However, sustainability data often remains scattered across spreadsheets, utility bills, and manual reports. As a result, tracking energy usage, water consumption, occupancy, and environmental impact becomes time-consuming and ineffective. That is exactly why the Office Sustainability Dashboard in Google […]
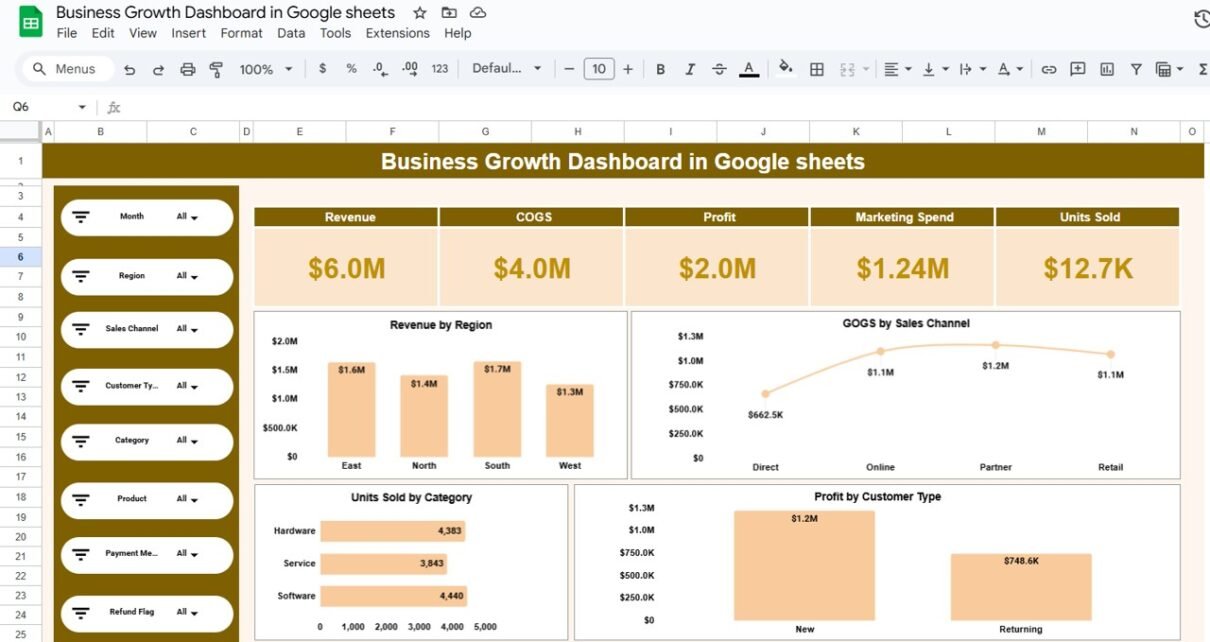
Business Growth Dashboard in Google sheets
Business growth does not happen by chance. It requires clear visibility into revenue, costs, profit, sales channels, and customer behavior. However, many businesses still rely on scattered spreadsheets and manual reports. As a result, decision-making becomes slow and reactive. Therefore, a Business Growth Dashboard in Google Sheets becomes an essential solution. It transforms raw business […]
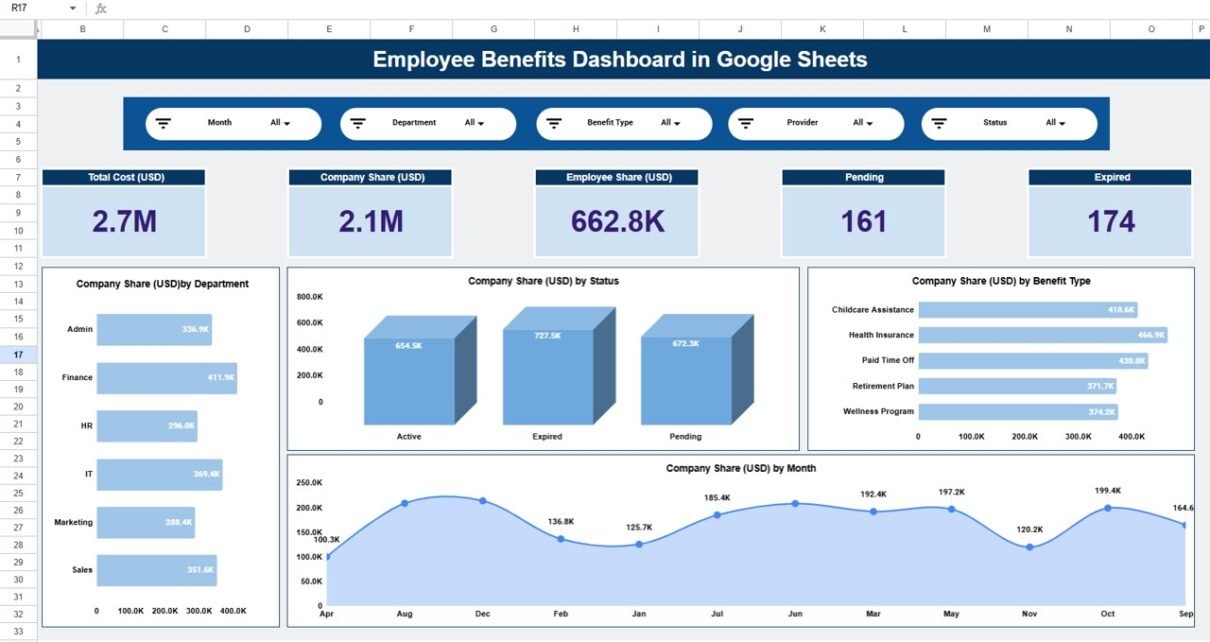
Employee Benefits Dashboard in Google Sheets
Employee benefits play a critical role in attracting, retaining, and motivating talent. However, managing benefits data across departments, providers, benefit types, and months can quickly become complex. Therefore, organizations need a centralized, visual, and easy-to-use system to monitor benefits cost, participation, and trends. The Employee Benefits Dashboard in Google Sheets is a ready-to-use HR analytics […]
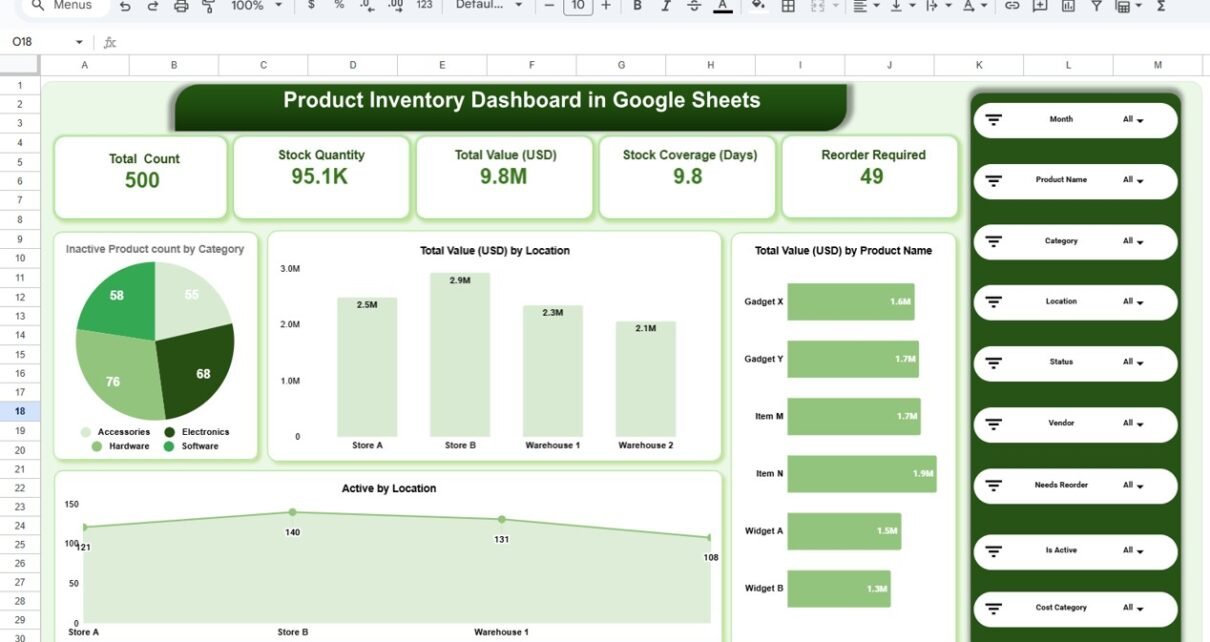
Product Inventory Dashboard in Google Sheets
Managing inventory without clear visibility leads to stockouts, overstocking, and cash flow issues. Therefore, businesses need a simple, visual, and data-driven system to monitor inventory performance. The Product Inventory Dashboard in Google Sheets is a ready-to-use solution that helps you track stock levels, inventory value, reorder requirements, and trends across categories, locations, vendors, and time. […]
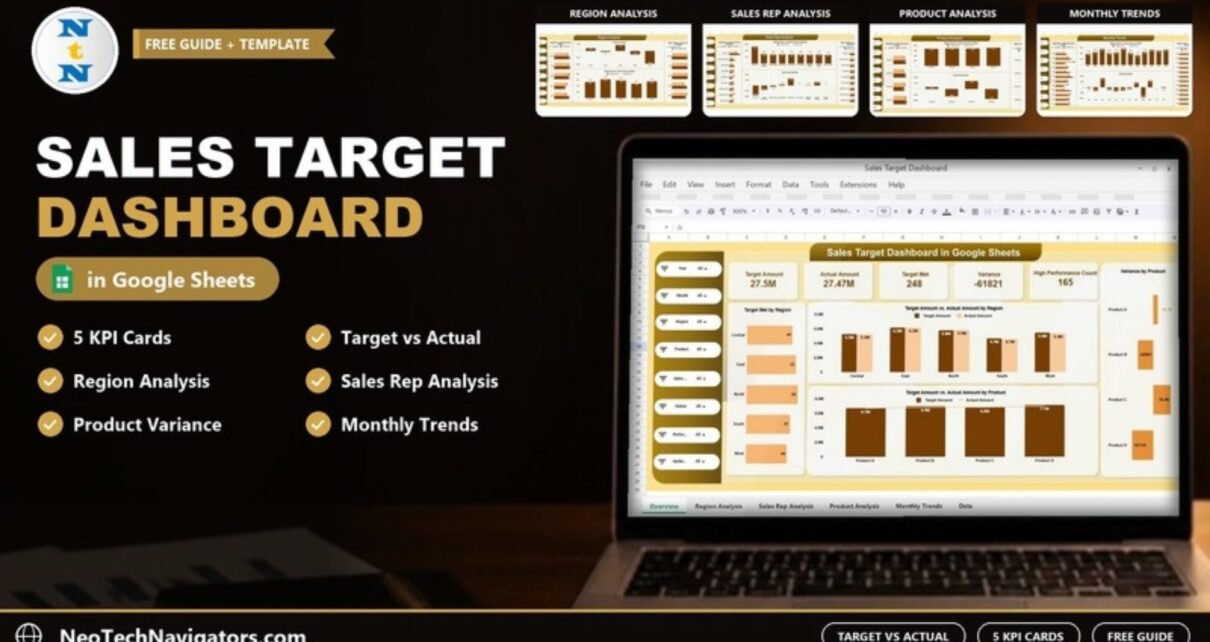
Sales Target Dashboard in Google Sheets: Track Target vs Actual by Region, Rep and Product
A walkthrough of the Sales Target Dashboard in Google Sheets: five KPI cards, region, sales rep, product and monthly analysis pages, the target vs actual formulas behind them, and how to load your own sales data.
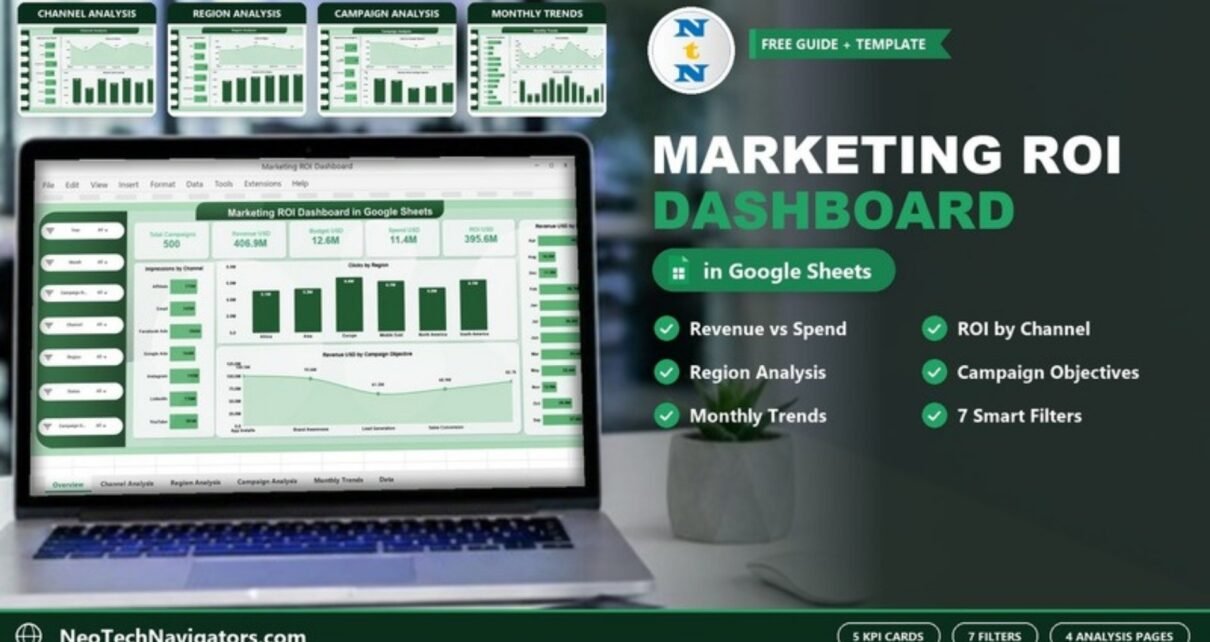
Marketing ROI Dashboard in Google Sheets
A practical guide to the Marketing ROI Dashboard in Google Sheets: five KPI cards, channel, region, campaign objective and monthly analysis pages, seven filters, and how to load your own campaign data.
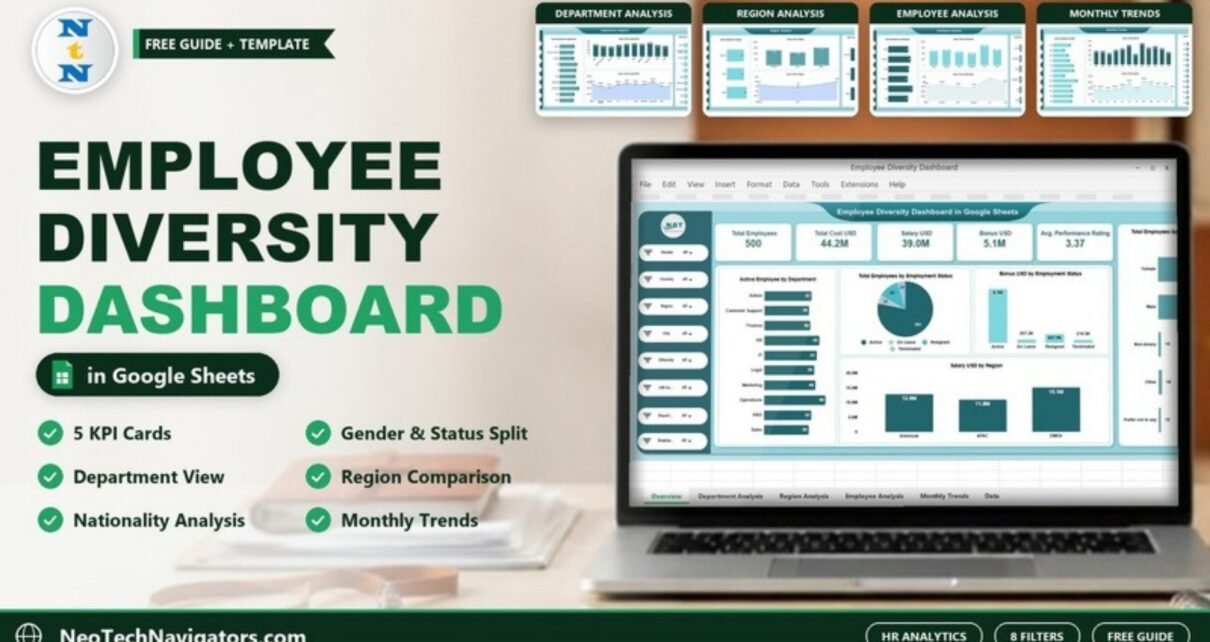
Employee Diversity Dashboard in Google Sheets
A page-by-page guide to the Employee Diversity Dashboard in Google Sheets: KPI cards, gender and employment-status charts, department, region, nationality and monthly views, plus how to load your own HR data.
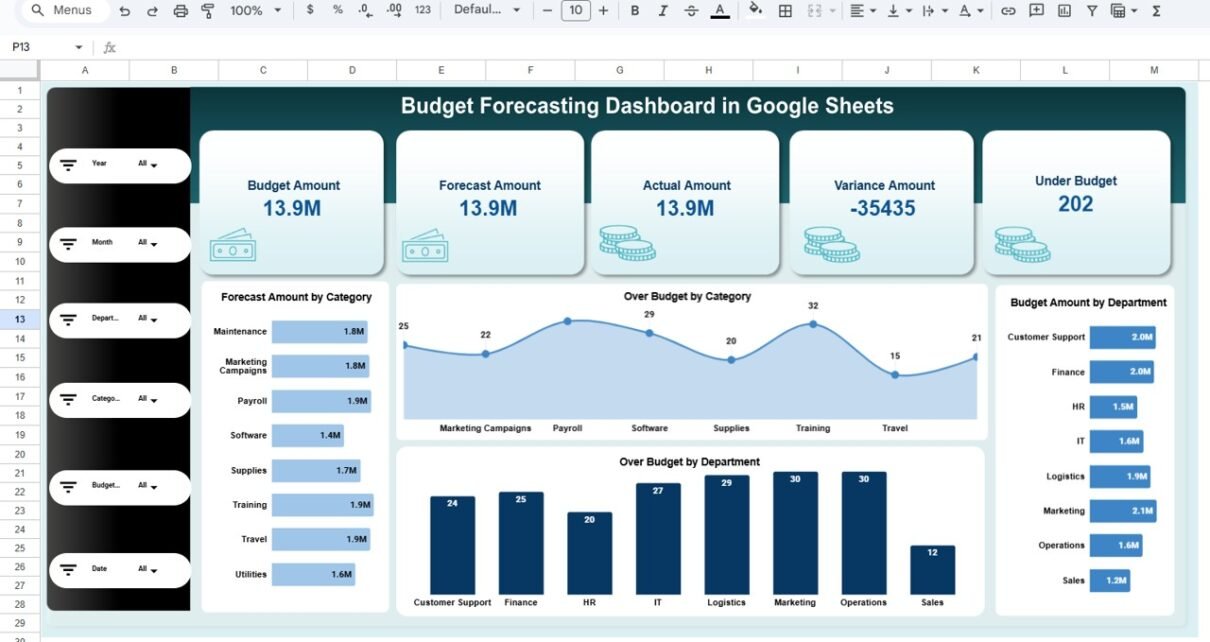
Budget Forecasting Dashboard in Google Sheets
Budget forecasting plays a critical role in financial planning and decision-making. However, many organizations still rely on static spreadsheets that fail to show forecast accuracy, budget overruns, and trends clearly. As a result, leaders struggle to control costs and plan effectively.Budget Forecasting Dashboard in Google Sheets That is exactly why a Budget Forecasting Dashboard in […]
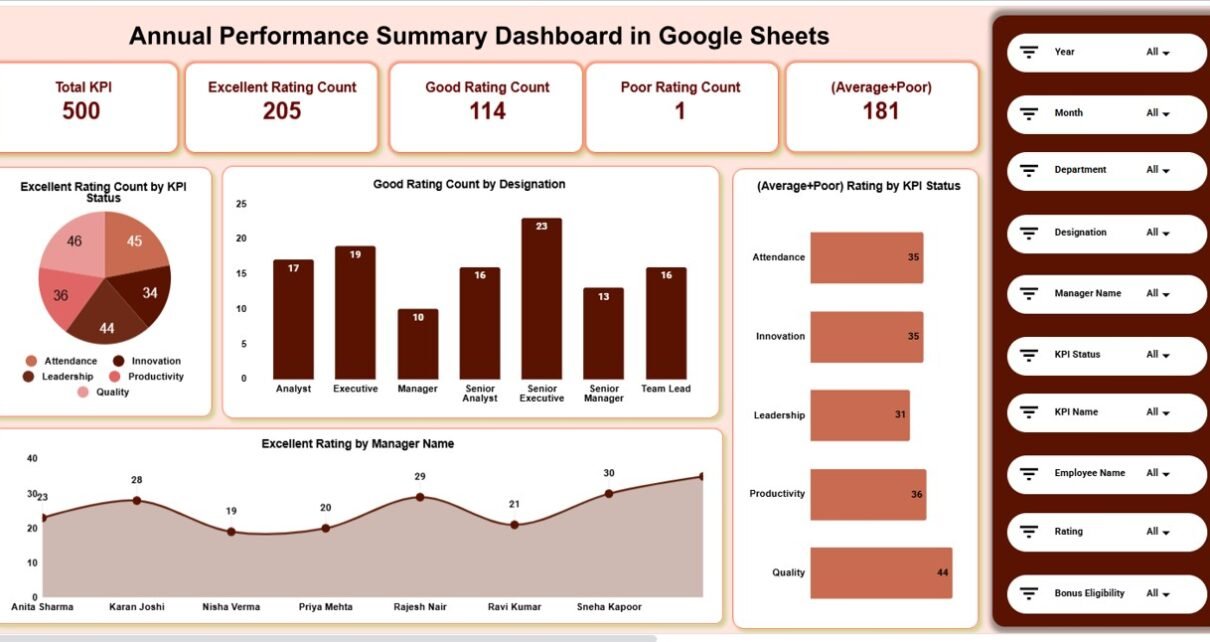
Annual Performance Summary Dashboard in Google Sheets
Tracking employee and KPI performance over an entire year becomes challenging when data sits in multiple files or static reports. Managers often struggle to identify high performers, weak areas, and improvement opportunities. As a result, performance reviews become subjective and time-consuming.Annual Performance Summary Dashboard in Google Sheets That is exactly why an Annual Performance Summary […]