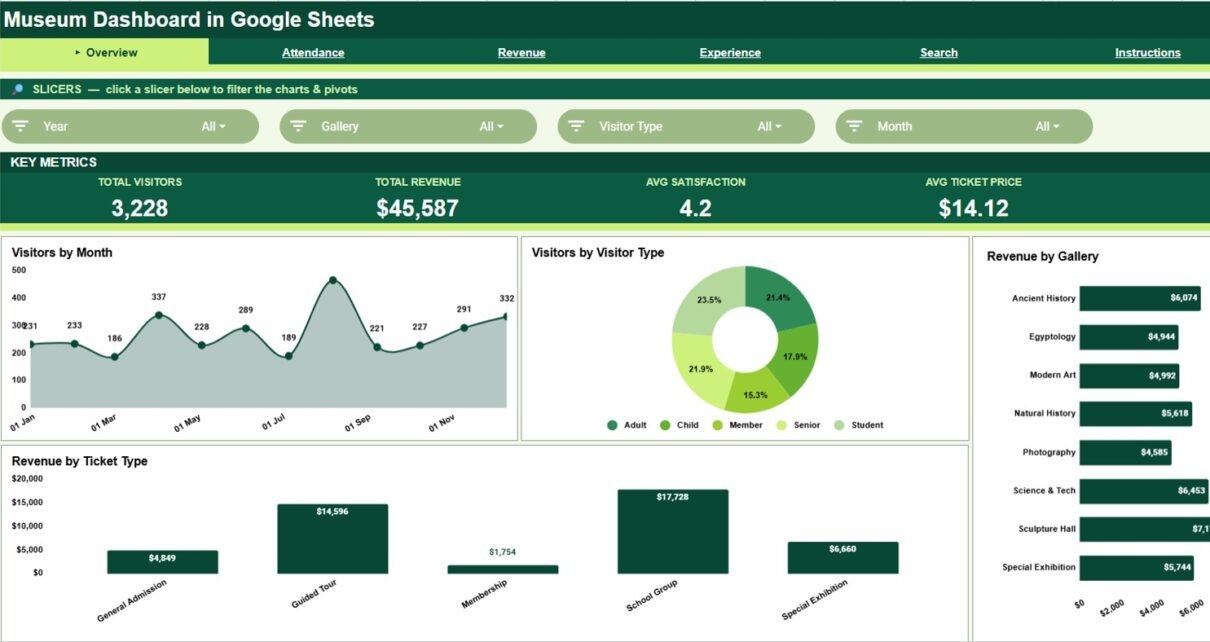
Museum Dashboard in Google Sheets with 6 tabs, 4 KPI cards, slicers, visitor analysis, revenue reporting, experience tracking, search lookup, and editable data.
Online Tutorial for Data Analysis and Automation
Google-Sheets-Dashboard
Museum Dashboard in Google Sheets with 6 tabs, 4 KPI cards, slicers, visitor analysis, revenue reporting, experience tracking, search lookup, and editable data.
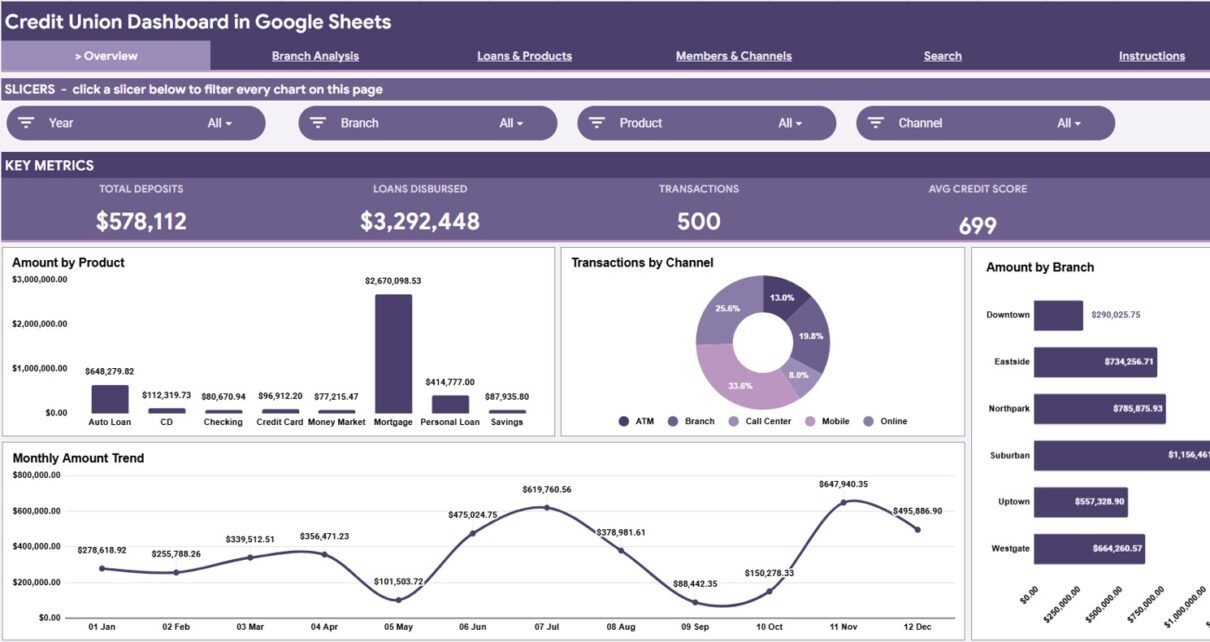
Credit union reporting template for deposits, loans, branches, products, member segments, channels, credit scores, lookup, and data entry in Google Sheets.
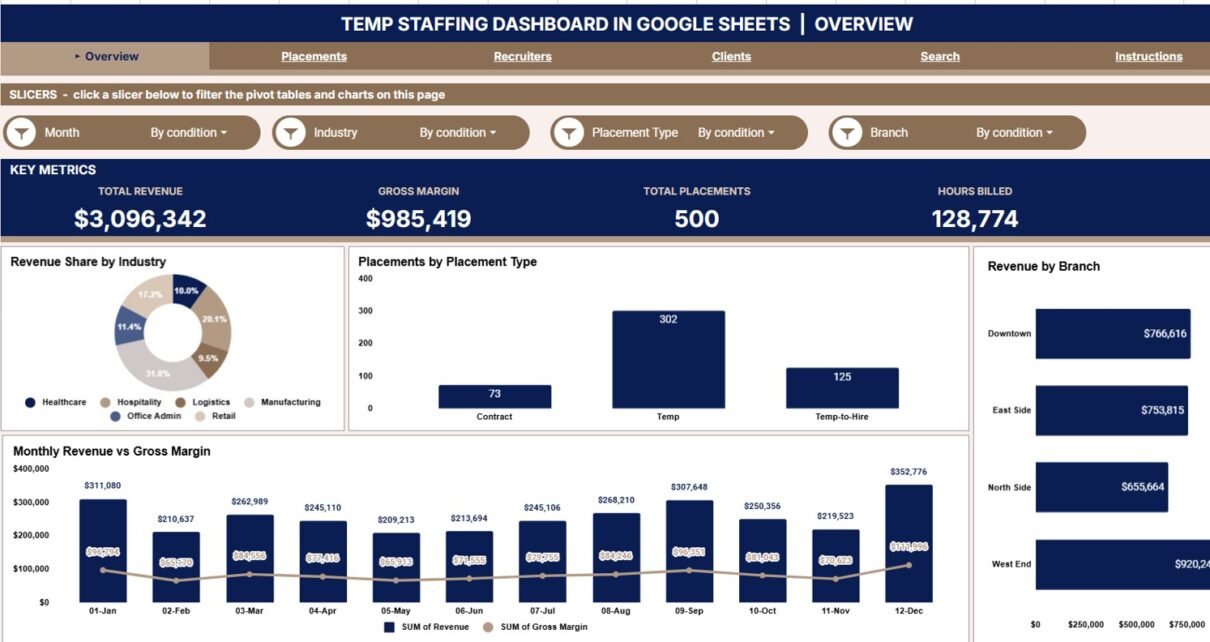
The Temp Staffing Dashboard in Google Sheets tracks revenue, gross margin, placements, and hours billed across 6 tabs with 16 charts and slicers. Monitor branch, recruiter, and client profitability in real time for a one-time $9.99.
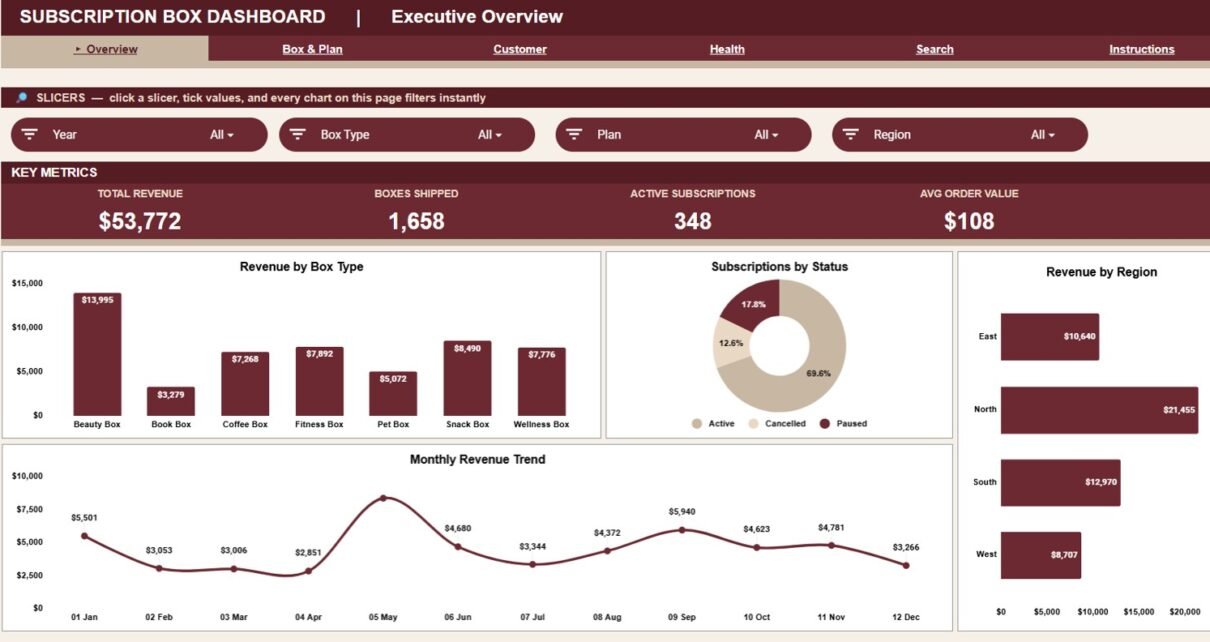
The Subscription Box Dashboard in Google Sheets tracks Total Revenue, Boxes Shipped, Active Subscriptions, and Avg Order Value across 4 analysis pages with 15 charts, slicer filters, and an order Search sheet — setup in under 10 minutes.
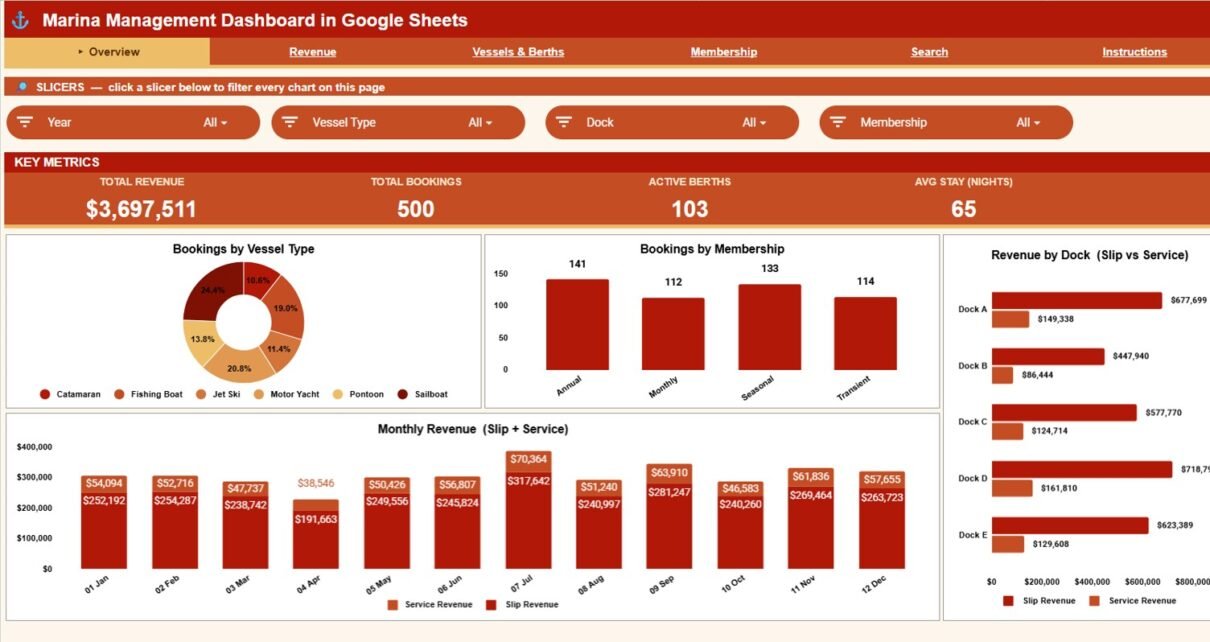
A full walkthrough of the Marina Management Dashboard in Google Sheets — 4 KPIs, 16 charts, a Search tab, and a single Data tab to track slip bookings, berth occupancy, and revenue without marina SaaS.
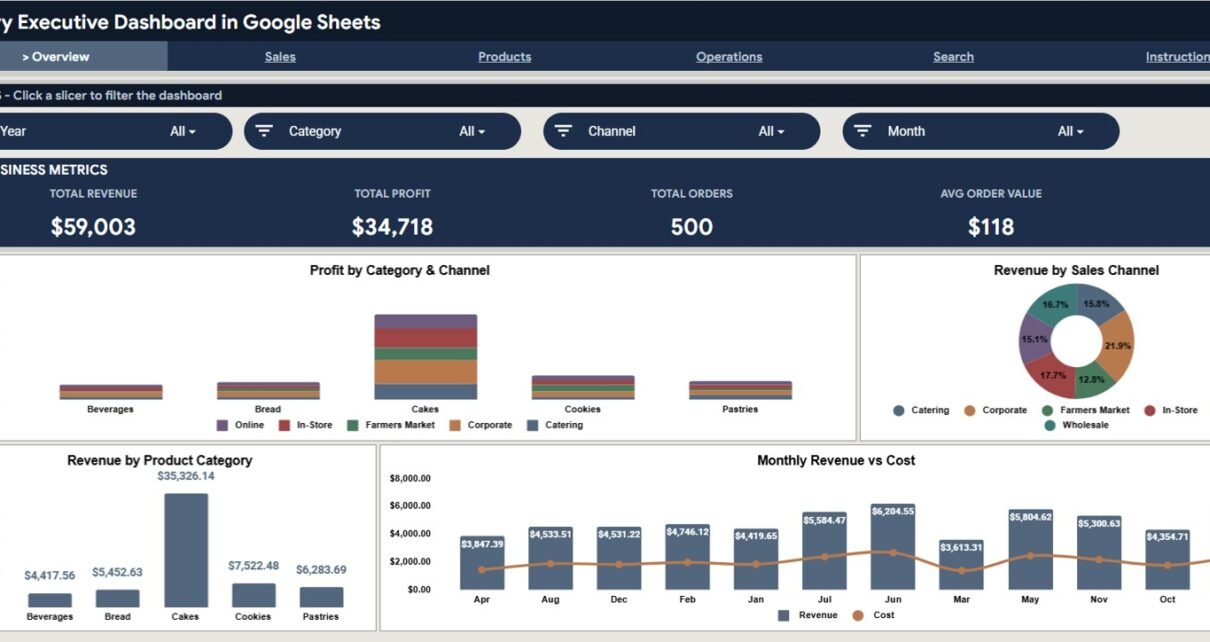
A Google Sheets bakery dashboard that tracks revenue, profit, orders and average order value across 4 interactive pages with 16 charts, slicers and an order Search tab.
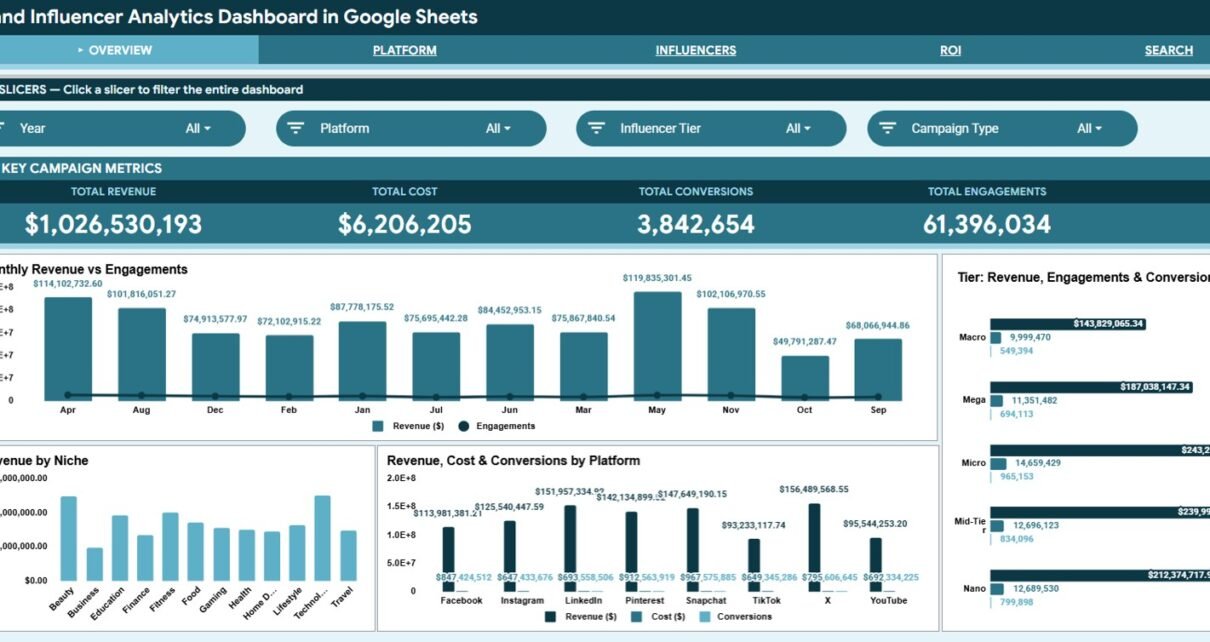
Track influencer campaign revenue, cost, conversions and engagements in Google Sheets with 4 KPI cards, 14 charts, slicers and a campaign lookup.
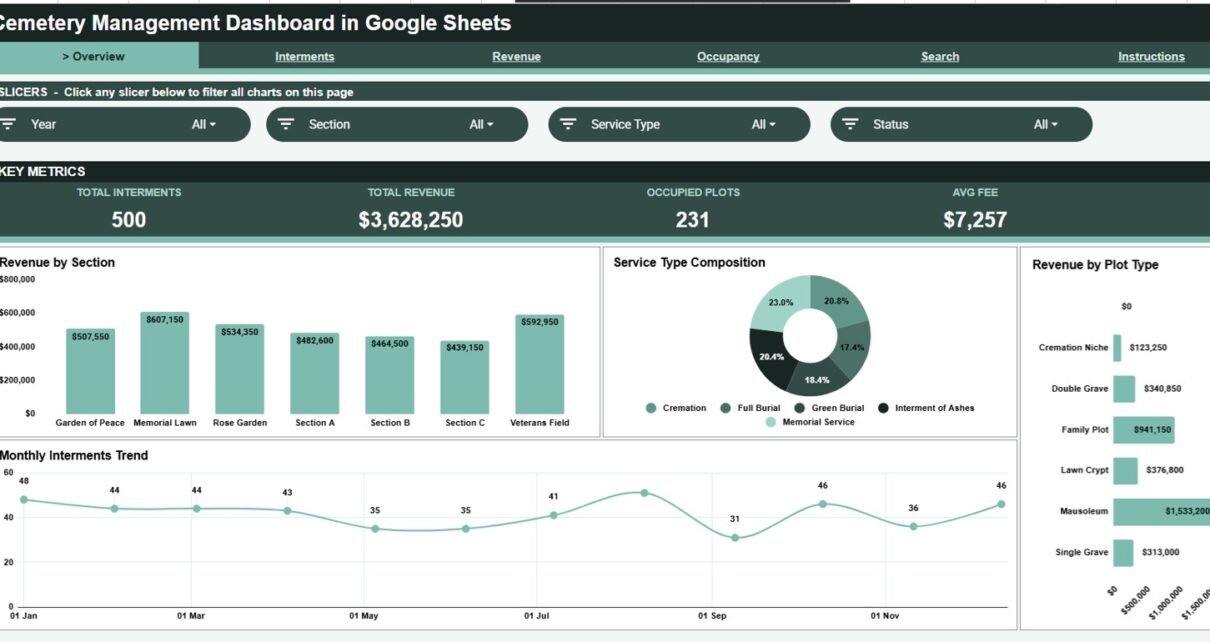
Cemetery Management Dashboard in Google Sheets — track interments, revenue, and plot occupancy with 4 KPIs and 16 charts across 5 interactive pages, a Data sheet, and a Search tab. One-time $9.99, runs in any browser.
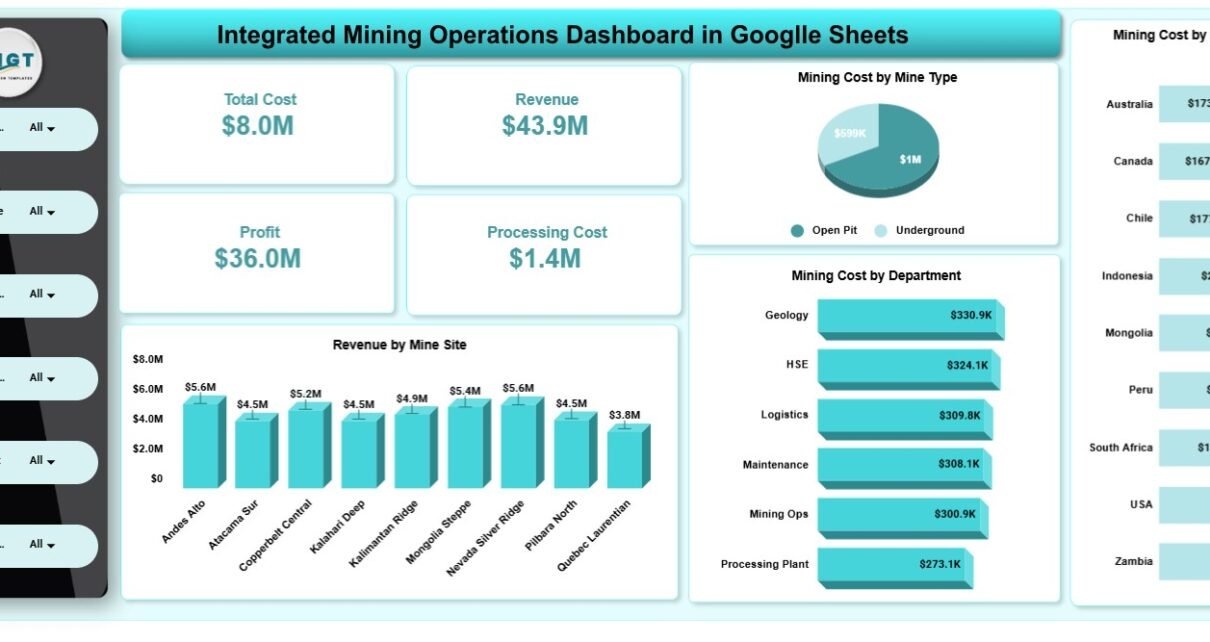
A connected Google Sheets dashboard with 4 KPI cards, 20 charts and 5 slicer-driven pages covering mining production, downtime, safety, ESG and profitability.
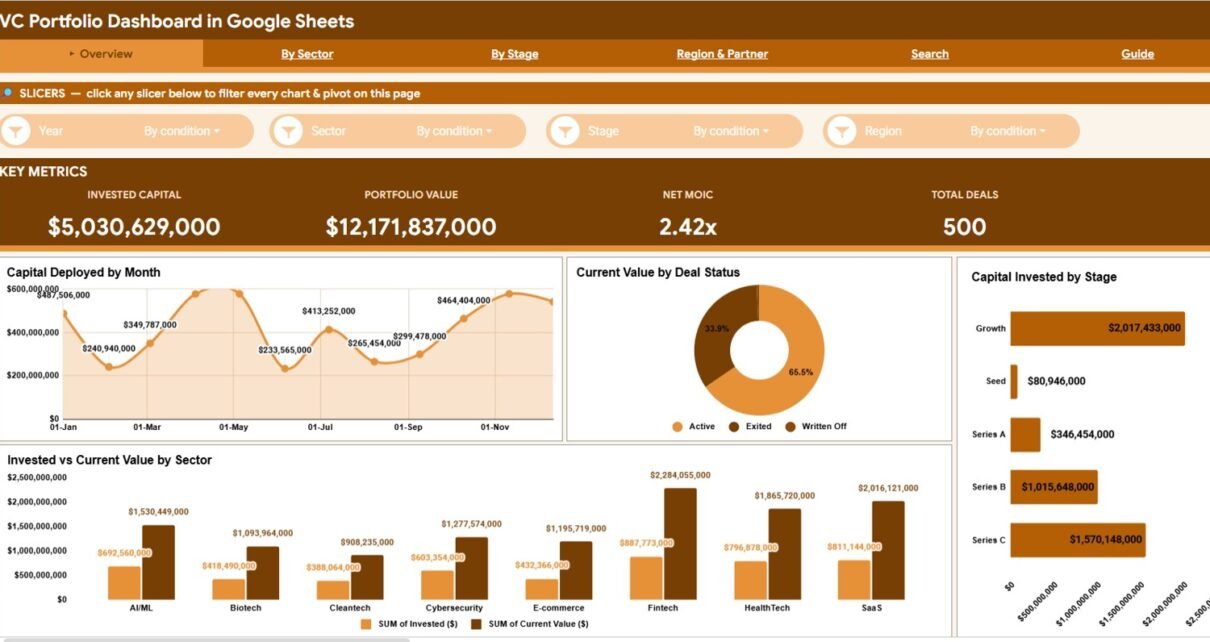
A VC Portfolio Dashboard in Google Sheets that tracks Invested Capital, Portfolio Value, Net MOIC and Total Deals across 6 connected tabs and 16 charts — a one-time alternative to per-seat fund software.