Plan and review events with annual, monthly, and daily views and a structured Events sheet in this Google Sheets calendar template.

Online Tutorial for Data Analysis and Automation
Plan and review events with annual, monthly, and daily views and a structured Events sheet in this Google Sheets calendar template.

Review 14 fire safety service KPIs with MTD/YTD scorecards, targets, prior-year comparisons, trends, group analysis, inputs and editable definitions.
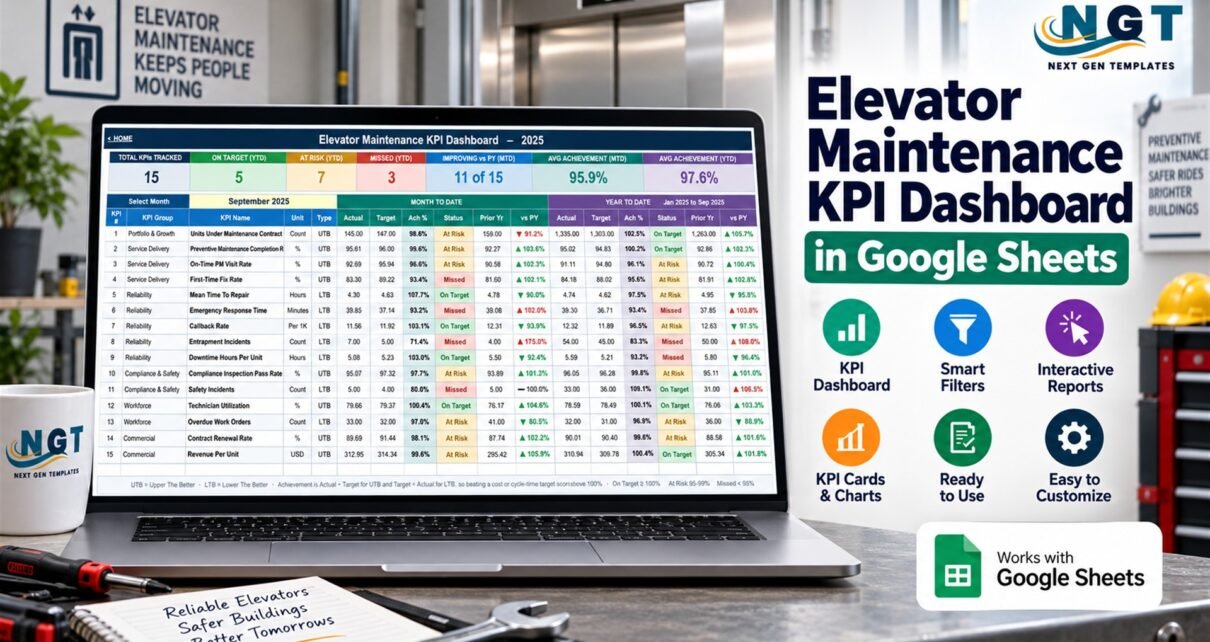
Review 15 elevator maintenance KPIs with MTD/YTD scorecards, targets, prior-year comparisons, trends, group analysis, inputs and editable definitions.
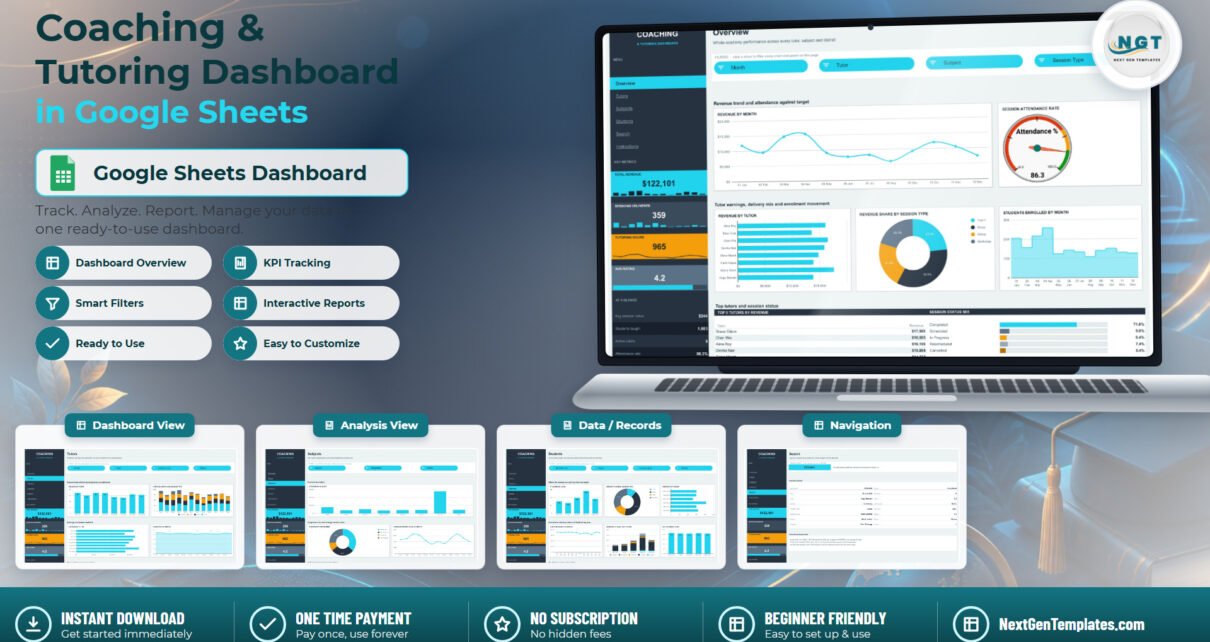
A 6-page Coaching & Tutoring Dashboard in Google Sheets with 18 pivot-driven charts, 15 slicers, 8 headline metrics and a Session ID lookup. Paste your session log and every KPI updates on its own.

A six-tab Google Sheets dashboard for subscription course businesses: 15 slicers, 16 KPI cards, 500 sample enrollment rows and an enrollment lookup page. Static, no LMS connection.
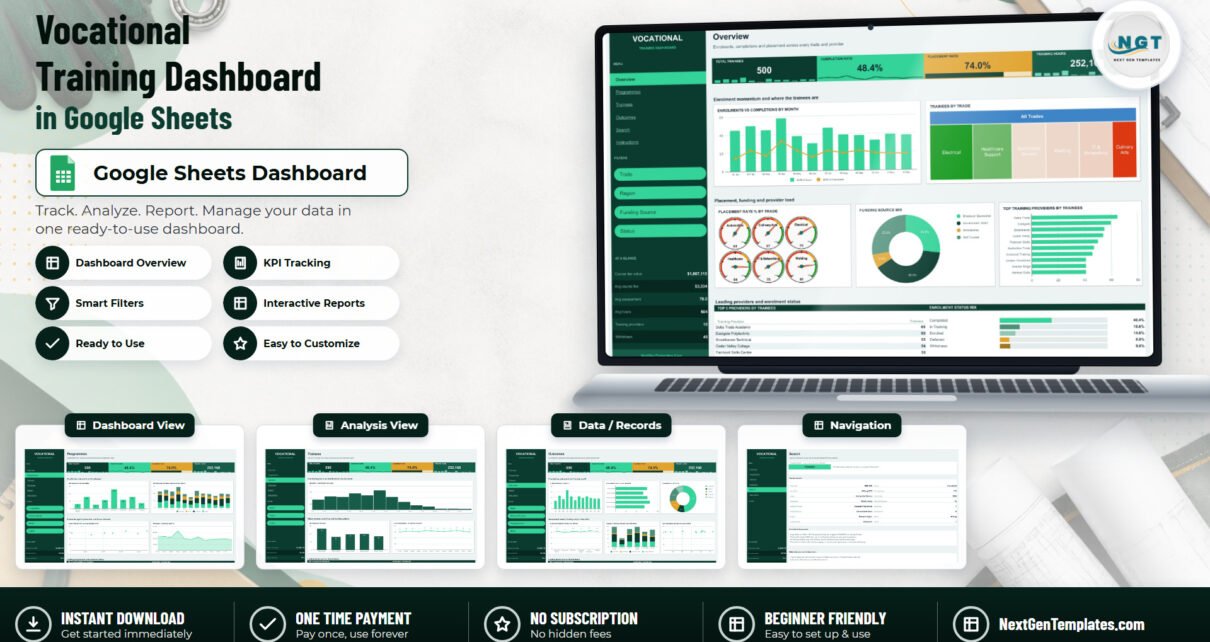
A six-tab Google Sheets reporting workbook for training providers: 4 KPIs, 17 charts, 15 slicers and a formula-only trainee lookup over a 16-column data model with no personal data.

A ready-built Google Sheets dashboard for colleges and universities: six sheets, 15 slicers, 16 charts and 500 sample application records covering admissions, academics, tuition and scholarships.
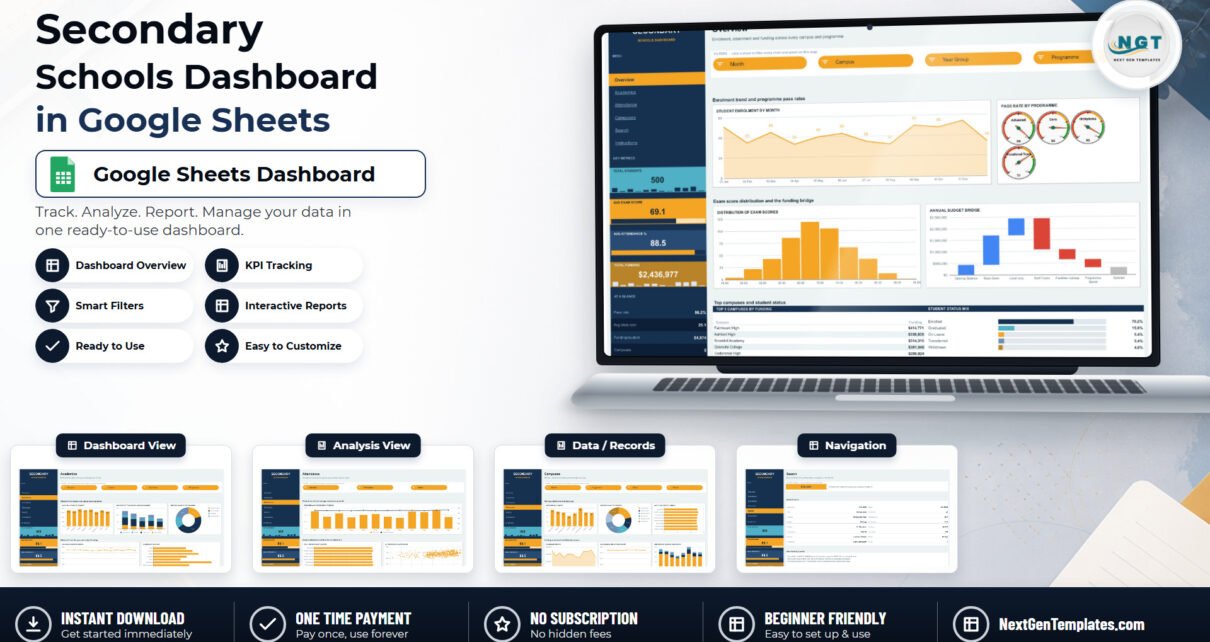
A page-by-page walkthrough of the Secondary Schools Dashboard in Google Sheets – five linked reporting pages, 18 charts, 15 slicers and a coded Student ID lookup over 500 sample rows, with an honest note on what the file does and does not hold about pupils.
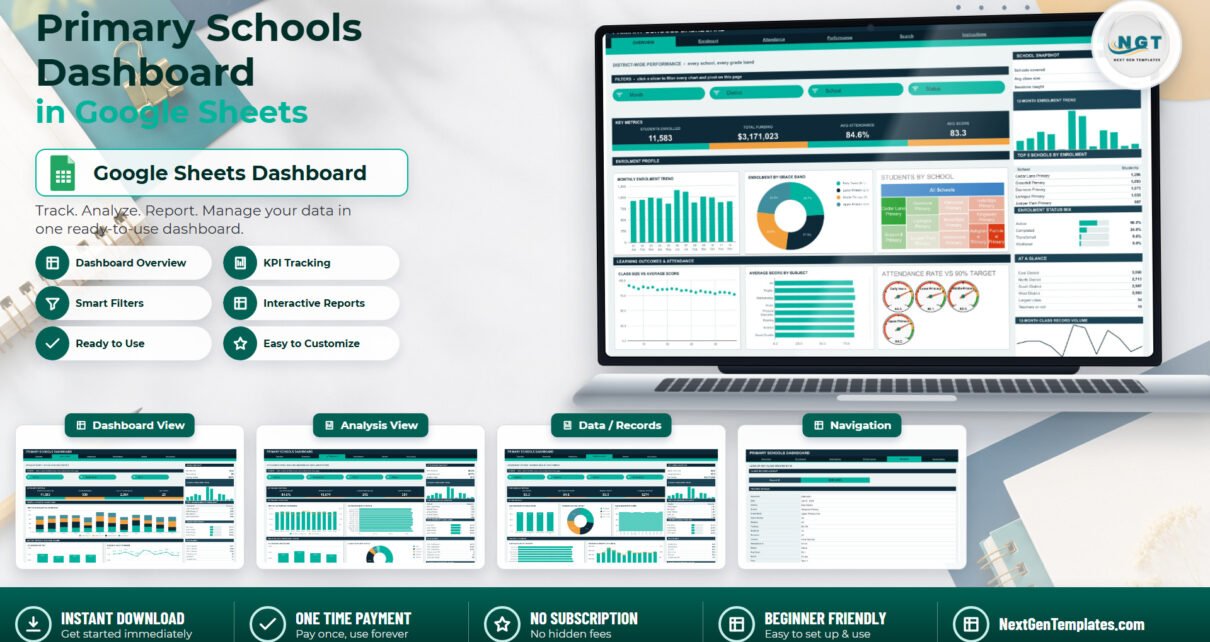
A six-tab Google Sheets reporting template for primary schools: 16 KPI cards, 21 charts and gauges, 15 slicers, native pivot tables and a Record ID lookup. Class-level data only – no pupil names, dates of birth, contact details, SEN or safeguarding fields anywhere in the file.
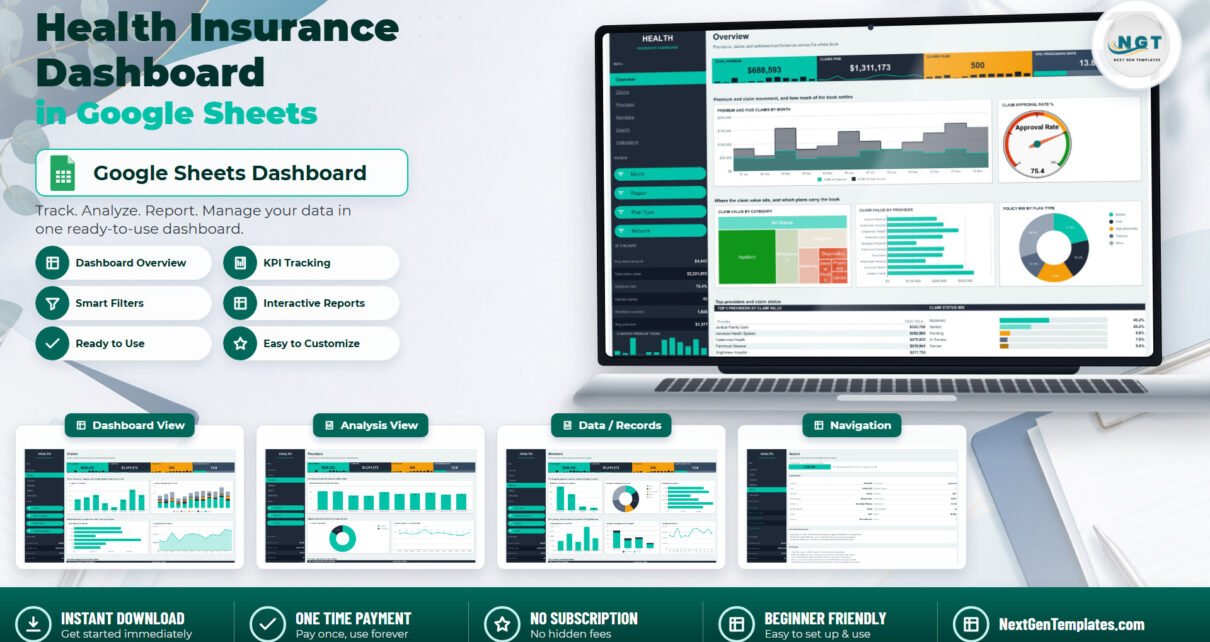
A Google Sheets health insurance reporting template: four filtered pages, 18 pivot-driven charts, 15 slicers and a Claim ID lookup, with 500 sample claims and room for 1,000.