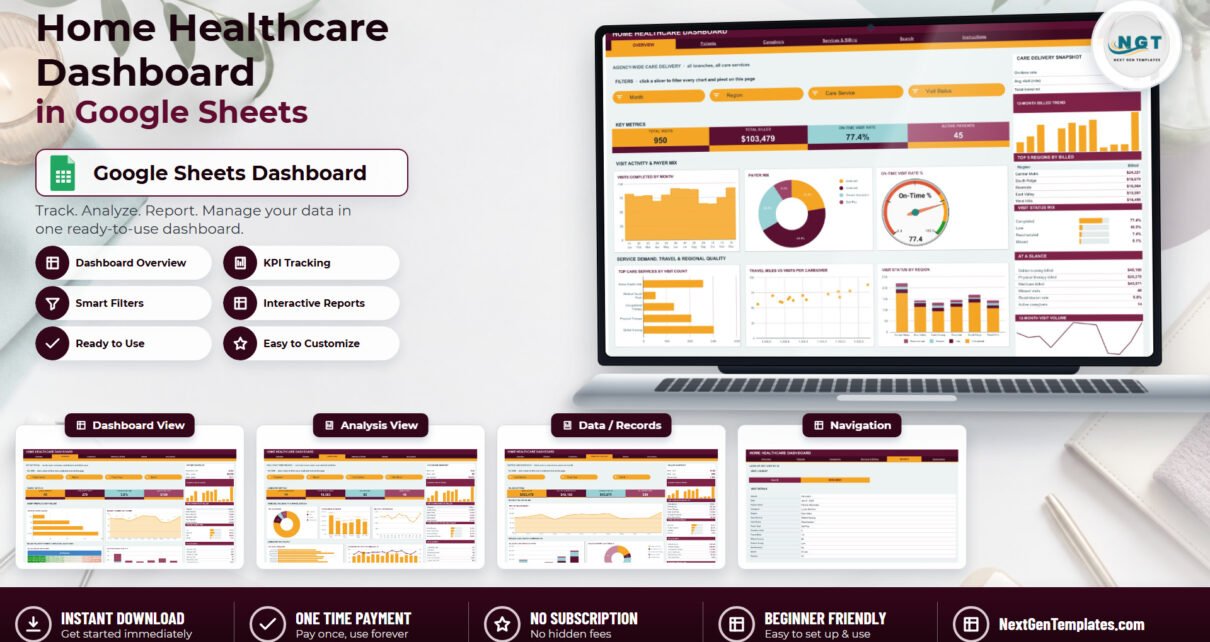
A six-page Google Sheets dashboard for home care agencies: 950 sample visits, 16 KPI cards, 18 charts and 15 slicers covering visits, caregivers, travel miles, payer mix and billed value – with an honest note on what it holds and what it is not.
Online Tutorial for Data Analysis and Automation
A six-page Google Sheets dashboard for home care agencies: 950 sample visits, 16 KPI cards, 18 charts and 15 slicers covering visits, caregivers, travel miles, payer mix and billed value – with an honest note on what it holds and what it is not.
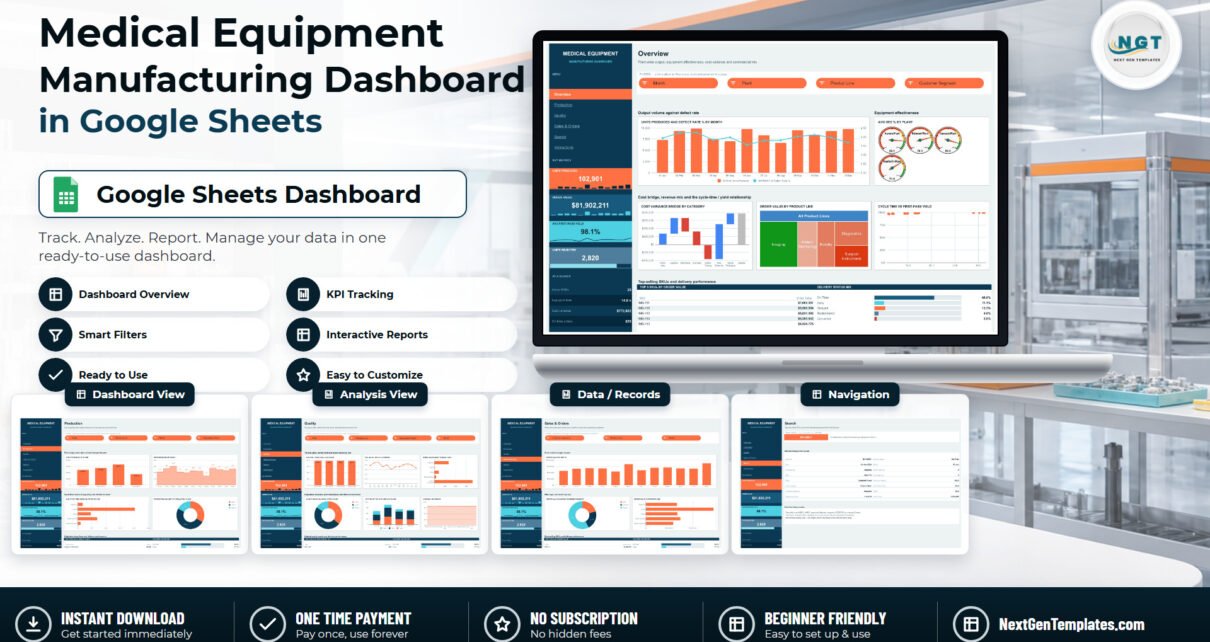
A six-tab Google Sheets reporting workbook for medical device plants – 950 sample manufacturing orders, 18 charts, 15 slicers and an order lookup page. Static reporting only: no ERP link and no regulatory or QMS capability.
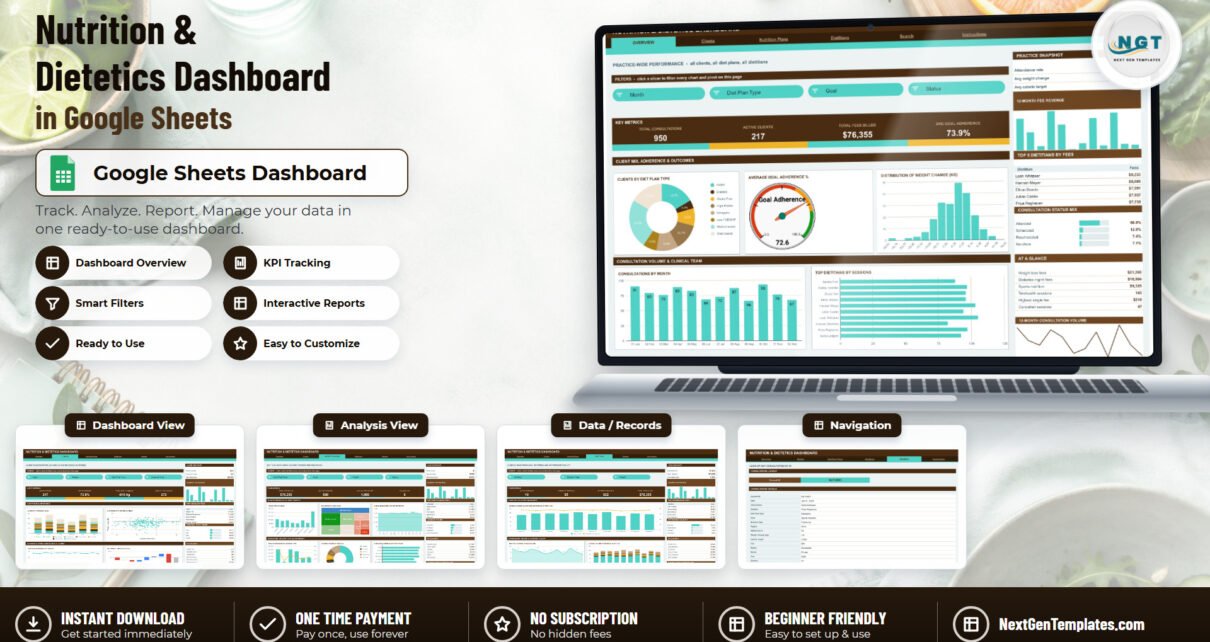
The Nutrition & Dietetics Dashboard in Google Sheets turns one consultation log into 4 slicer-driven pages with 18 charts, 16 KPI cards and 950 sample consultations – a business reporting template for a dietetics practice, not a clinical or meal-planning tool.
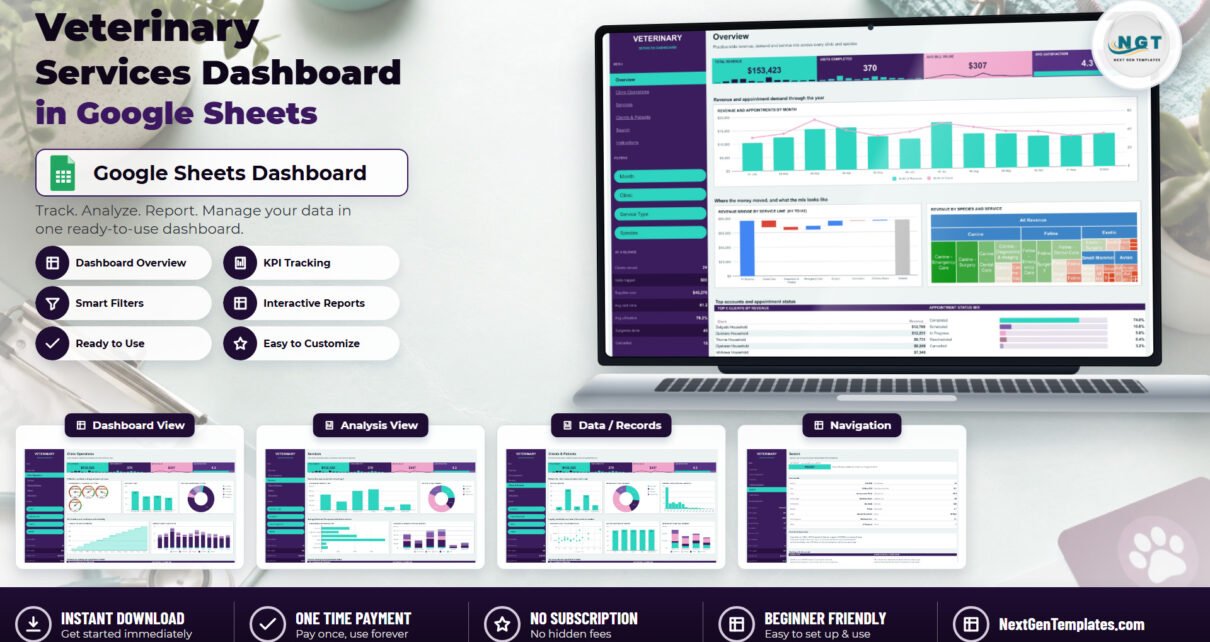
A page-by-page walkthrough of the Veterinary Services Dashboard in Google Sheets – seven tabs, 18 pivot-driven charts, 16 slicers and a 500-visit data model for revenue, utilisation and service mix across a practice group.
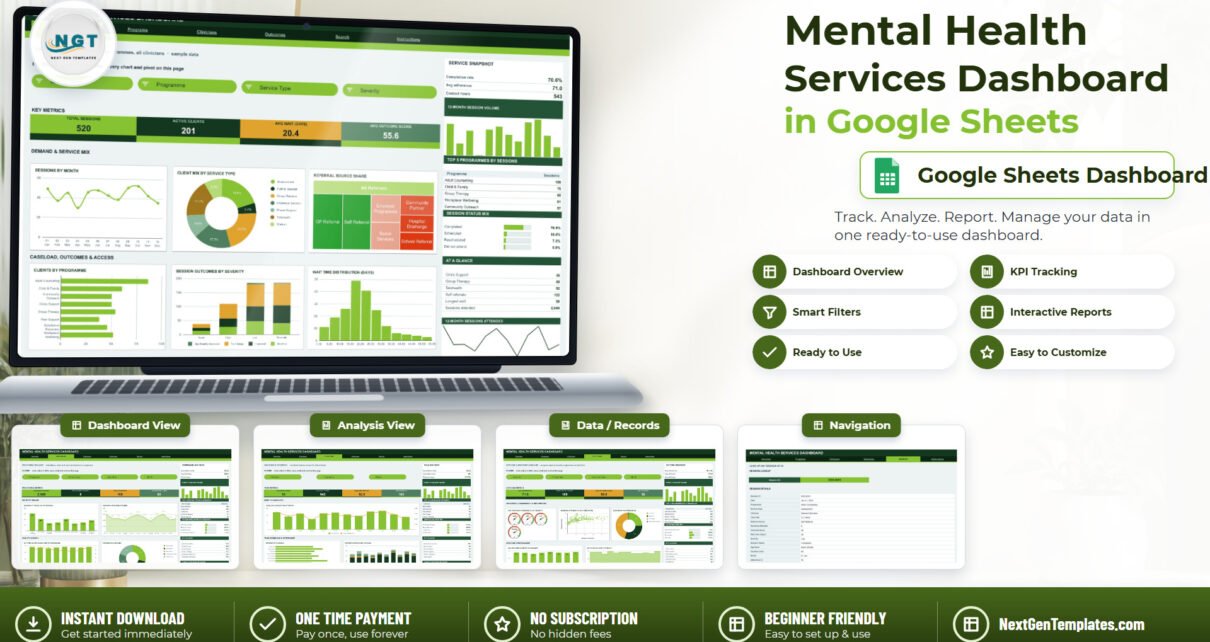
A 7-tab Google Sheets reporting template for mental health services: 16 KPI cards, 18 charts, 15 slicers and a 520-row session log. Operations reporting only, not a clinical tool.
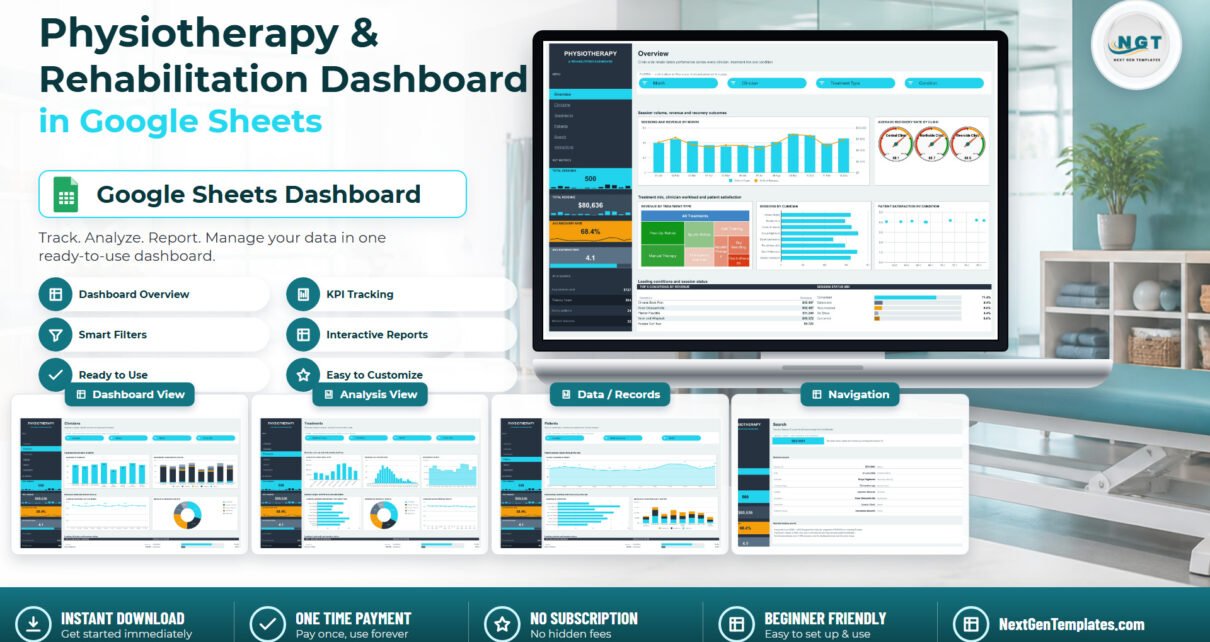
A six-page Google Sheets reporting dashboard for physiotherapy and rehabilitation clinics – sessions, revenue, recovery rate and satisfaction by clinician, treatment line, condition and clinic site. Not an EHR, no live link to a practice system.
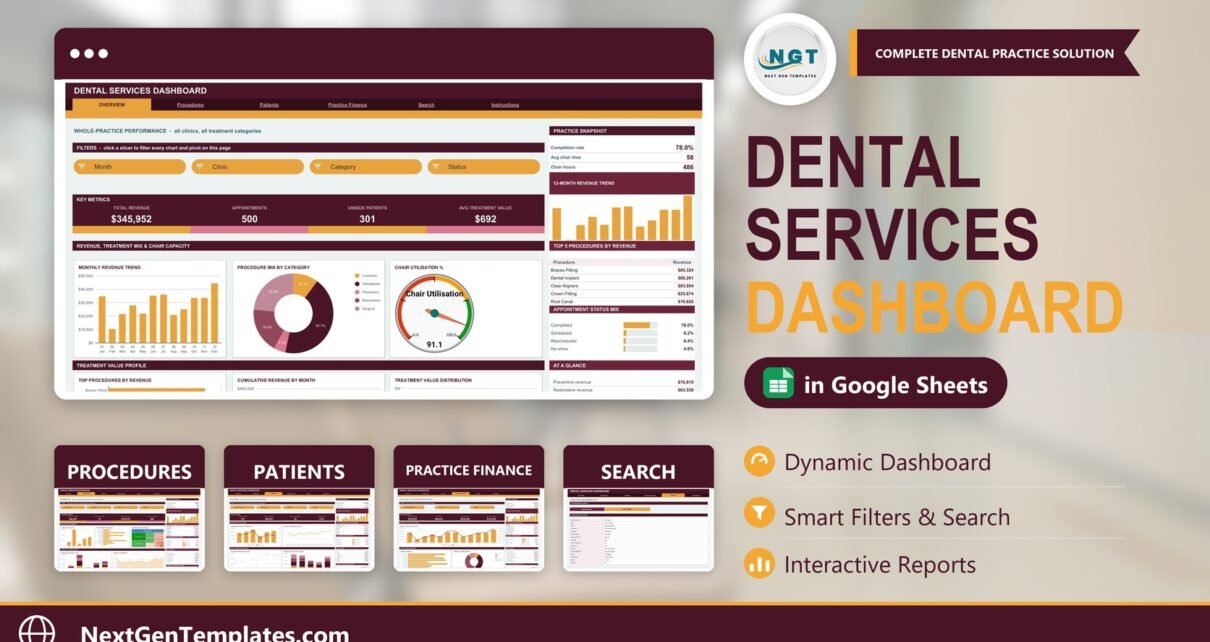
The Dental Services Dashboard in Google Sheets reports 16 KPI cards across 4 pages with 18 charts and 15 slicers – revenue, chair utilisation, insurance mix and lab costs from one appointment log.
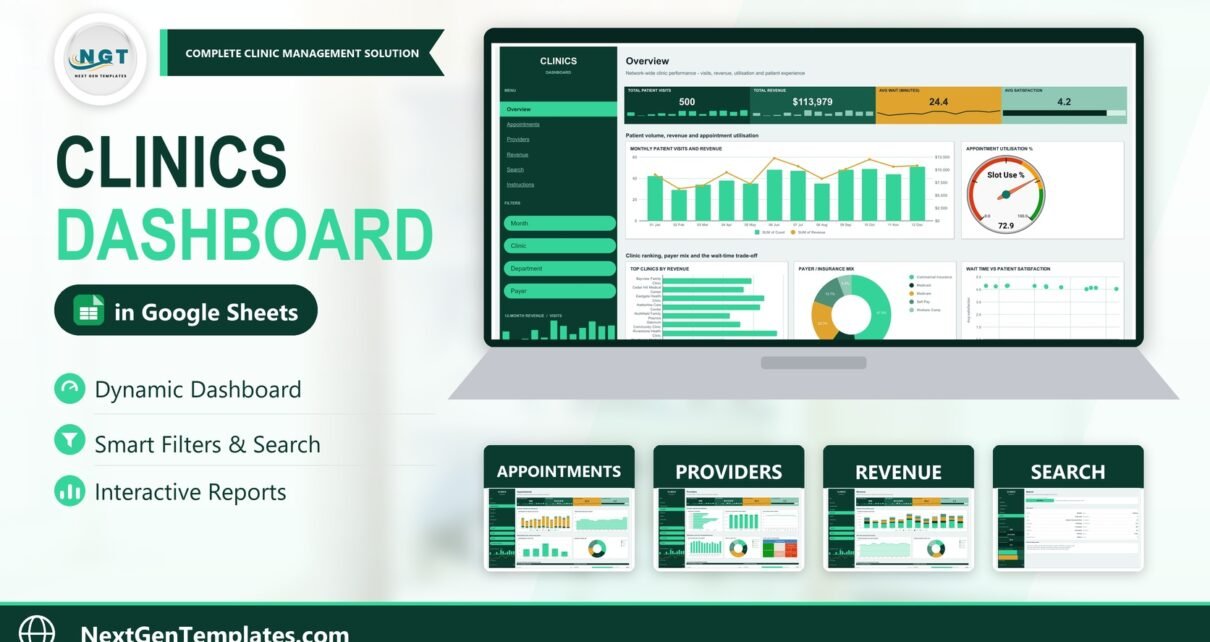
The Clinics Dashboard in Google Sheets turns one visit log into four report pages with 18 charts, 15 slicers and a Visit ID search – across 500 sample visits, 8 clinics and 12 providers, with no patient identifiers in the data model.
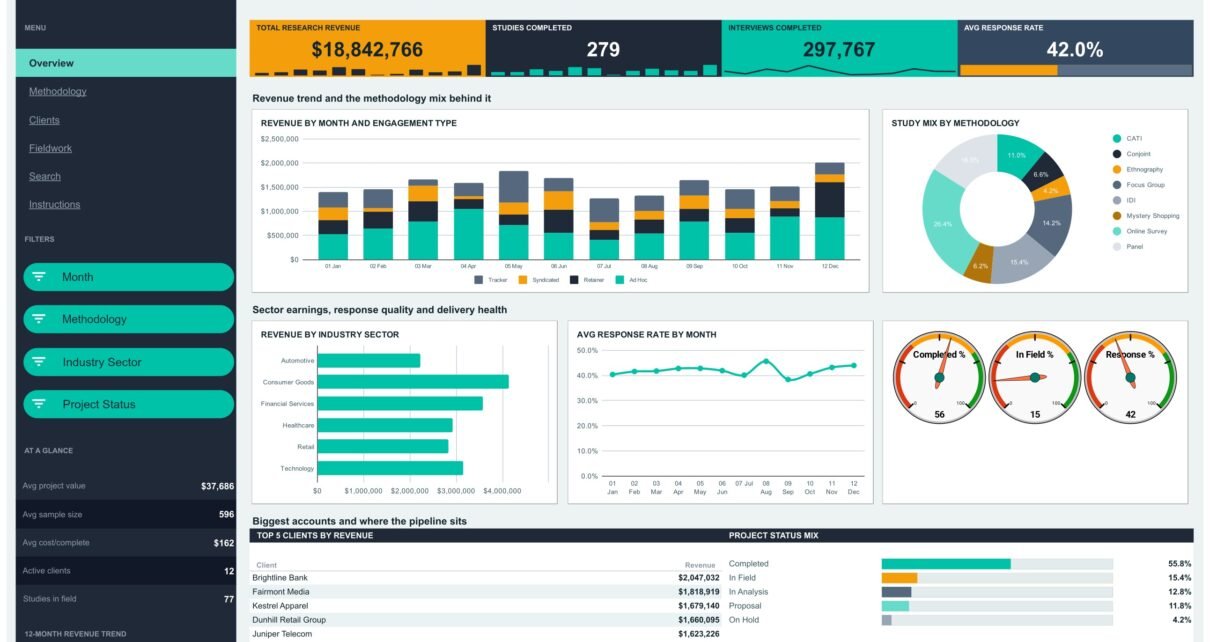
A six-tab Google Sheets reporting pack for research agencies: 4 KPI tiles, 17 charts, 3 gauges and 15 native slicers across Overview, Methodology, Clients and Fieldwork, plus a study lookup and a built-in guide.
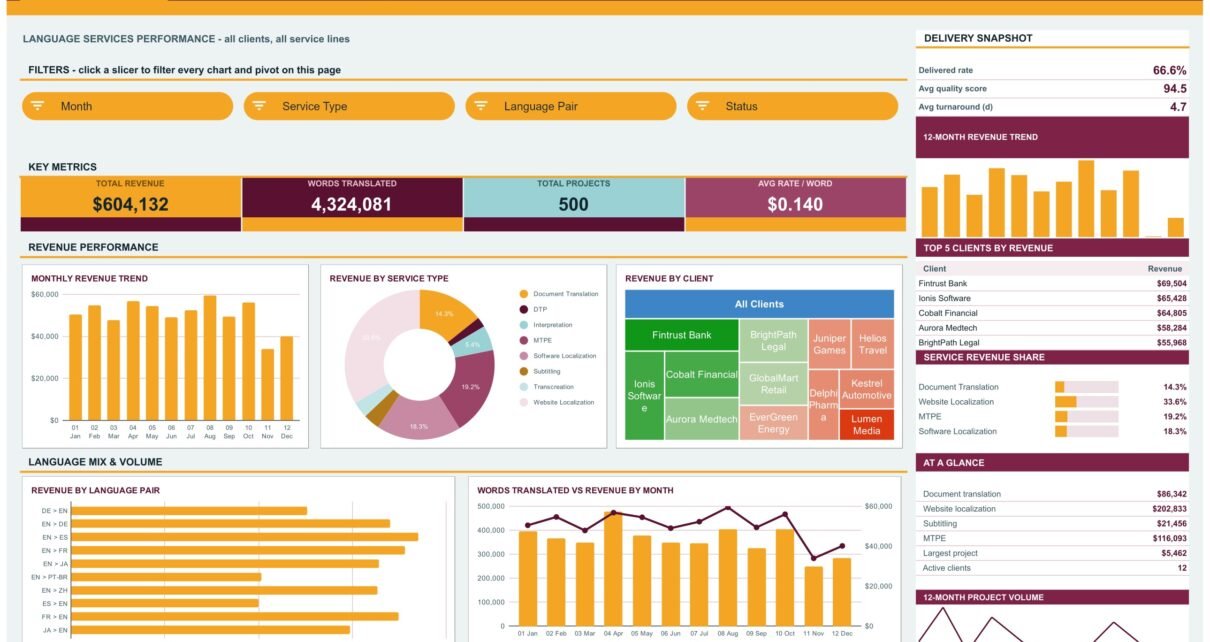
A six-tab Translation & Localization Dashboard in Google Sheets: 16 KPI cards, 17 charts and 15 slicers over 500 projects, 4.3M words and $604,132 of service revenue. Setup takes under 10 minutes.