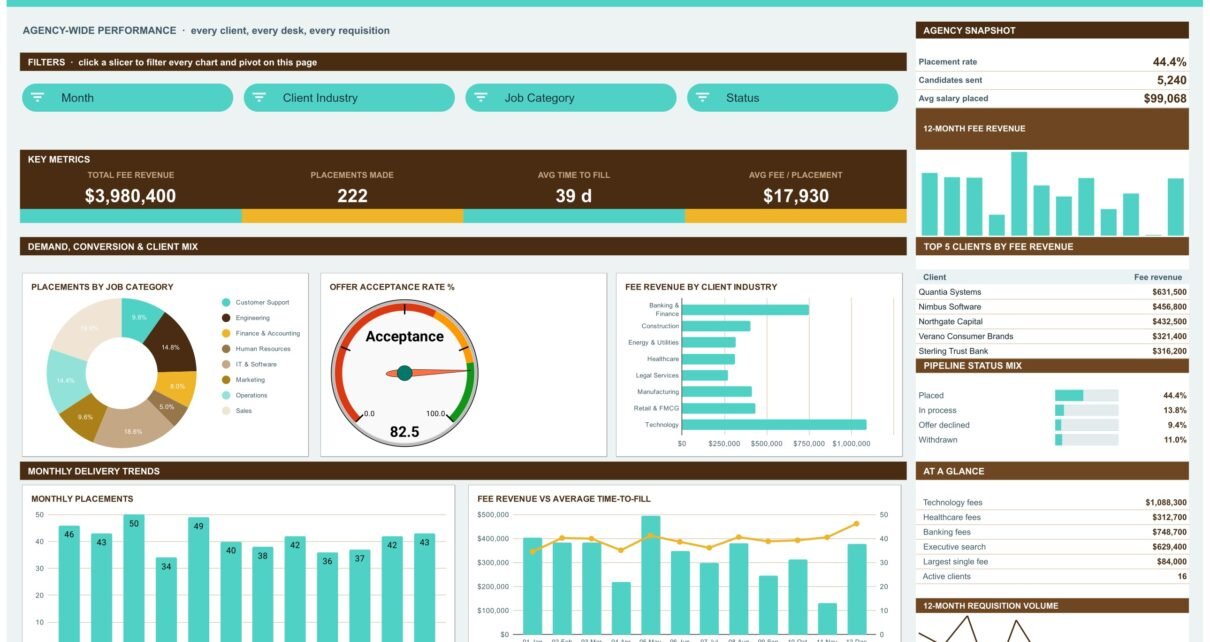
A six-tab Google Sheets dashboard for recruitment agencies: 16 KPI cards, 18 charts and 15 slicers over one placement log, reporting fee revenue, time-to-fill, candidate sources and recruiter billings.
Online Tutorial for Data Analysis and Automation
A six-tab Google Sheets dashboard for recruitment agencies: 16 KPI cards, 18 charts and 15 slicers over one placement log, reporting fee revenue, time-to-fill, candidate sources and recruiter billings.
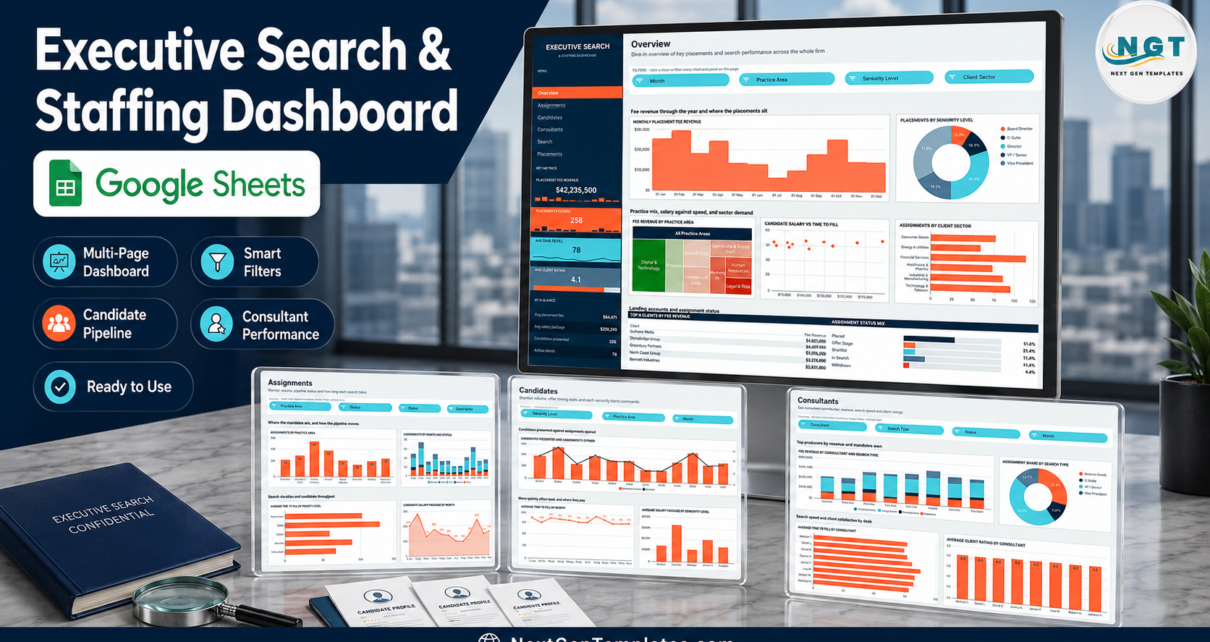
A six-tab Google Sheets workbook that turns 500 sample executive search mandates into fee revenue, pipeline, time-to-fill and consultant-level reporting using native pivot tables and 15 slicers. A reporting tool only – it charts what you enter and is not an applicant tracking system.

A six-page Facility Services Dashboard in Google Sheets built on native pivot tables and slicers – service cost, tickets, labor hours, technicians and a ticket ID lookup across eight sites.
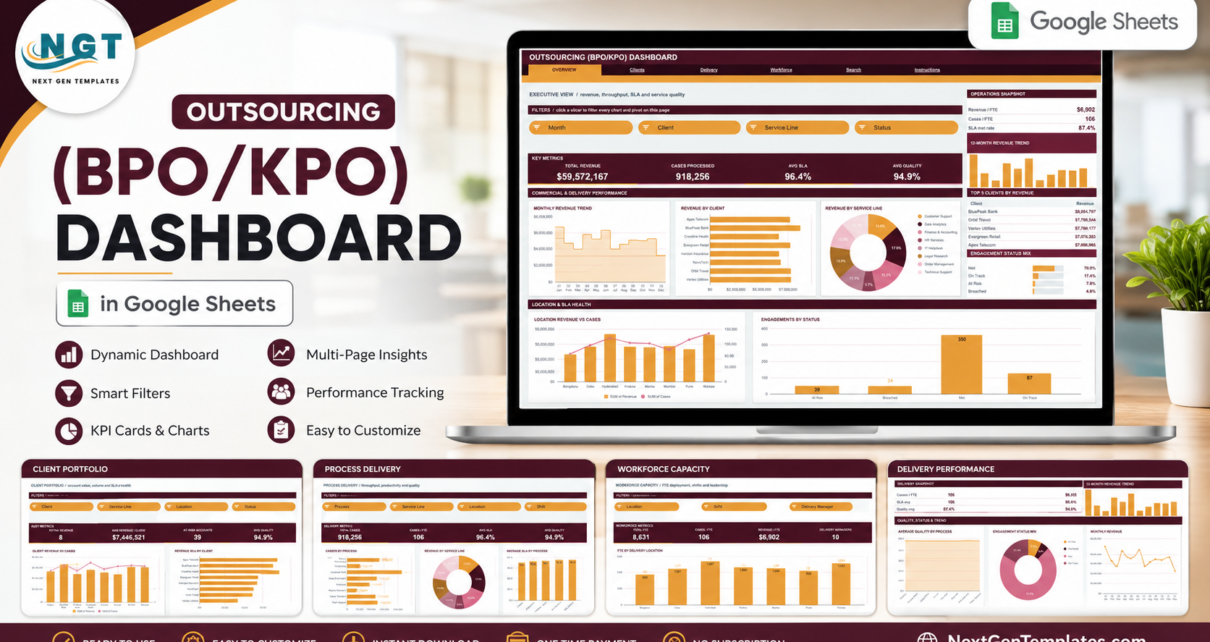
A six-tab Google Sheets reporting pack for BPO and KPO delivery teams: 16 KPI cards, 18 charts and 15 native slicers across Overview, Clients, Delivery and Workforce, plus an engagement lookup and a built-in user guide.
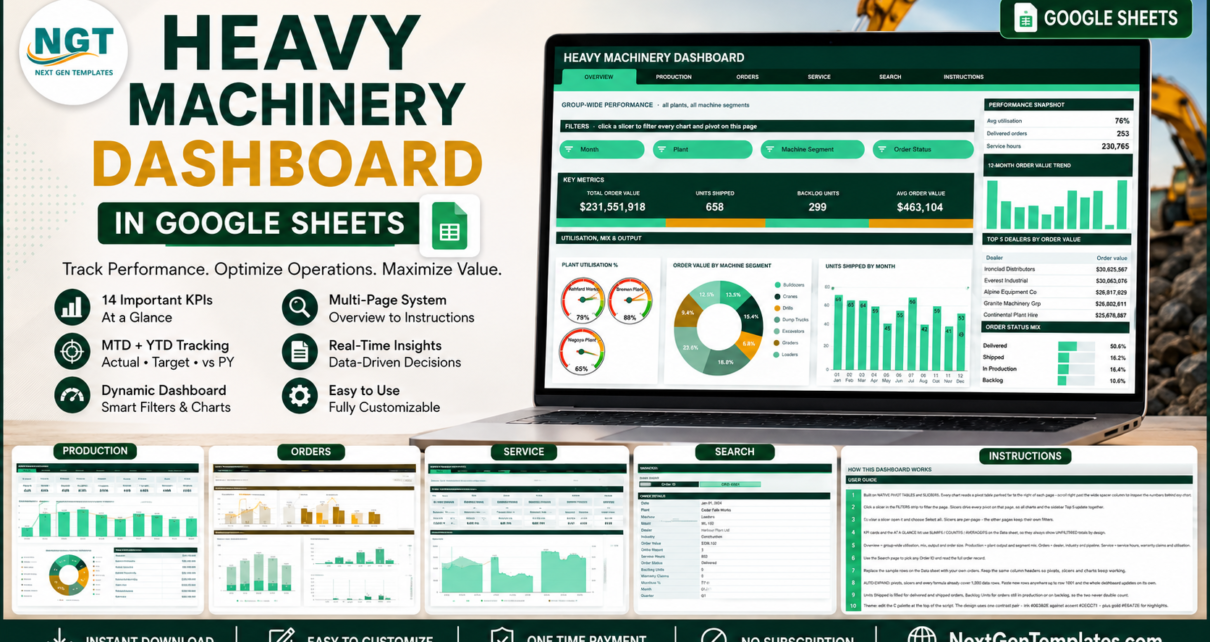
The Heavy Machinery Dashboard in Google Sheets tracks 16 KPI cards and 18 charts across 6 pages, driven by 15 native slicers over a 500-order book that auto-expands to 1,000 rows. Built on real pivot tables, it covers plant output, dealer orders, backlog and warranty service in one browser file.
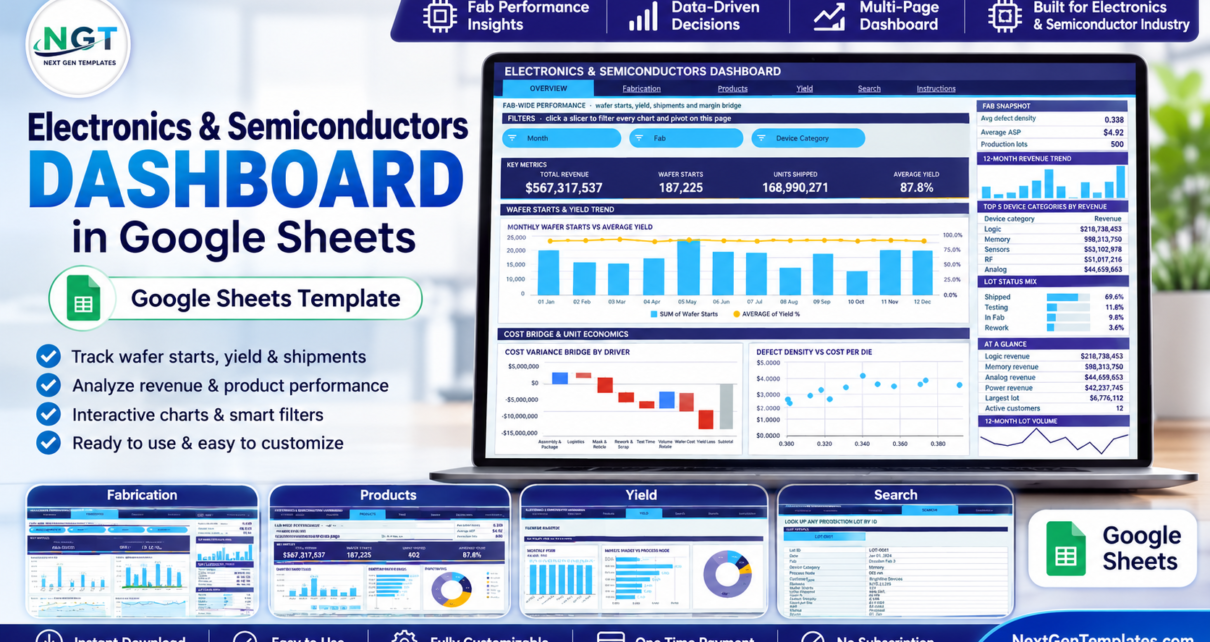
A pivot-and-slicer Electronics & Semiconductors Dashboard in Google Sheets with 6 pages, 16 KPI cards, 18 charts and 15 slicers covering wafer starts, yield, device mix and fab margin – built on 500 sample production lots.

The Textiles & Apparel Manufacturing Dashboard in Google Sheets tracks 16 KPI cards, 16 pivot-driven charts and 15 slicers across Overview, Production, Quality and Orders pages, plus an order lookup screen – built on native pivot tables and slicers, ready for 1,000 production rows.
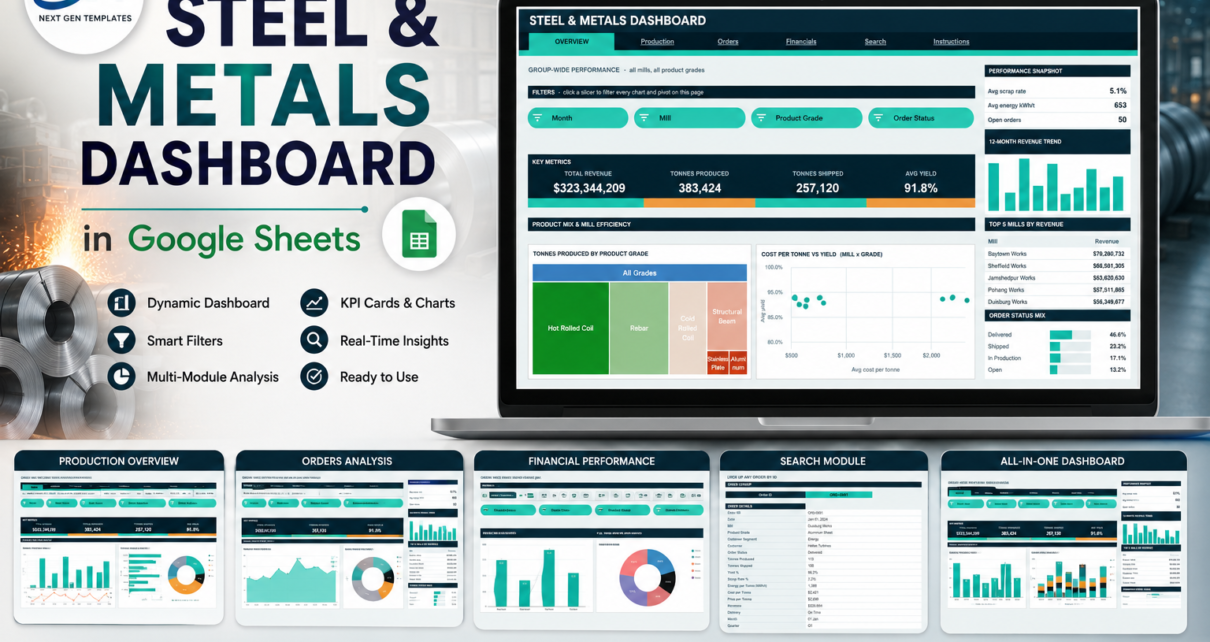
A six-page steel and metals mill dashboard built on native Google Sheets pivot tables and slicers: 16 KPI cards, 14 charts, 16 slicers and an order-level lookup, with 380 rows of demo data ready to be replaced with your own order log.
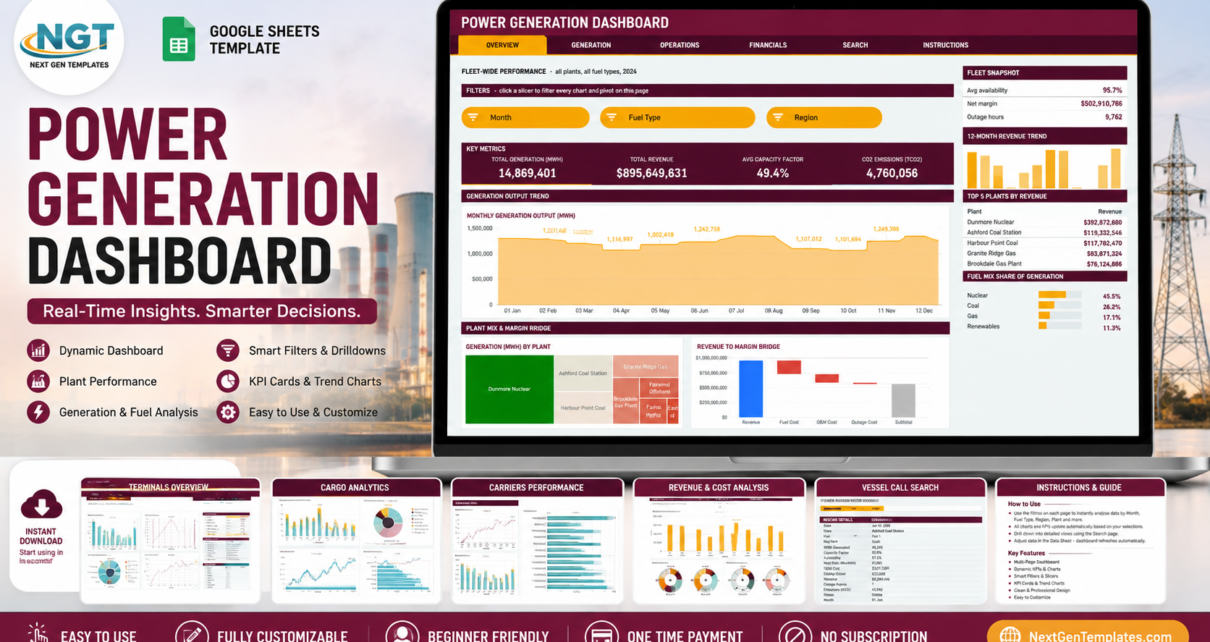
A six-page Power Generation Dashboard in Google Sheets built on native pivot tables and slicers – 16 KPI cards, 18 charts and a record lookup covering MWh, capacity factor, availability, outage hours, revenue and margin across your generation fleet.
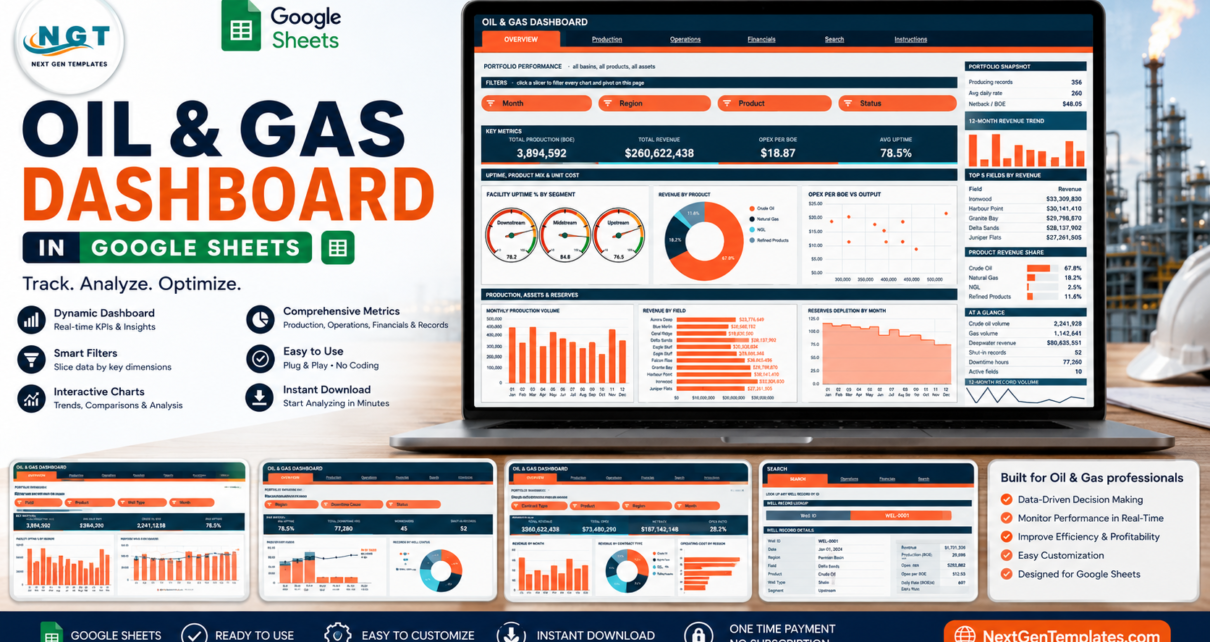
A walkthrough of the Oil & Gas Dashboard in Google Sheets – 6 tabs, 16 KPI cards, 18 pivot-driven charts and 15 native slicers for production, uptime, operating cost and netback reporting, with 500 rows of labelled demo data to start from.