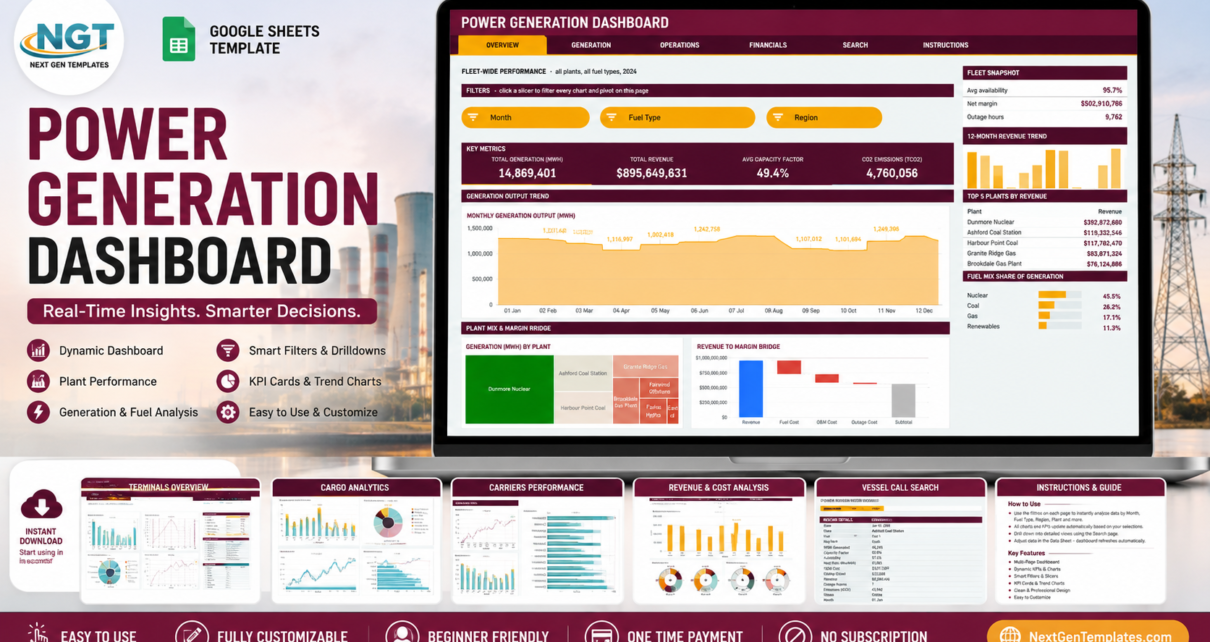
A six-page Power Generation Dashboard in Google Sheets built on native pivot tables and slicers – 16 KPI cards, 18 charts and a record lookup covering MWh, capacity factor, availability, outage hours, revenue and margin across your generation fleet.
Online Tutorial for Data Analysis and Automation
A six-page Power Generation Dashboard in Google Sheets built on native pivot tables and slicers – 16 KPI cards, 18 charts and a record lookup covering MWh, capacity factor, availability, outage hours, revenue and margin across your generation fleet.
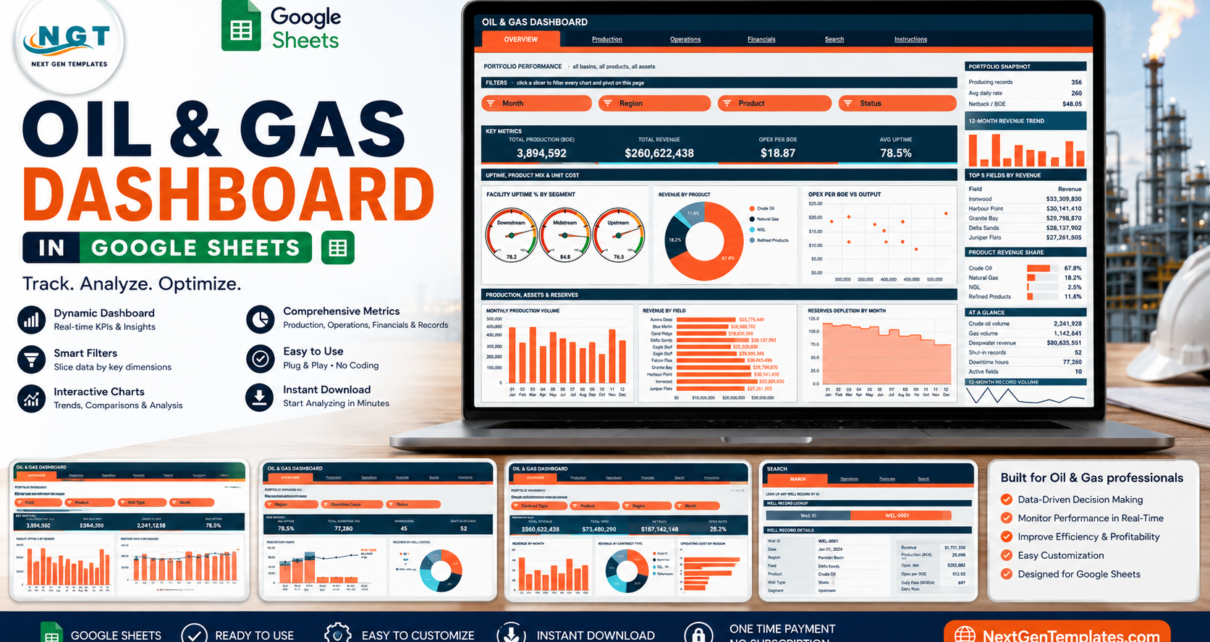
A walkthrough of the Oil & Gas Dashboard in Google Sheets – 6 tabs, 16 KPI cards, 18 pivot-driven charts and 15 native slicers for production, uptime, operating cost and netback reporting, with 500 rows of labelled demo data to start from.
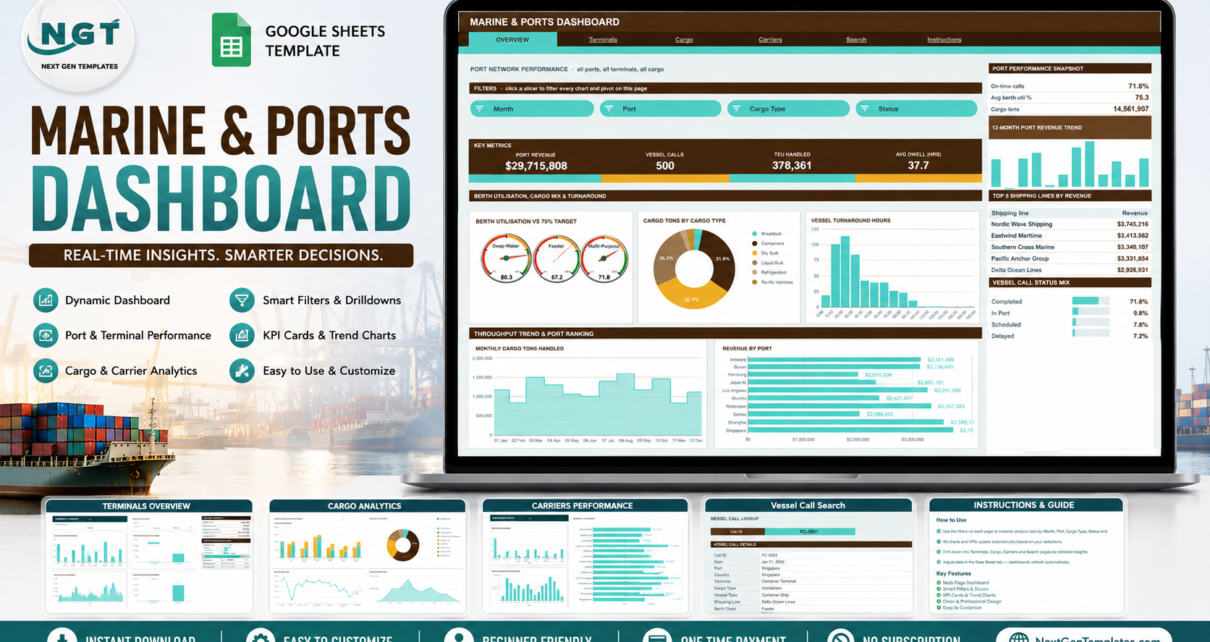
The Marine & Ports Dashboard in Google Sheets reports vessel calls, cargo tonnage, TEU, berth utilisation and shipping line revenue across 6 tabs, 16 KPI cards, 18 pivot-driven charts and 15 slicers – a one-time-purchase reporting layer over your own vessel call log.
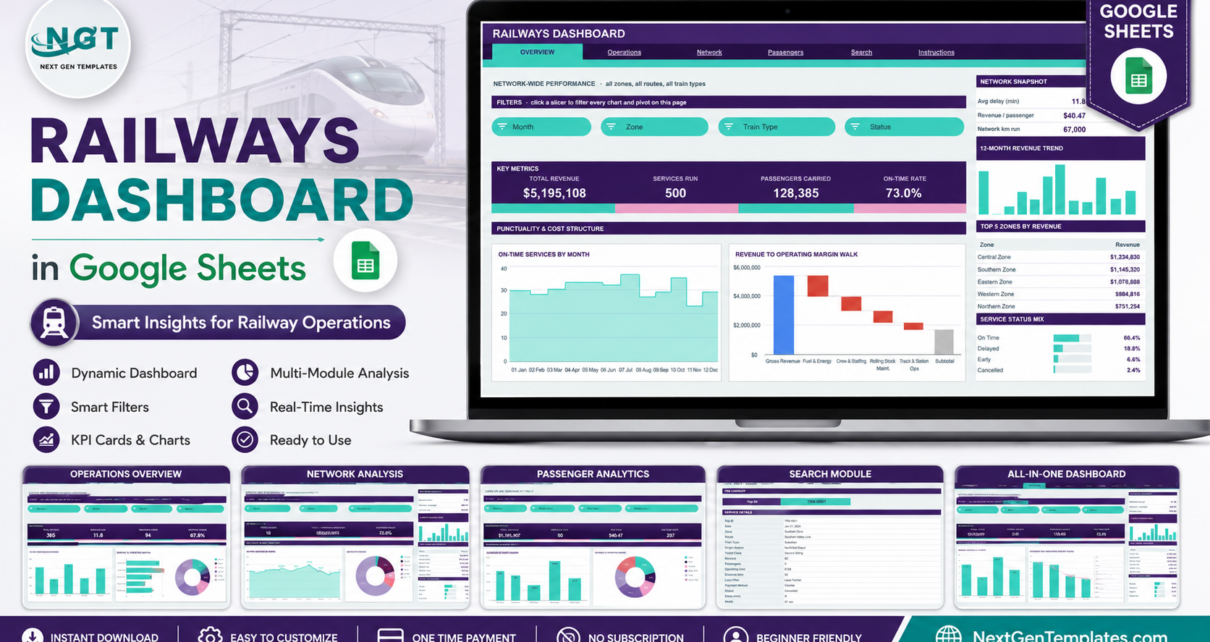
A pivot-and-slicer Railways Dashboard in Google Sheets with 6 tabs, 16 KPI cards, 19 charts and gauges and 15 slicers – covering punctuality, route revenue, operating margin and passenger demand from your own service log.
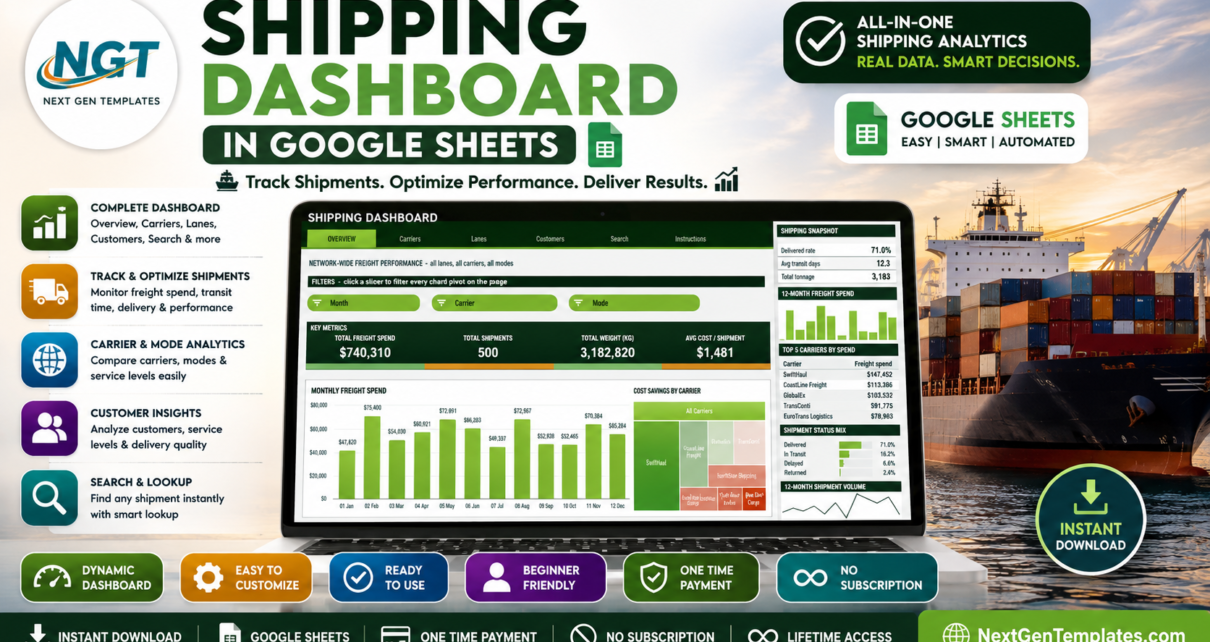
A five-page Shipping Dashboard in Google Sheets built on native pivot tables and slicers – freight spend, carrier mix, trade lanes, customer delivery quality and a shipment-ID lookup, with 500 sample shipments loaded and room for 1,000 rows.
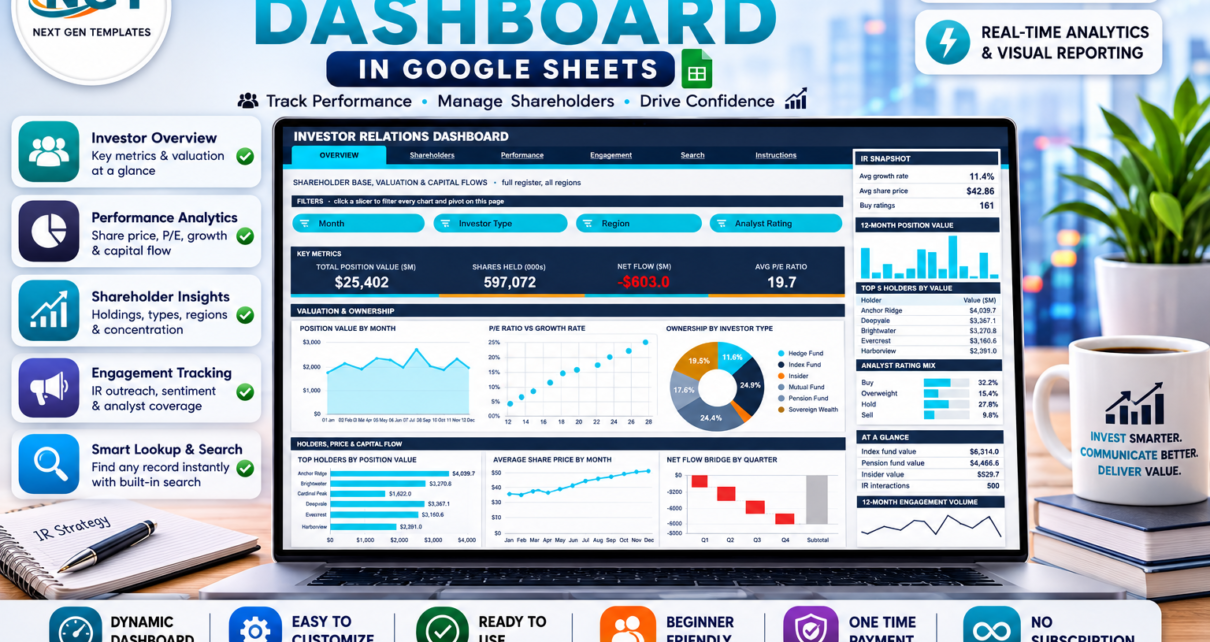
A six-page Investor Relations Dashboard in Google Sheets built on native pivot tables and 15 slicers. Track your shareholder register, share price, capital flows and IR meetings in one file – a reporting tool only, with demo data you replace with your own.
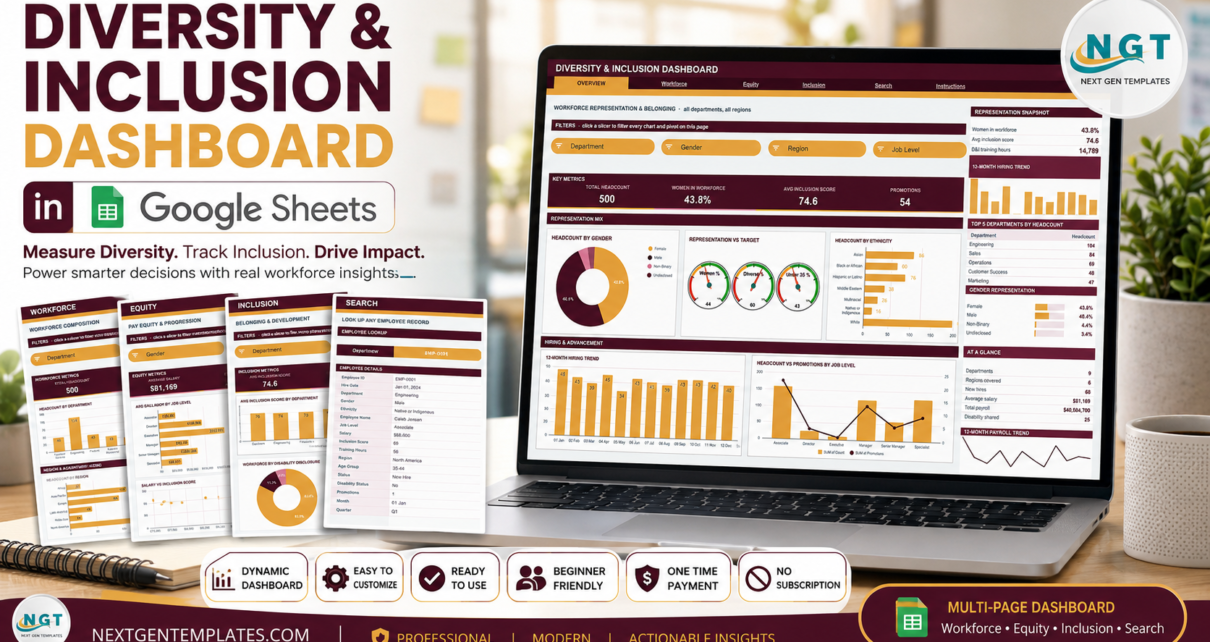
A six-tab Google Sheets workbook that charts workforce representation, pay and inclusion-survey scores from 500 sample employee records using native pivot tables and 16 slicers. A reporting tool only – it charts what you enter and gives no HR or legal advice.
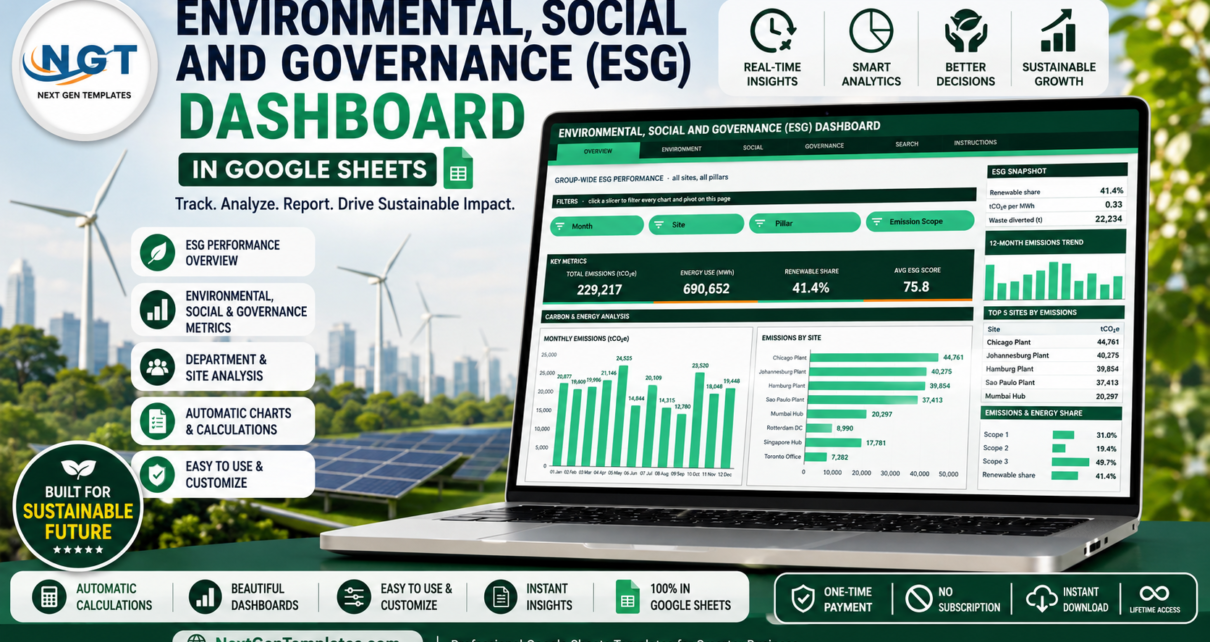
A six-page ESG tracking and reporting dashboard built on native Google Sheets pivot tables and slicers – Environment, Social and Governance each get their own page, plus a record lookup and a built-in user guide.
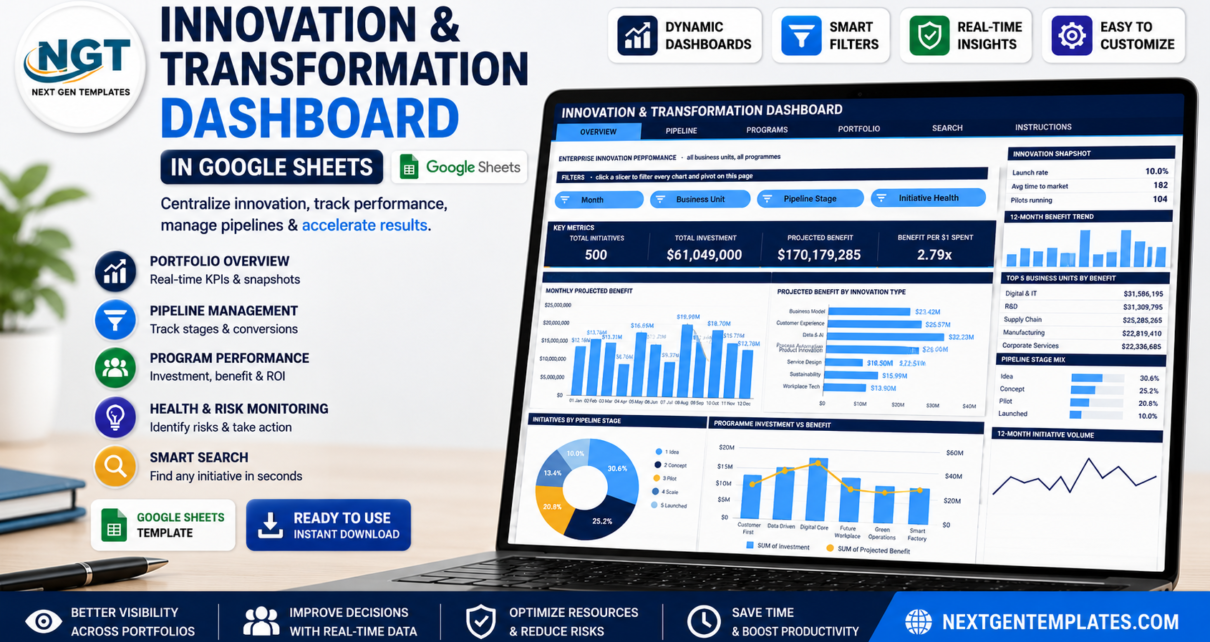
A six-tab Google Sheets dashboard that tracks 500 innovation initiatives, $61,049,000 of investment and $170,179,285 of projected benefit across a five-stage pipeline – built entirely on native pivot tables and slicers.
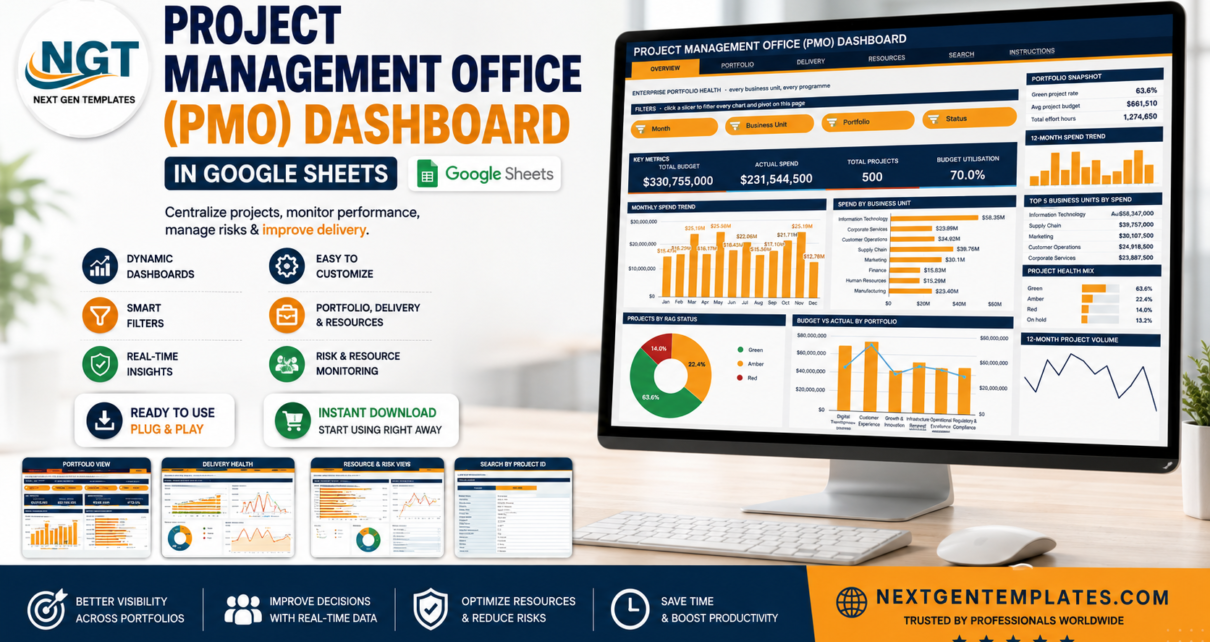
A full walkthrough of the Project Management Office (PMO) Dashboard in Google Sheets – six linked pages, sixteen pivot-driven charts, sixteen slicers, 500 sample projects and a project lookup page for budget, RAG status, milestone and capacity reporting.