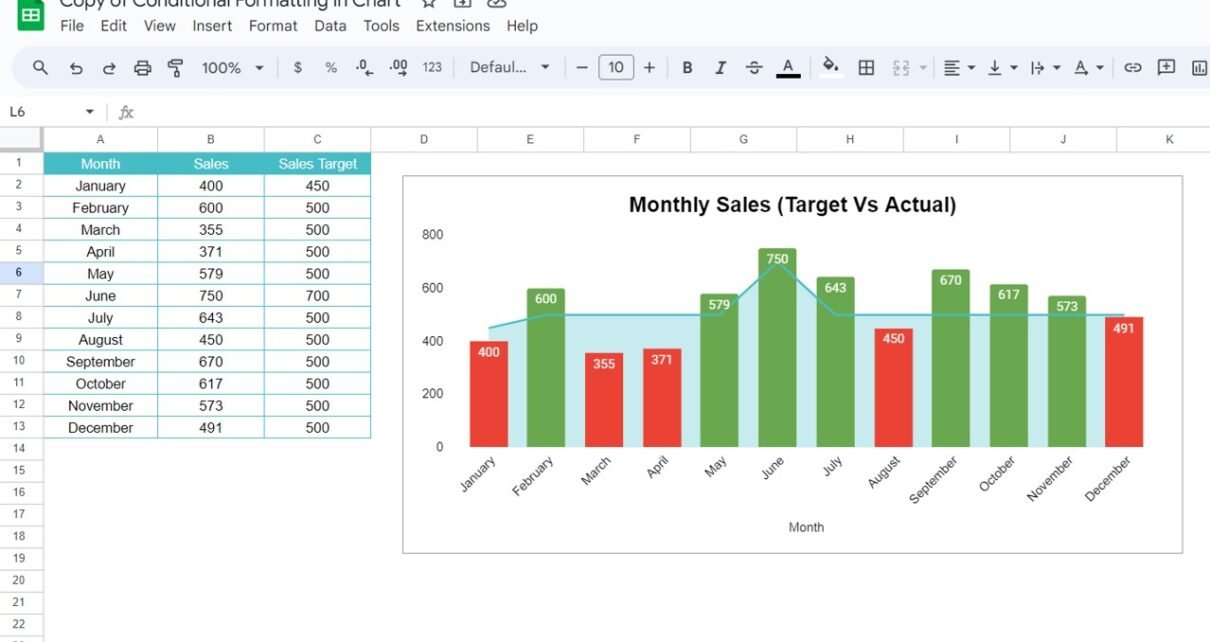
Make Google Sheets chart bars turn red when sales miss the target and green when they meet it, using two IF/NA() helper columns and a stacked combo chart. Free practice file included.
Online Tutorial for Data Analysis and Automation
Make Google Sheets chart bars turn red when sales miss the target and green when they meet it, using two IF/NA() helper columns and a stacked combo chart. Free practice file included.
Compare NETWORKDAYS and NETWORKDAYS.INTL in Google Sheets with a ten-project practice file, weekend codes, holiday handling and worked examples you can check by hand.
Build a dynamic calendar in Google Sheets that redraws itself when you pick a year and month, using DATEVALUE, one SEQUENCE formula, a DD number format and a conditional formatting rule.
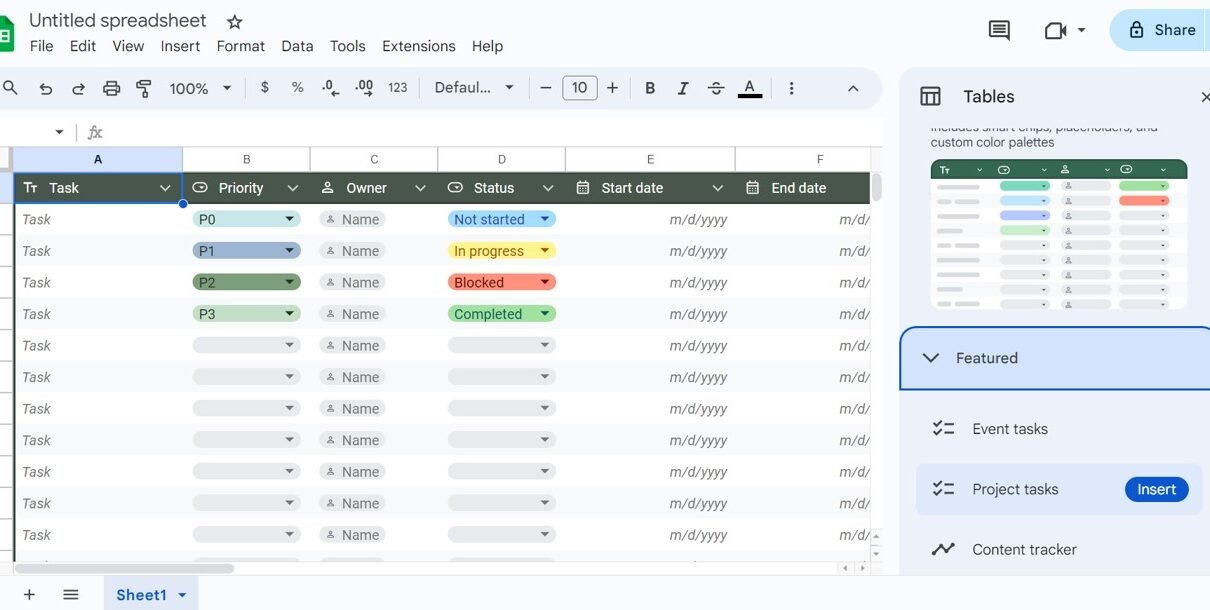
A step-by-step guide to Tables in Google Sheets: insert ready-made tables, set column types, convert a range, change colours, save group-by and filter views, rename tables and use table references like =SUM(Sales_Data[Sales]) in formulas.
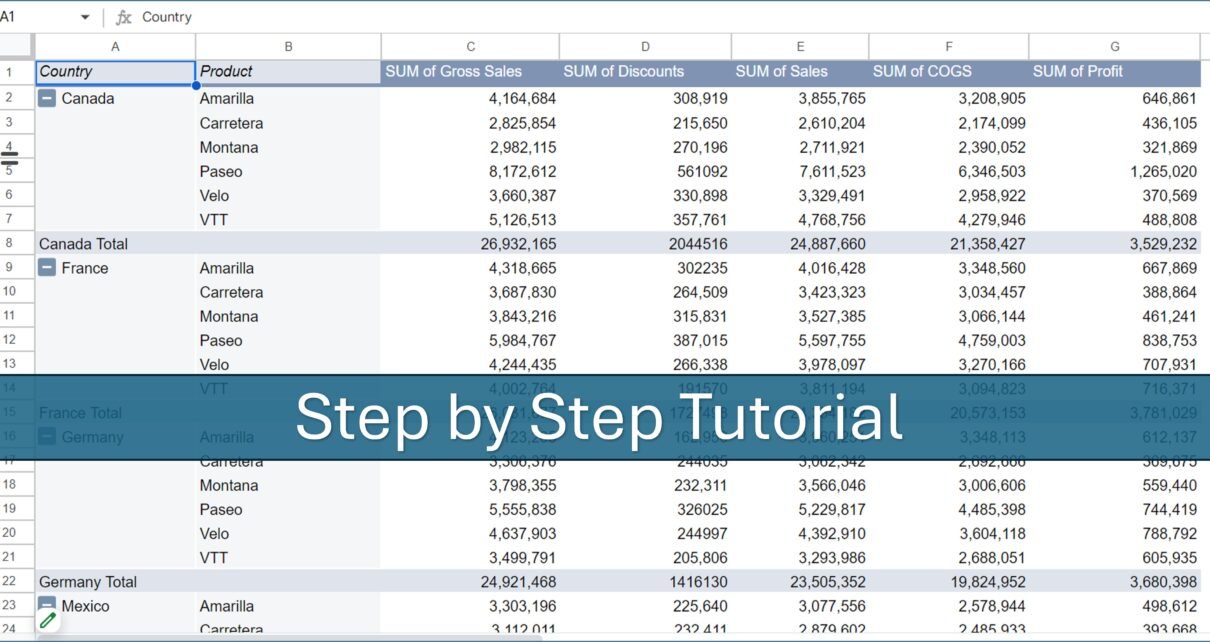
A practical pivot table guide for Google Sheets: build three real summaries from a sales dataset (totals by product, country and product metrics, and percent of sales by segment), plus calculated fields, date grouping and fixes for common problems.
A Google Sheets sales commission template that applies tiered commission rates and target-based bonuses to every sale and totals commission, bonus and earnings for any date range. See each tab, a worked example and the formulas behind it.
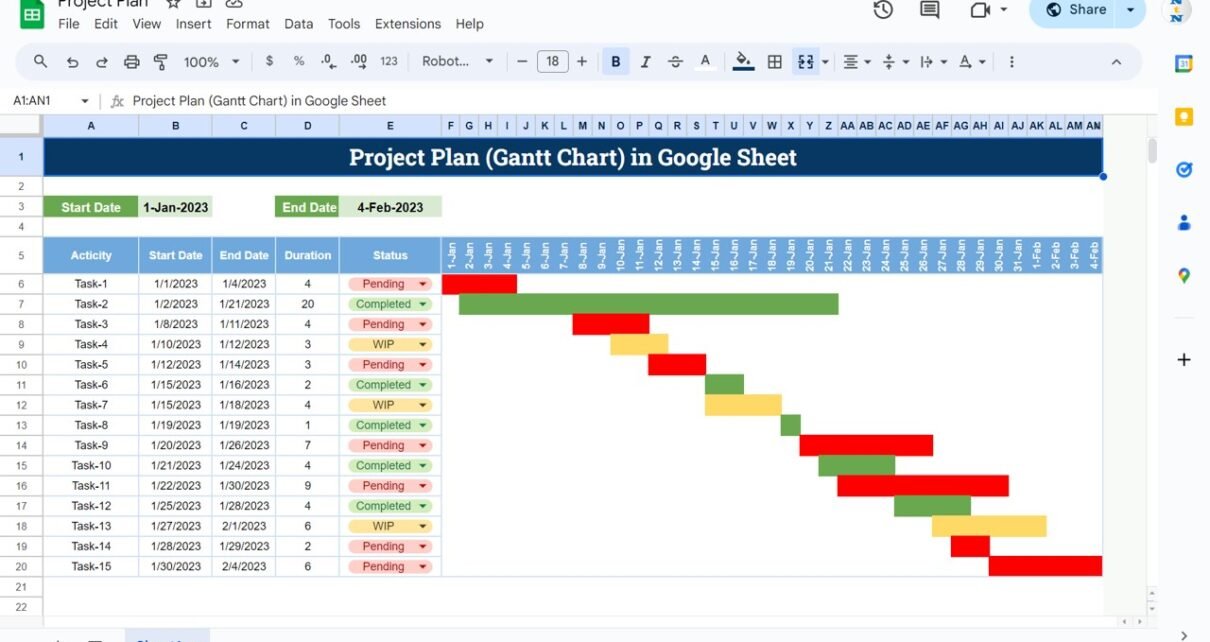
A practical guide to the Project Plan (Gantt Chart) template in Google Sheets: enter tasks, start dates and durations, and the sheet calculates end dates and draws red, amber and green bars by status. Includes the formulas to rebuild it yourself.
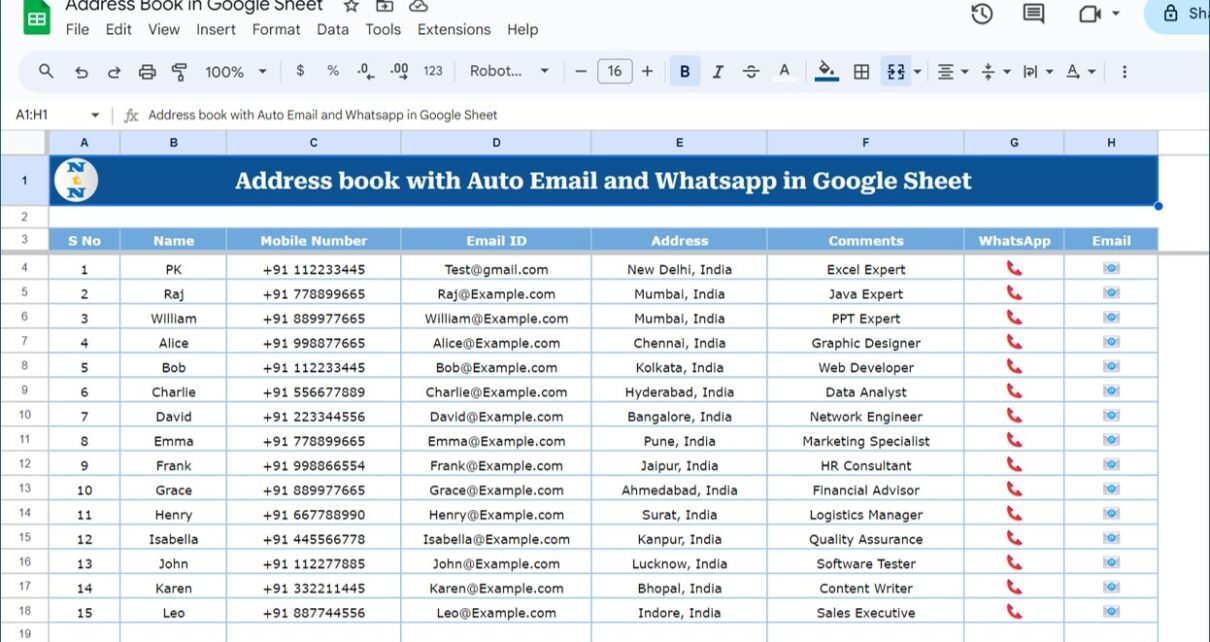
A Google Sheets address book where each contact row has a WhatsApp icon that opens the chat in WhatsApp Web and an Email icon that starts a new message. See the columns, how the links work and the HYPERLINK formulas behind them.
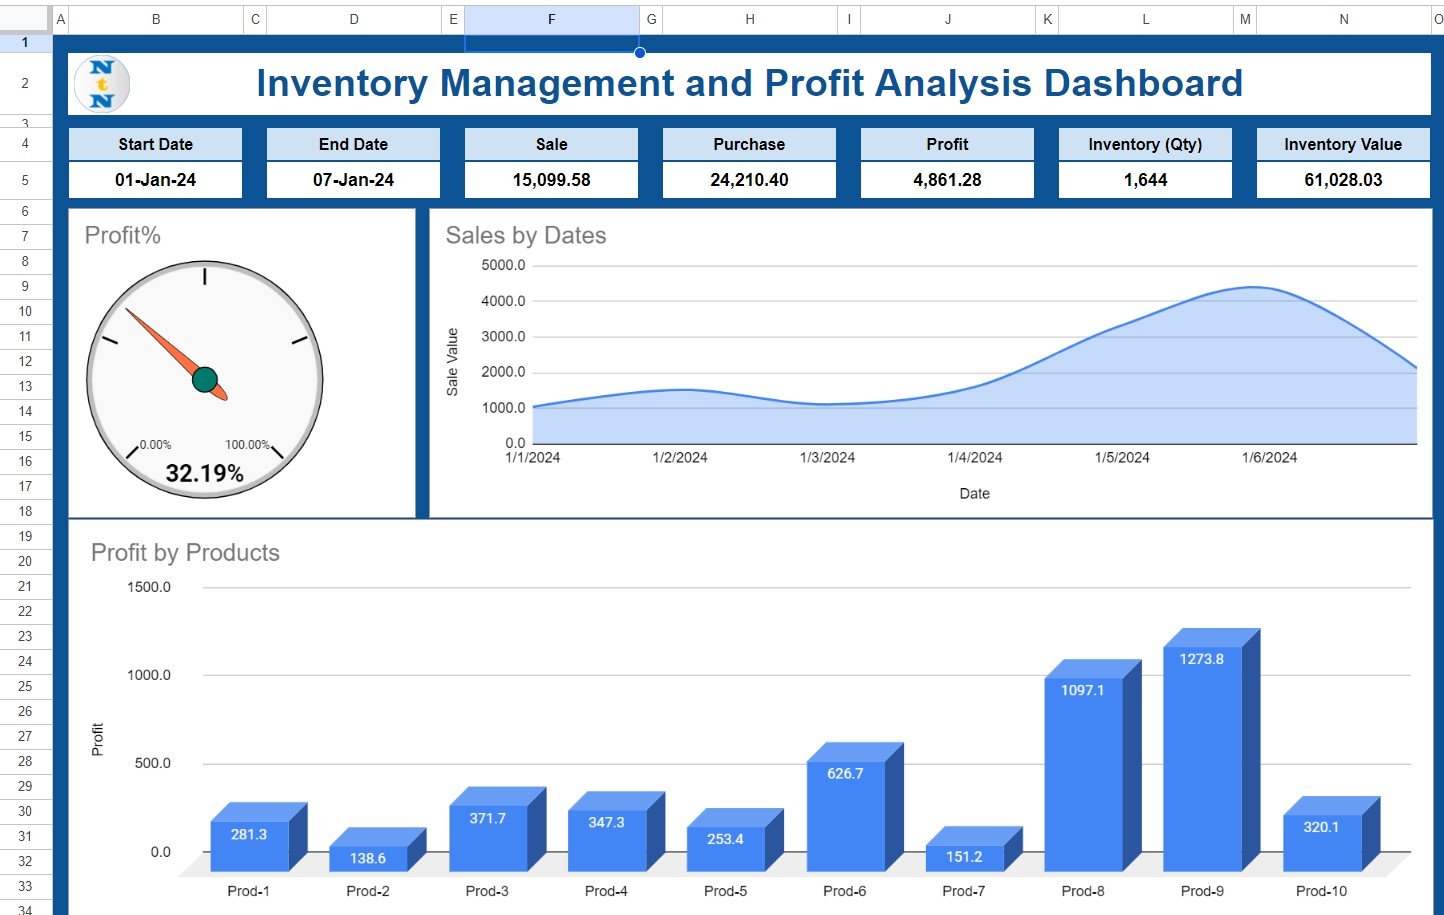
A four-tab Google Sheets template that logs purchases and sales, looks up prices from a product master and shows sales, purchase, profit, Profit% and stock for any date range. See every tab, the formulas and a worked example.
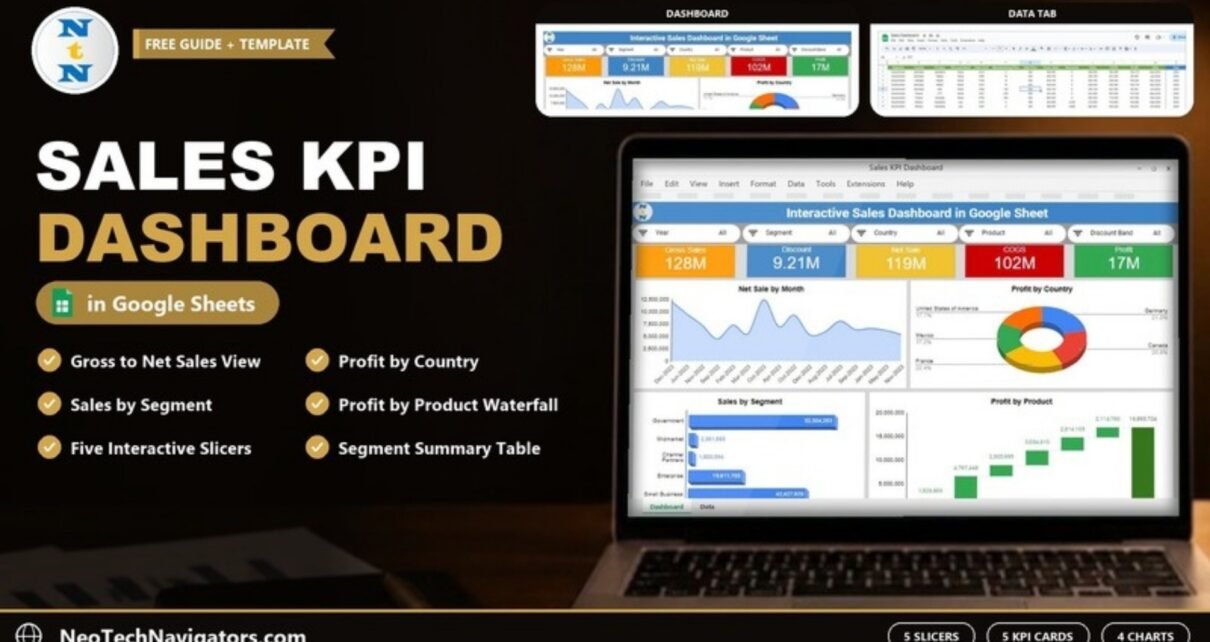
A ready-made Sales KPI Dashboard in Google Sheets with five slicers, Gross Sales, Discount, Net Sale, COGS and Profit cards, and charts by month, country, segment and product. See how each part works and how to load your own data.