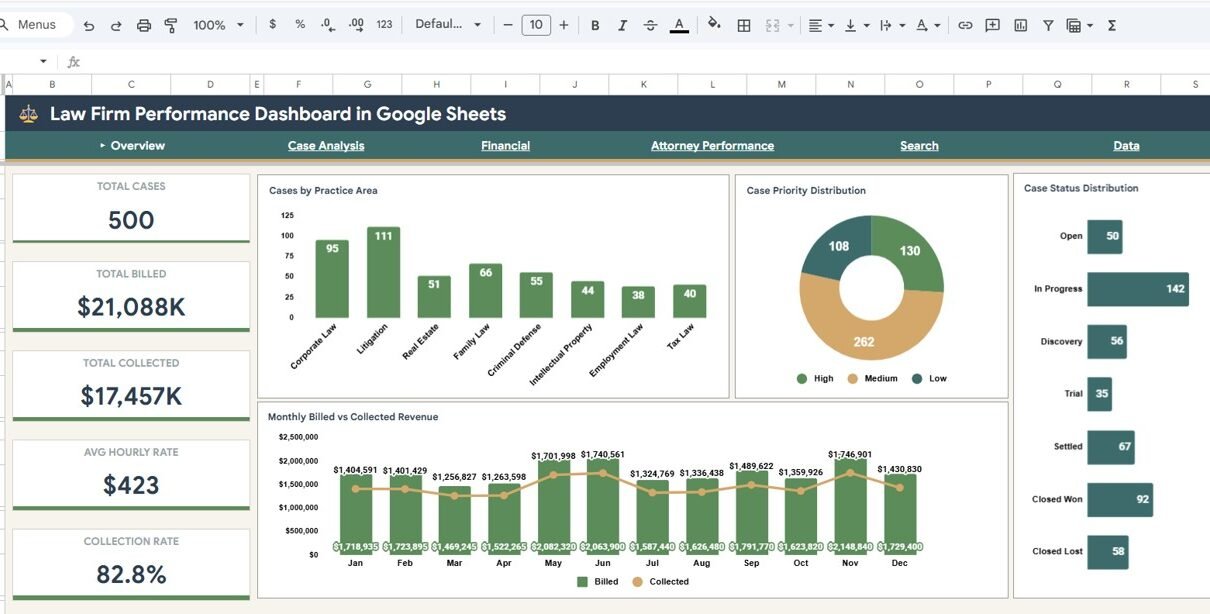
Track law firm billing, collections, case analysis, attorney performance, and financial trends with the Law Firm Performance Dashboard in Google Sheets. 6 interactive pages with dynamic charts, KPI cards, and slicer filters.
Online Tutorial for Data Analysis and Automation
Track law firm billing, collections, case analysis, attorney performance, and financial trends with the Law Firm Performance Dashboard in Google Sheets. 6 interactive pages with dynamic charts, KPI cards, and slicer filters.
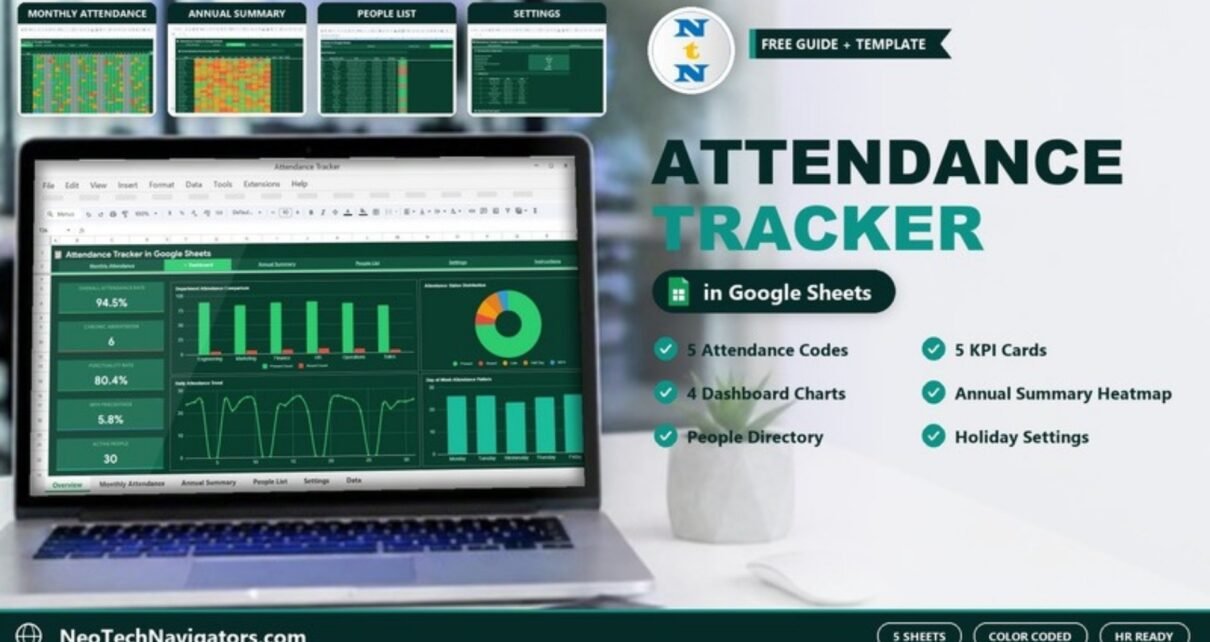
How the Attendance Tracker in Google Sheets works: a colour-coded daily register, a dashboard with attendance rate, chronic absenteeism, punctuality and WFH KPIs, an annual heatmap and simple setup steps.
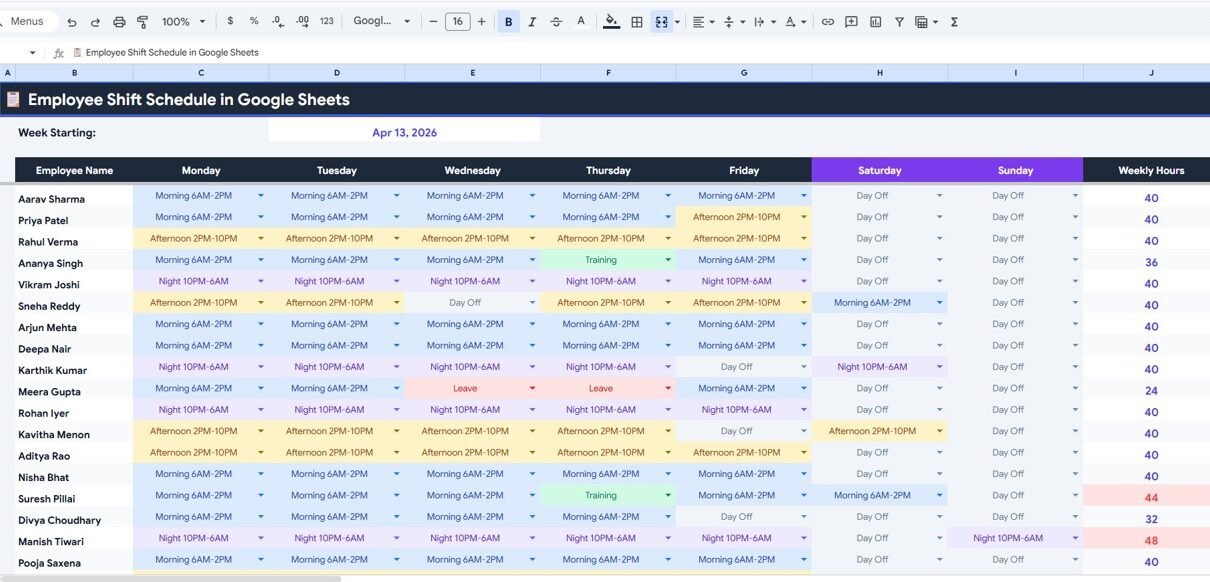
Employee Shift Schedule in Google Sheets with weekly views, monthly calendar, employee directory, KPI dashboard, and customizable shift settings for complete workforce scheduling.
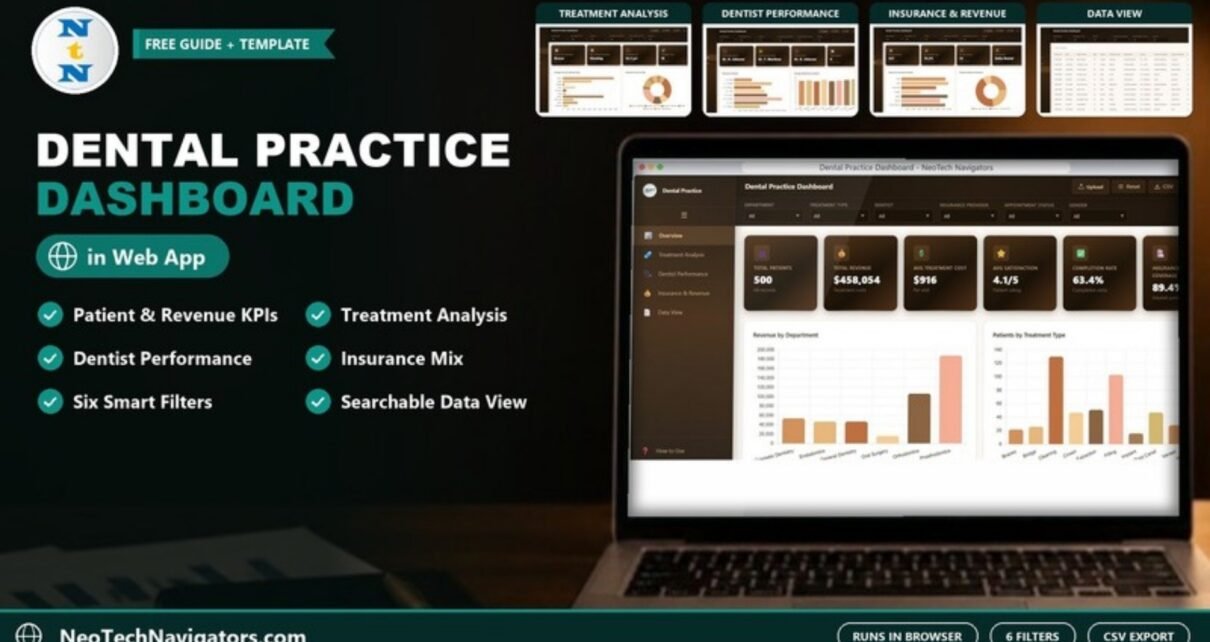
A page-by-page guide to the Dental Practice Dashboard in HTML: patient, revenue, treatment, dentist and insurance KPIs in a browser-based report, plus how to load your own clinic data.
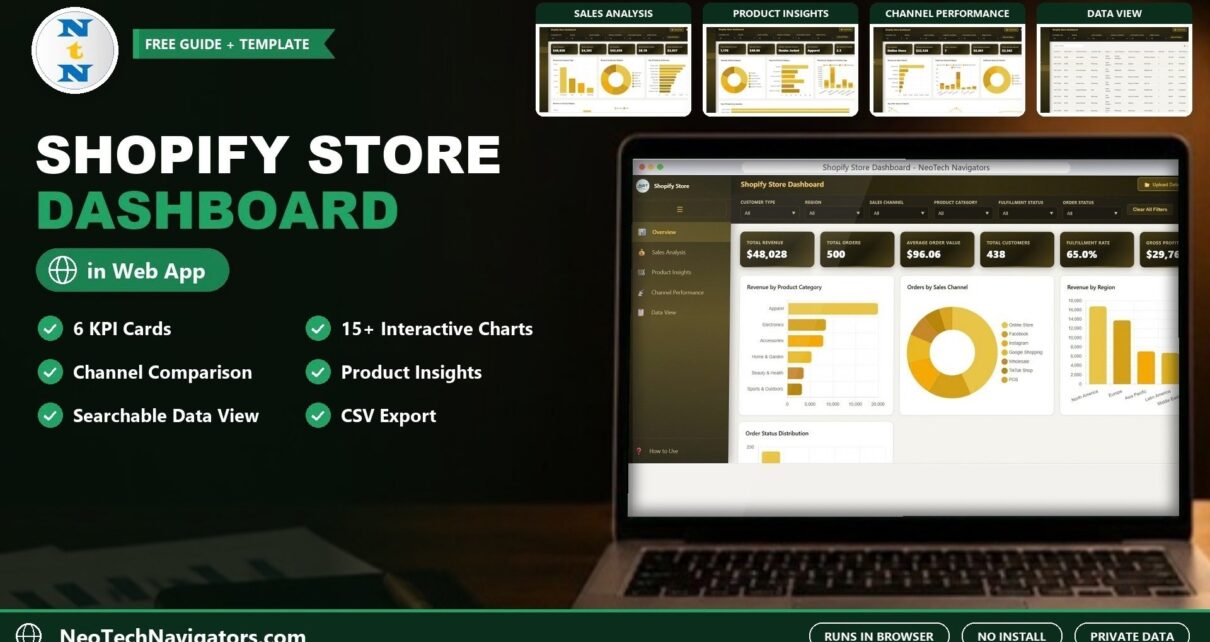
The Shopify Store Dashboard in HTML turns your Shopify order export into 6 KPI cards and 15+ interactive charts across Overview, Sales, Product, Channel and Data View pages, all running in your browser.
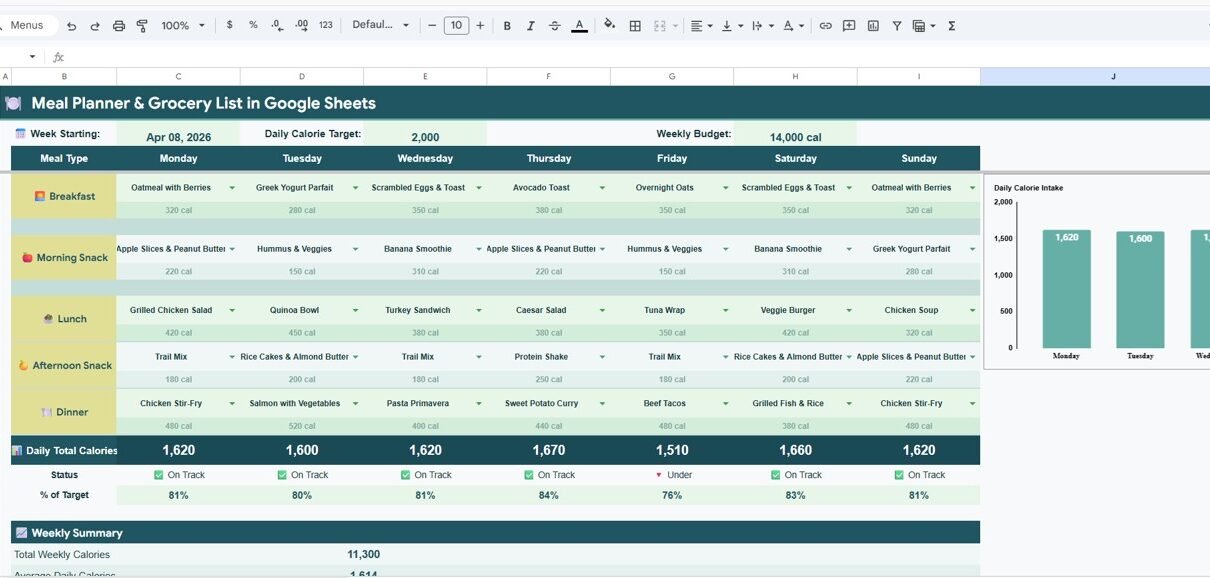
Plan meals, track groceries, monitor nutrition, and manage your food budget with this all-in-one Meal Planner & Grocery List in Google Sheets template featuring 5 professional pages with automated charts and KPI cards.
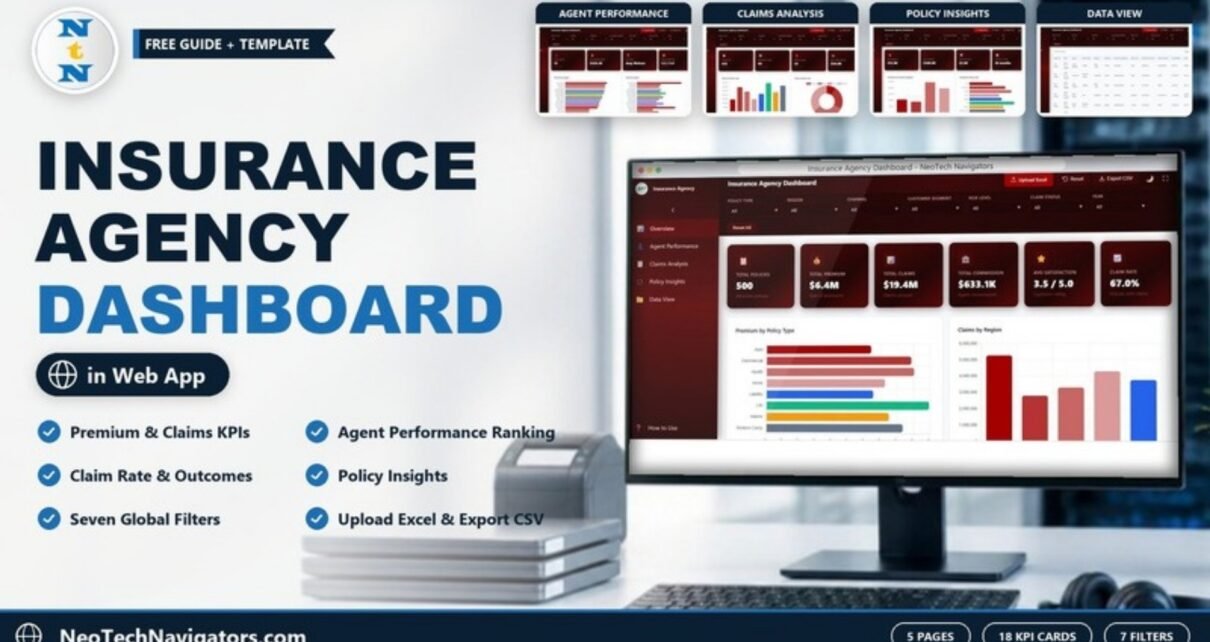
A five-page Insurance Agency Dashboard in HTML that tracks premium, claims, commission, claim rate and agent performance in your browser, with seven filters and a searchable policy table.
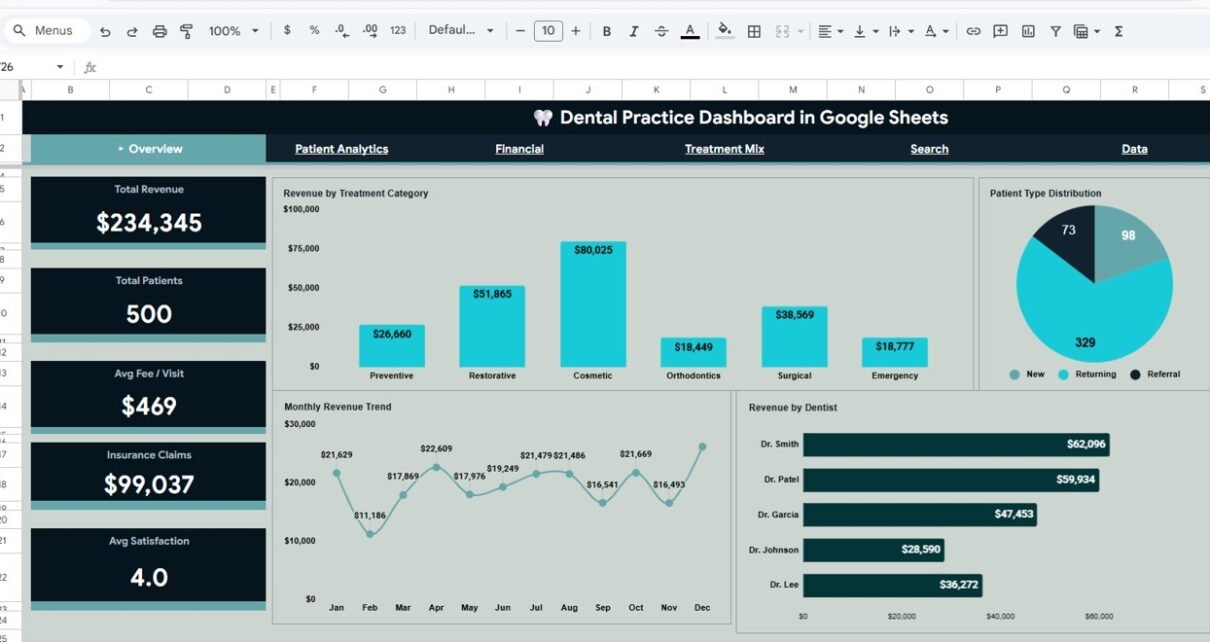
Track revenue, patients, treatment mix, financials, and satisfaction with this interactive Dental Practice Dashboard in Google Sheets. Features 6 analysis pages with 5 KPI cards, dynamic slicers, patient search, and structured data entry.
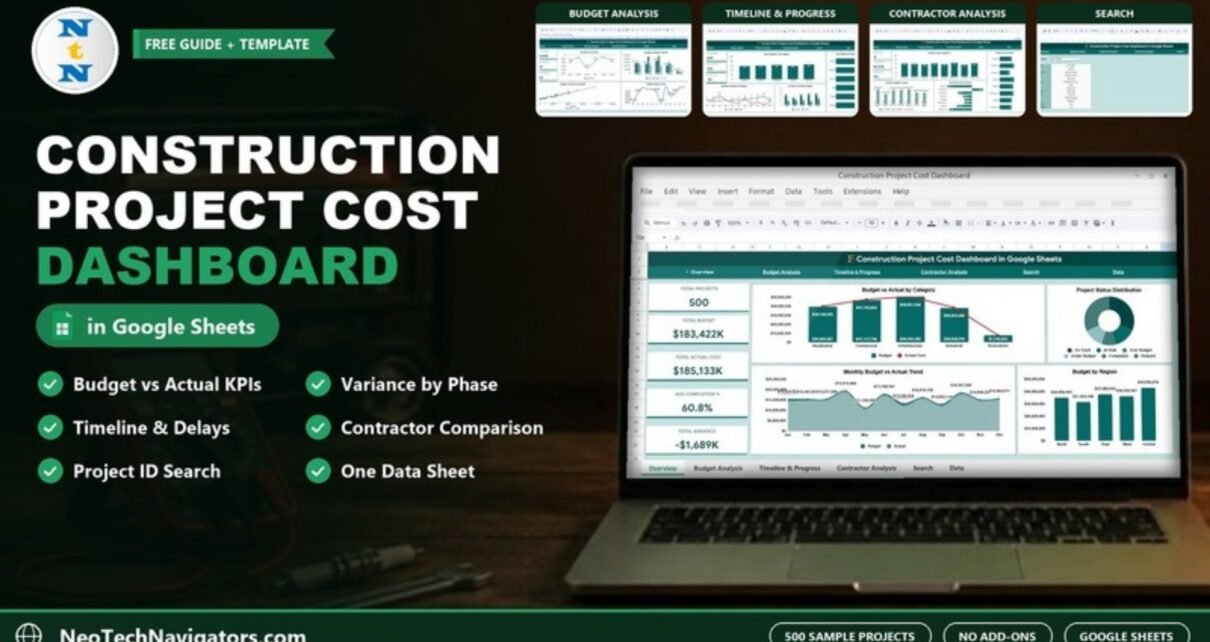
A page-by-page guide to the Construction Project Cost Dashboard in Google Sheets: budget vs actual, variance by phase, timelines, contractor comparison and project search, plus how to load your own projects.
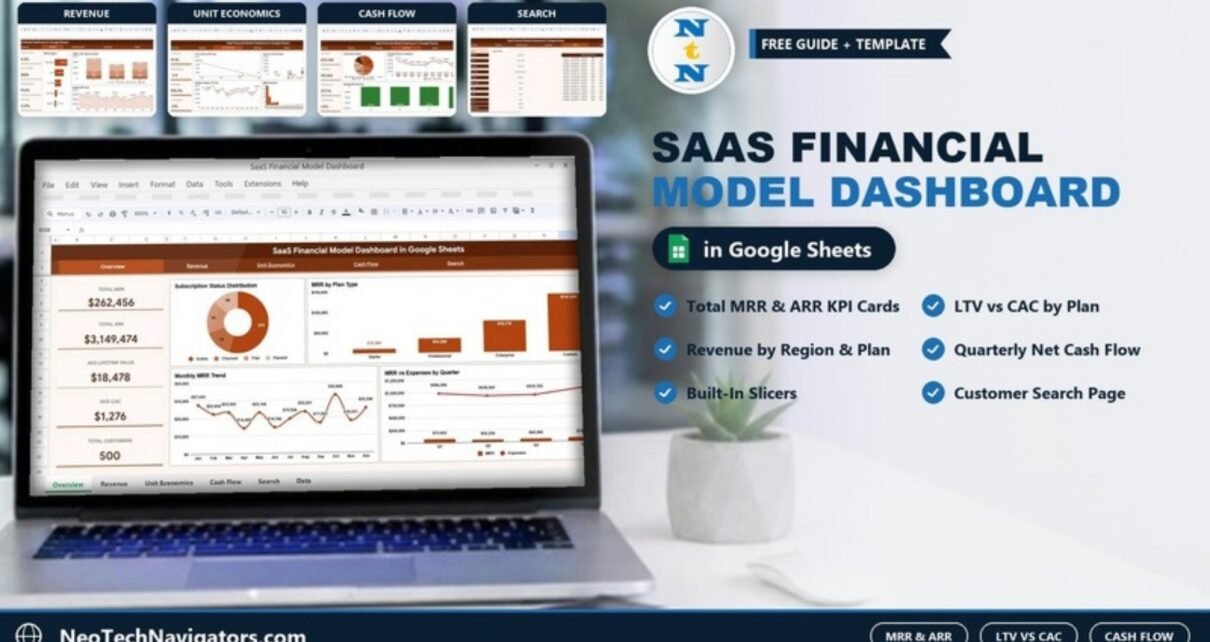
How the SaaS Financial Model Dashboard in Google Sheets tracks MRR, ARR, LTV, CAC, churn and cash flow across four analysis pages, with a worked LTV:CAC example from the sample data and steps to load your own subscription records.