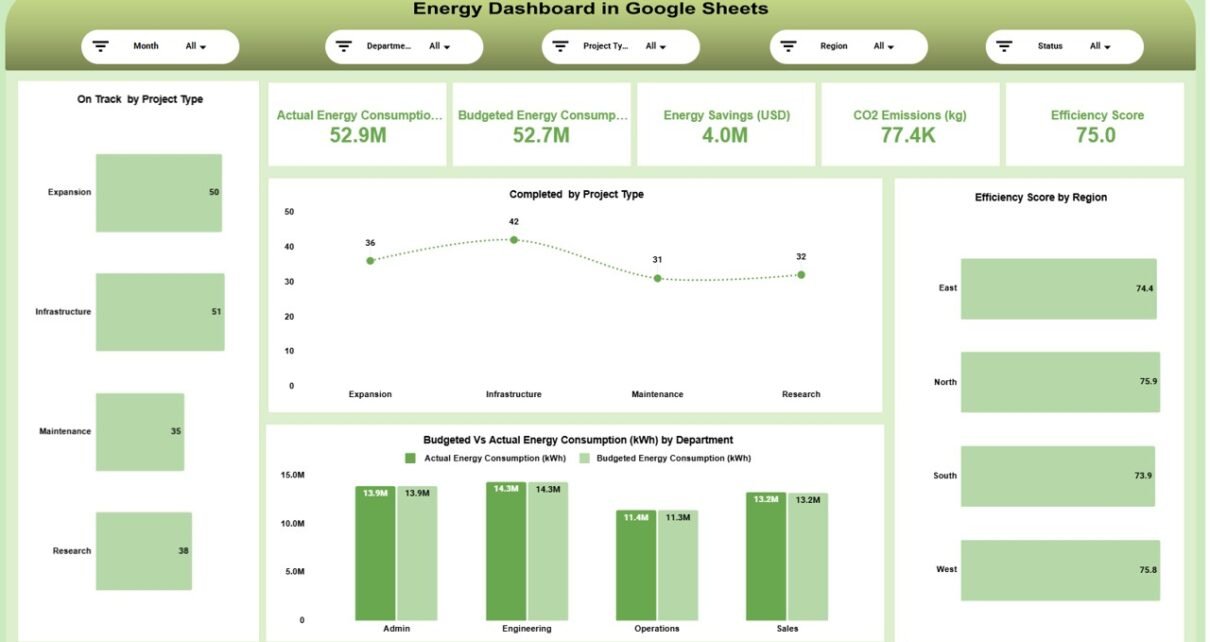
Energy management has become a top priority for every organization. Costs keep rising. Sustainability goals become stricter. Meanwhile, companies must reduce carbon emissions while improving efficiency. However, many businesses still track energy data in scattered spreadsheets. As a result, managers struggle to monitor real performance. So, how can you track energy consumption, savings, CO₂ emissions, […]
Dashboard
Google-Sheets-Dashboard
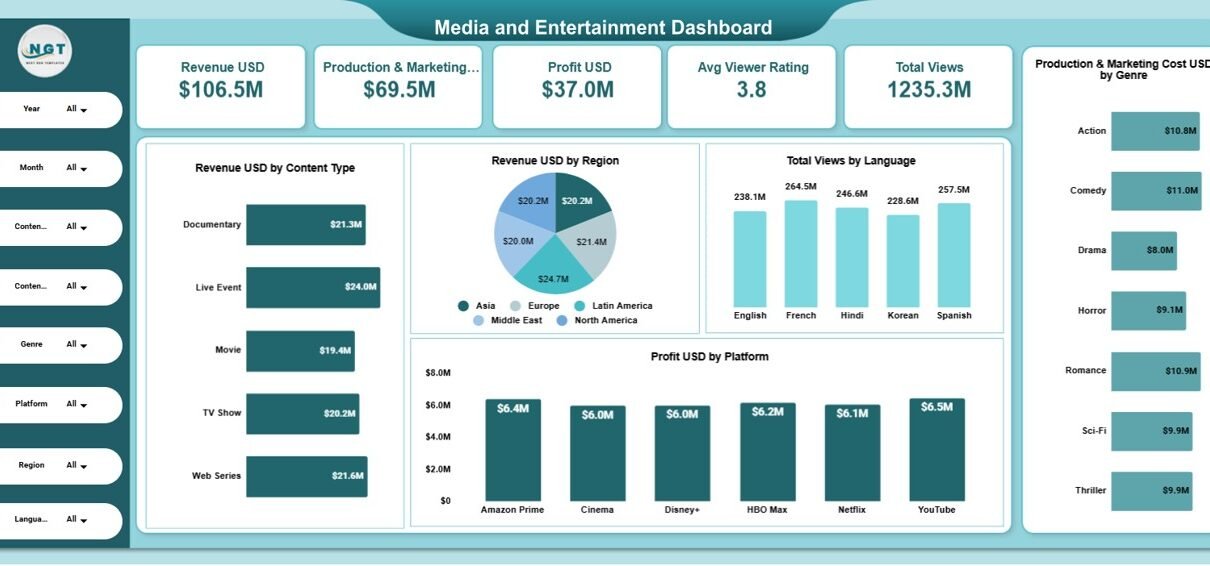
Media and Entertainment Dashboard in Google Sheets
The media and entertainment industry moves fast. Content launches every week. Platforms compete daily. Audience preferences change quickly. Meanwhile, production and marketing costs keep rising.Media and Entertainment Dashboard in Google Sheets So, how can studios, OTT platforms, content creators, and media companies track revenue, profit, views, ratings, and regional performance in one structured system? Media […]
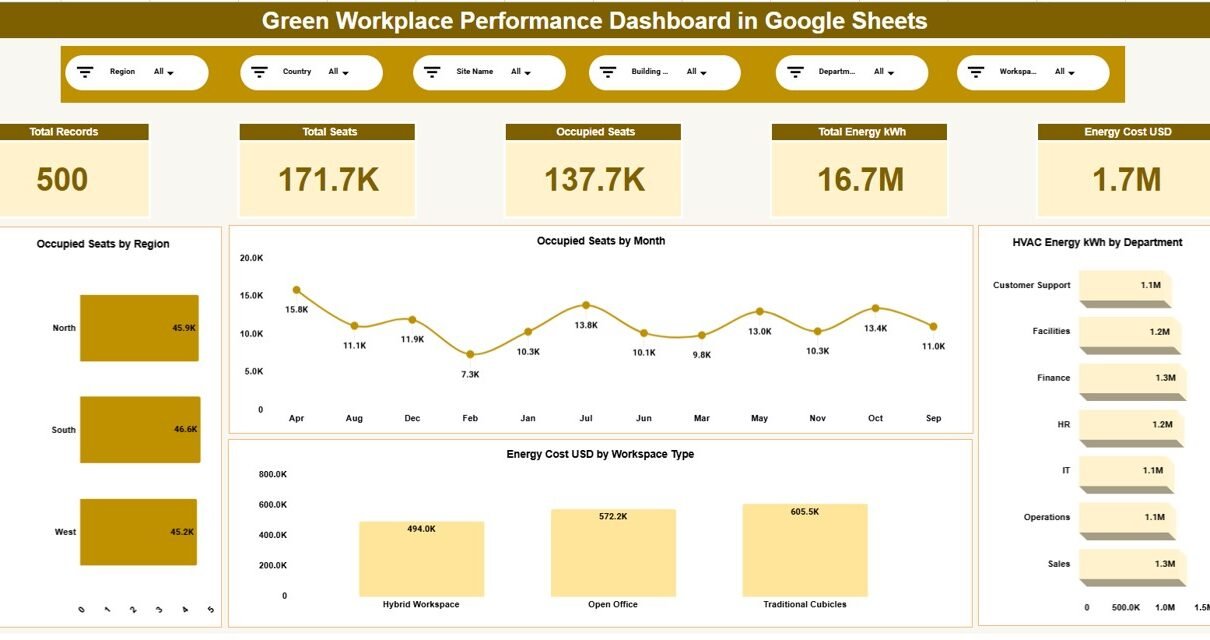
Green Workplace Performance Dashboard in Google Sheets
Sustainability is no longer optional. Organizations must reduce energy usage, control water consumption, and manage waste effectively. However, many companies still track environmental performance using disconnected reports. As a result, leaders struggle to monitor sustainability metrics clearly. Therefore, you need a centralized and structured system.Green Workplace Performance Dashboard in Google Sheets The Green Workplace Performance […]
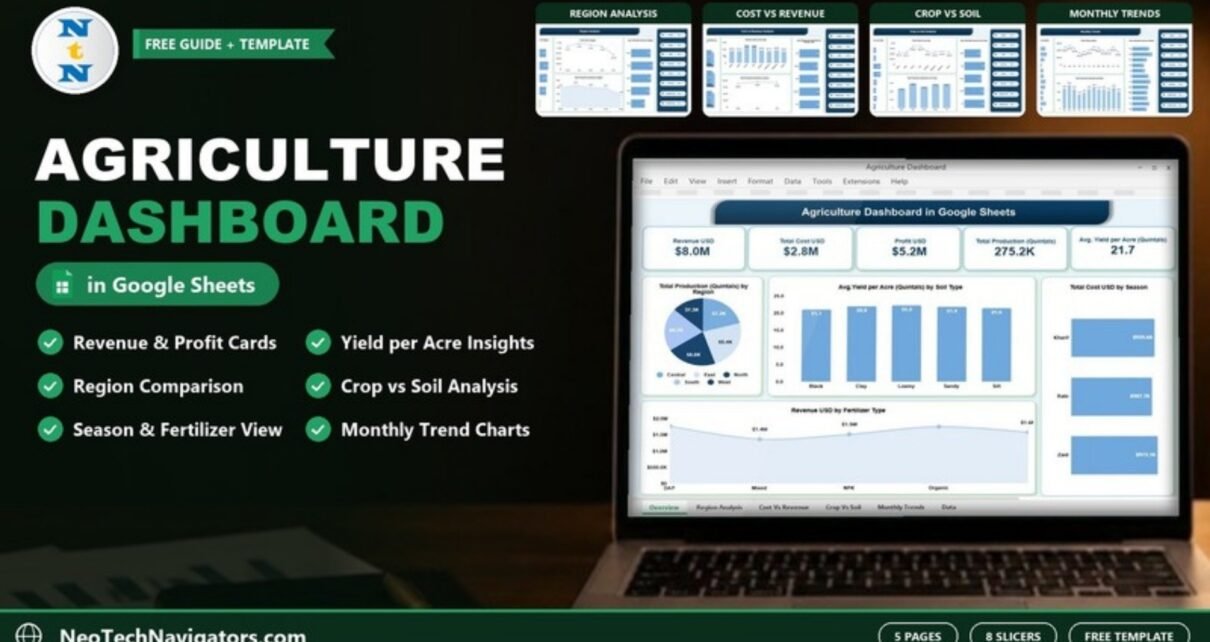
Agriculture Dashboard in Google Sheets
A five-page Agriculture Dashboard in Google Sheets that shows farm revenue, cost, profit, production and yield per acre by region, crop, soil, fertilizer, season and month, with eight slicers and a worked example.
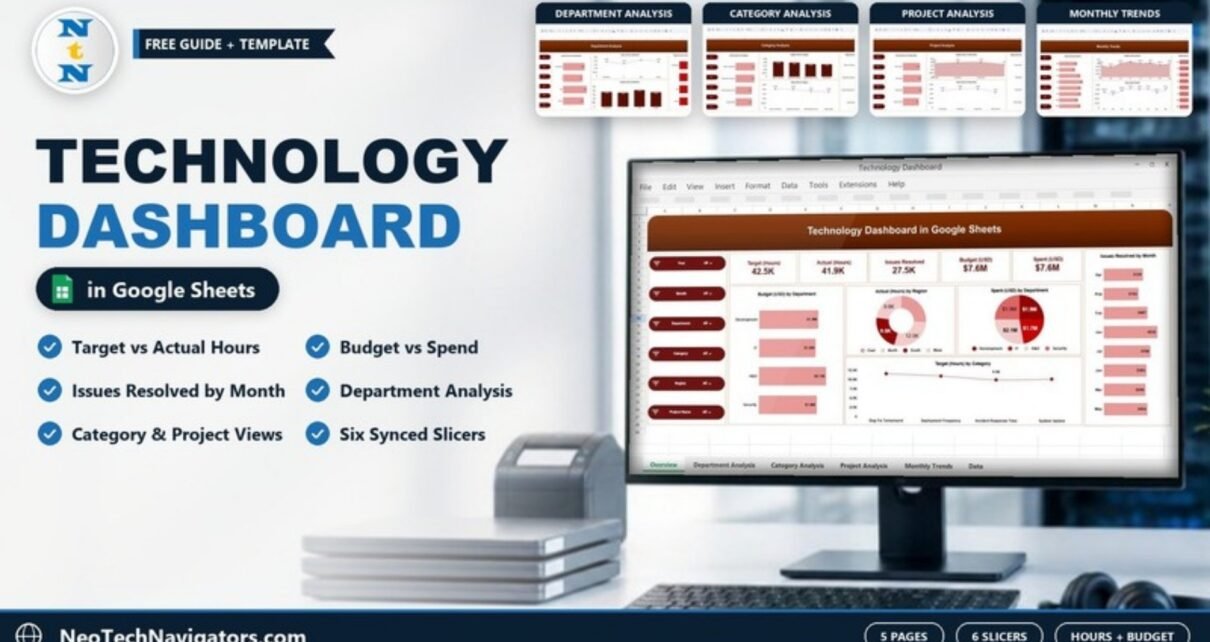
Technology Dashboard in Google Sheets
A five-page Technology Dashboard in Google Sheets that tracks target vs actual hours, issues resolved, budget and spend by department, category, project and month.
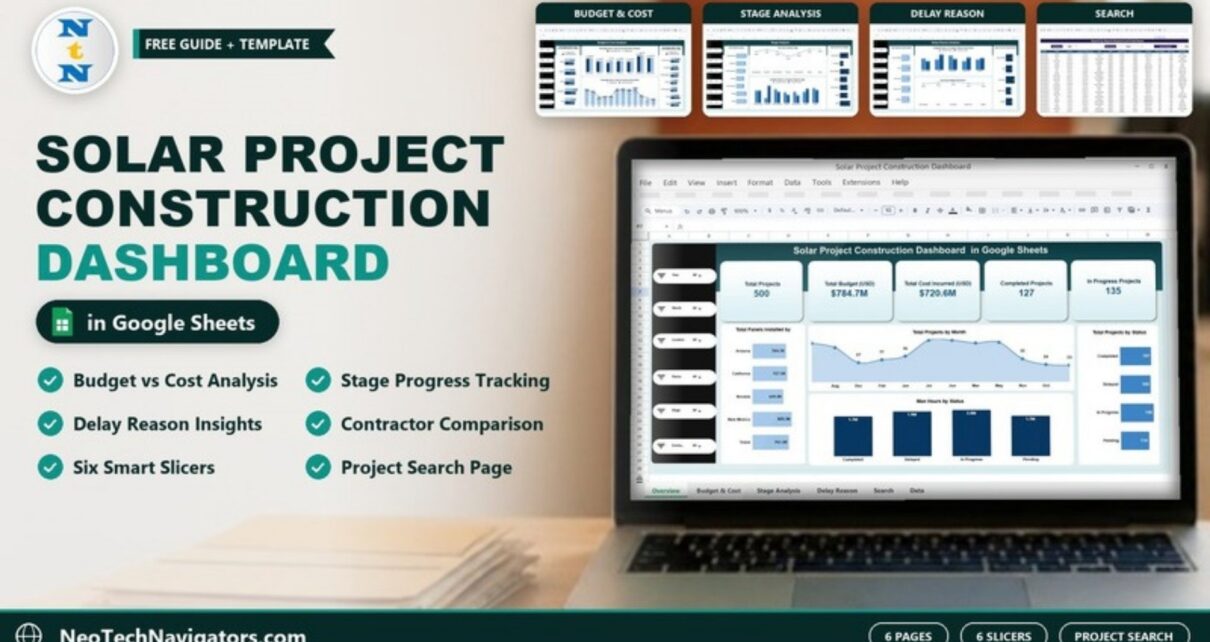
Solar Project Construction Dashboard in Google Sheets
A six-page Google Sheets dashboard for solar EPC teams that tracks budget against cost, stage progress, delay reasons and contractors, with slicers and a project search page. See every page and a worked overrun example.
CSR Program Performance & Impact Dashboard in Google Sheets
The CSR Program Performance & Impact Dashboard in Google Sheets is a ready-to-use analytics solution designed to help organizations track, measure, and evaluate the effectiveness of their Corporate Social Responsibility (CSR) initiatives.CSR Program Performance & Impact Dashboard in Google Sheets Instead of managing CSR data across multiple spreadsheets and reports, this dashboard consolidates projects, budgets, […]
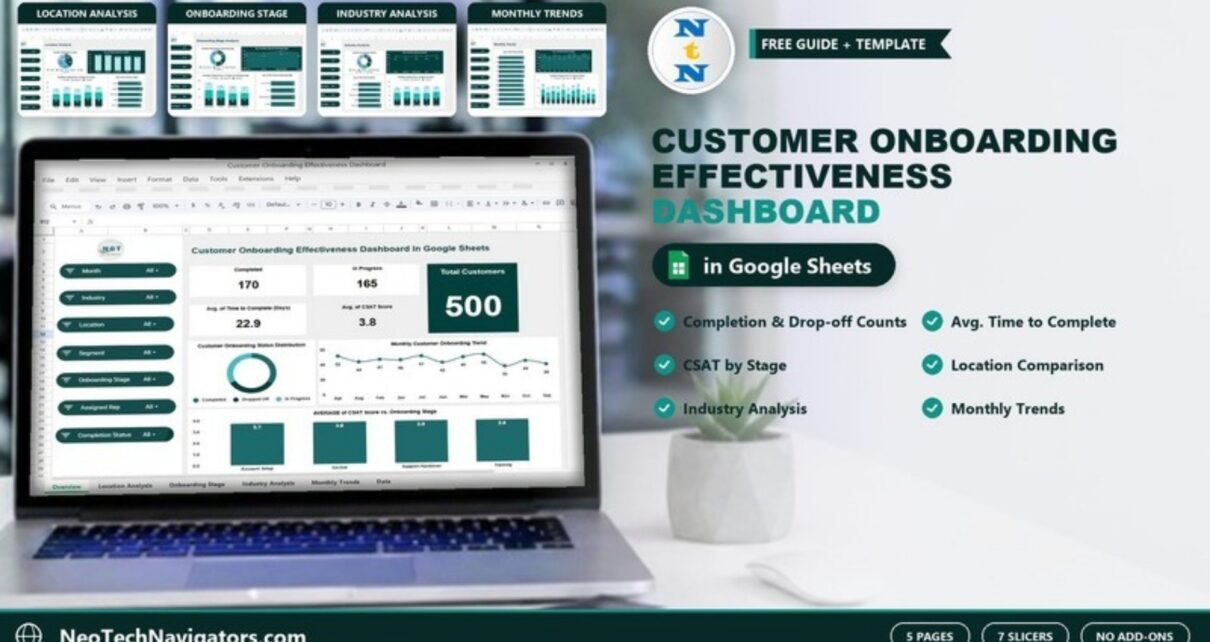
Customer Onboarding Effectiveness Dashboard in Google Sheets
A five-page Google Sheets dashboard that tracks customer onboarding completion, drop-offs, time to complete and CSAT by location, stage, industry and month, with seven slicers for drill-down.
Employee Performance and Attrition Dashboard in Google Sheets
Managing employee performance and reducing attrition are two of the biggest challenges for modern organizations. When employee data stays scattered across spreadsheets, HR systems, and reports, leaders struggle to identify trends and take timely action. That is exactly where the Employee Performance and Attrition Dashboard in Google Sheets becomes a powerful, ready-to-use solution. In this […]
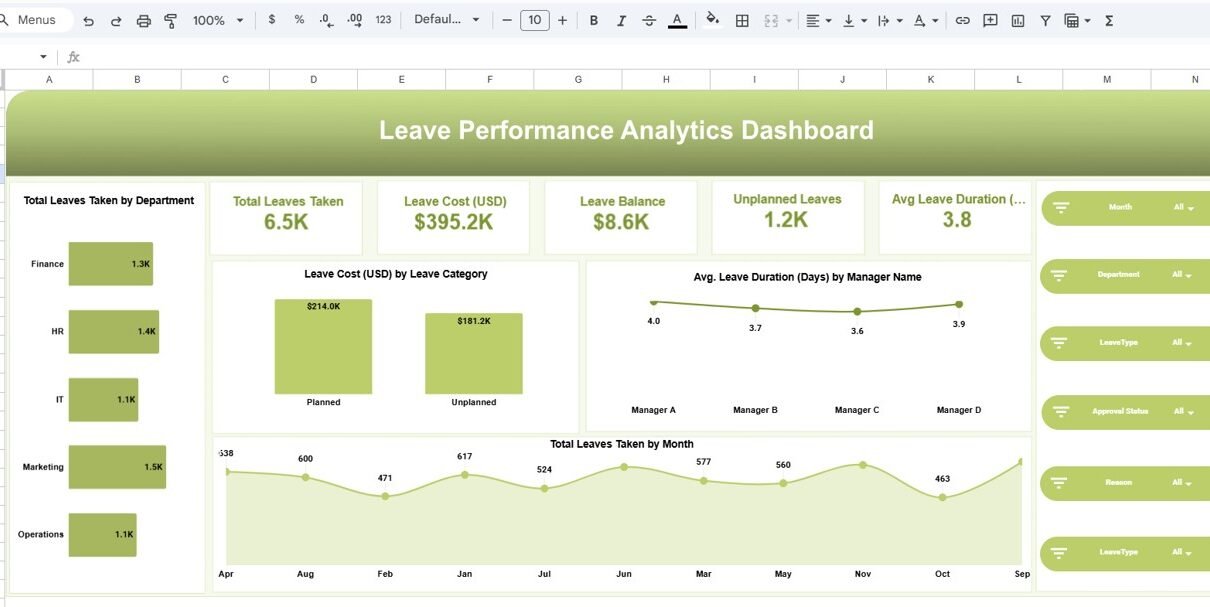
Leave Performance Analytics Dashboard in Google Sheets
Managing employee leave efficiently plays a critical role in workforce productivity, cost control, and employee satisfaction. However, when leave data remains scattered across registers or raw spreadsheets, decision-making becomes slow and reactive. That is exactly why the Leave Performance Analytics Dashboard in Google Sheets becomes an essential solution. Get the Leave Performance Analytics Dashboard in […]